 Duplex
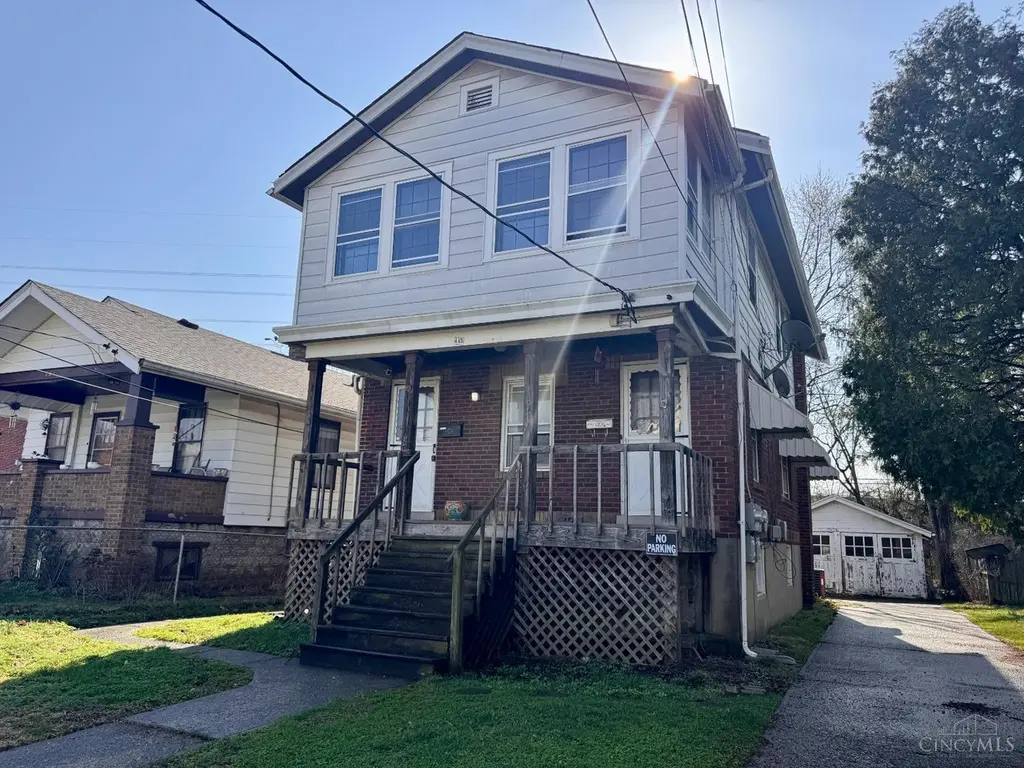
645 Blanche Ave · Arlington Heights, OH
Flood risk 9/10 · Severe
- FEMA flood zone
- X (unshaded)
- Chance of flooding over 30 yrs
- 0.99%
- Est. flood insurance / yr
- $473 – $860
Fire risk 1/10 · Minimal
- Est. fire insurance / yr
- $713 – $1,323
Heat risk 5/10 · Moderate
- Hot days now (above 103°F)
- 7 days/yr
- Hot days in 30 yrs
- 19 days/yr
Wind risk 2/10 · Minimal
- Chance of severe wind over 30 yrs
- 1.0%
Air-quality risk 3/10 · Minor
- Unhealthy air days now
- 2 days/yr
- Unhealthy air days in 30 yrs
- 3 days/yr
Risk factors via First Street. Map © Google.
Why this score? — see what drove the B+ grade
The composite is a weighted blend of 9 inputs, each scored 0–100. Each bar is that input's sub-score; the figure is the points it added to the 100-point composite (weight × sub-score).
- Cash flow +29.0/30.0
- ARV discount +15.0/15.0
- DSCR +10.0/10.0
- 1% rule +9.3/10.0
- Rent growth +4.5/5.0
- Livability +3.7/5.0
- Condition / age +2.5/5.0
- Schools +1.6/10.0
- Appreciation +0.0/10.0
$140,000
🖨 Deal sheet 📄 Offer letter ✓ Due diligence
Multi-family units
County records classify this as Multi-Family (2-4 Unit). Listing-text estimate: 2 units. confirmed
Listing remarks MLS
Calling all investors and house hackers, this duplex is begging to be a part of your portfolio. Both units feature separate utilities and individual washer and dryer hookups, with a shared water heater. Each unit offers spacious rooms and access to a full basement. Unit 1 is a 1-bedroom, 1-bath unit, while Unit 2 is a 2-bedroom, 1-bath unit with an enclosed porch, perfect for added living space or rental appeal. The property also includes a 3-car garage and a large fenced-in yard.
Key facts
- Large fenced-in yard
- Full basement
- Enclosed porch
Tags
Neighborhood map
What this means for you Summary
Snapshot
- This is a 1×1bd/1ba + 1×2bd/1ba units multifamily listed at $140k.
Deal economics
- At list price, monthly cash flow is $423 ($5k/yr) — positive. Per door: $212/mo.
- The deal already cash-flows at list — no discount required.
- Meets the 1% rule at list price ($2k rent vs $140k).
- Recommended offer: $132k (6.0% below list) — sets the bar for market timing.
Location & tenants
- Location reads 73/100 on livability (#334 in OH) — a middle-class / working-renter tenant base. Strengths: commute A+, cost of living A+, housing A-; Watch: health & safety C-, crime D, schools D-.
- Lockland Local (suburban): math 16% / reading 23% proficiency, ranked #632 of 656 in OH (top 96%) — low school quality limits family demand, transient renter base, plan for 1-2y turnover; 79% free/reduced lunch — lower-income household profile, screen leases tightly.
- Market conditions: Rents rising fast (+8.0%/yr); 47 active listings in the ZIP; 11 comparable units currently listed for rent nearby; rentals at typical pace (median 24d on market — plan ~3-4 weeks tenant-placement turnaround); 801 units permitted in Hamilton County in 2024 (190 in 5+ unit buildings).
- This rent runs 35% of the median local income ($69k/yr) — at the standard rent-burdened threshold; future hikes will face affordability resistance.
Forward outlook
- Local home prices are declining (-3.0%/yr); year-one equity from $968 of loan paydown is wiped out by about $4k of value loss. Plan a longer hold.
- At projected returns (-3.0% appreciation + 8.0% rent growth), your $39k cash investment doubles in ~7 years — after that, you're playing with house money.
Negotiation context
- It's been on market 84 days — a 6% lower offer ($132k) is reasonable based on typical stale-listing flexibility.
- 8 sale attempts since 15y ago; this cycle's ask has dropped $10k (7%) from the opening price — seller is motivated, your offer sets the floor, not the list.
Risks & watch-outs
- Watch-outs: property tax is 2.7% of price; flood insurance adds $56/mo; built in 1930 — expect roof / HVAC / electrical / plumbing capex.
- Climate carrying-cost: severe flood risk; extreme-heat days projected 7→19/yr by 2055 (HVAC capex compounding) — expect insurance premiums to compound above CPI over the hold.
Questions for the listing agent
- It's been on market 84 days. Have you received any prior offers? Is the seller open to a 6% concession, seller financing, or rate buy-down credit?
- Can we see the unit-by-unit rent roll, current vacancy, and any below-market leases? What's the average tenancy length?
- What capital expenditures (roof, boiler, parking lot, exteriors) have been made in the last 5 years, and what's planned in the next 2?
- Built in 1930 — when were the roof, HVAC, electrical panel, plumbing, and water heater last replaced?
- Property tax is high relative to price — has the assessment been appealed recently, and will the sale trigger a re-assessment?
- What's the actual annual flood-insurance premium (NFIP or private), and is the property in a SFHA with mandatory coverage?
- Why hasn't it sold? Are there any deal-killer items the seller is aware of (foundation, flood, title, zoning, code violations)?
- Is there a deadline driving the sale (1031 exchange, divorce, estate, relocation)? That informs how much negotiation room exists.
- Schools are D-rated, which usually means shorter tenancies and higher turnover. Who's the typical renter profile here, and what's been the actual vacancy rate?
- Crime grade is D in this area — have there been break-ins, vandalism, or insurance claims at this property in the last 3 years? What carrier currently insures it and at what premium?
- What's the average days-on-market for RENTAL listings here right now (not sales)? A rising rental-DOM trend means longer vacancies and softer asking-rent achievability than the comps imply.
- What's the recent tenant-quality profile in this submarket — average credit score on applications, eviction rate, late-payment / NSF rate, and stable-employment percentage? A property-management company in the area should have these aggregated.
- How much new apartment / multifamily construction is in the pipeline within 1–3 miles? Heavy new supply (>2% of stock underway) typically softens rents 12–24 months out; light construction supports rent growth.
Investment metrics
- 1% rule
- 1.43% ✓
- Cap rate
- 10.40%
- Cash-on-cash
- 14.66%
- DSCR
- 1.65
- GRM
- 5.8
CMA / ARV
- ARV (median comp)
- $198,932
- List price
- $140,000
- Delta
- -29.62%
- Verdict
- UNDERPRICED
- Comps
- 20 within 1.0 mi
Projected returns pro-forma
-3.0% appreciation · 8.0% rent growth · sell at horizon
- IRR
- 9.1%
- Equity multiple
- 1.38×
- Total profit
- $15,023
- Equity at exit
- $20,874
- IRR
- 22.6%
- Equity multiple
- 3.47×
- Total profit
- $96,635
- Equity at exit
- $12,105
Cash invested: $39,200 (down + closing). Projections, not guarantees.
Landlord ↔ Tenant lean methodology
- Overall (STATE)
- 73 Landlord-Friendly
- State Ohio
- 73 Landlord-Friendly · R+6
- County
- — inherits STATE
- City
- — inherits STATE
ZIP-level market 45215
- Rents YoY
- 8.0%
- Active inventory
- 47
- Price-to-rent
- 12.1×
Monthly cashflow live
- Estimated rent
- $2,005 high interval (Pro) →
- Mortgage (P&I)
- −$734
- Tax from tax record
- −$313 /mo · $3,750/yr
- Insurance
- −$58
- Flood insurance flood zone
- −$56 /mo · $666/yr
- HOA
- −$0
- Vacancy / Maint / Mgmt
- −$421
- Net cashflow
- $423
Break-even live
2-unit breakdown (identical units grouped — click to expand)
| Units | Beds | Baths | Est. rent |
|---|---|---|---|
| 1× unit | 1 | 1 | $967 |
| 1× unit | 2 | 1 | $1,038 |
| Total (2 units) | $2,005 | ||
UW: 25.0% down · 7.5% · 30yr · 1.5% tax · 5.0% vac · 8.0% maint · 8.0% mgmt
Financing live
Cash to close
- Down payment
- $35,000
- Closing costs
- $4,200
- Reserves months
- —
- Total cash needed
- —
Loan-product check · same deal, 3 products live
Conventional
25% down · 7.5% · 30yr
- Down + closing
- —
- Monthly P&I
- —
- Monthly cashflow
- —
- DSCR
- —
- Eligible?
- —
Personal DTI + credit; lowest rate.
DSCR
20% down · 8.5% · 30yr
- Down + closing
- —
- Monthly P&I
- —
- Monthly cashflow
- —
- DSCR
- —
- Eligible?
- —
No personal income docs; deal must DSCR.
Hard money
10% down · 12.0% · 12mo
- Down + closing
- —
- Monthly P&I
- —
- Monthly cashflow
- —
- DSCR
- —
- Eligible?
- —
Short-term bridge; refi at stabilization.
Rent comps 11 comps
| Address | Beds | Baths | Sqft | Rent | $/sqft | DOM | Units | Dist |
|---|---|---|---|---|---|---|---|---|
| 332 Arlington Ave Cincinnati, OH | 3.0 | 2.0 | 1500 | $1,750 | $1.17 | 17d | 1 | 0.35mi |
| 8346 Anthony Wayne Ave Cincinnati, OH | 3.0 | 2.0 | 1716 | $1,750 | $1.02 | 23d | 1 | 0.60mi |
| 1 E Lake Shore Dr Cincinnati, OH | 1.0–3.0 | 1.0–2.0 | 845 | $1,300 | $1.54 | 1d | 54 | 0.63mi |
| 301 W Benson St Unit 6 Cincinnati, OH | 3.0 | 2.0 | 1500 | $1,995 | $1.33 | 44d | 1 | 0.64mi |
| 918 2nd St Cincinnati, OH | 2.0 | 1.0 | 1360 | $1,300 | $0.96 | 23d | 1 | 0.82mi |
| 1617 Pelham Pl Unit 1 Cincinnati, OH | 2.0 | 1.0 | 1100 | $1,450 | $1.32 | 23d | 1 | 0.91mi |
| 7746 Greenland Pl Apt 2 Cincinnati, OH | 2.0 | 1.5 | 1200 | $1,200 | $1.00 | 23d | 1 | 0.91mi |
| 7734 Greenland Pl Unit 3 Cincinnati, OH | 2.0 | 1.5 | 1200 | $1,200 | $1.00 | 23d | 1 | 0.94mi |
| 7734 Greenland Pl Unit 4 Cincinnati, OH | 2.0 | 2.0 | 1200 | $1,150 | $0.96 | 23d | 1 | 0.94mi |
| 617 Van Roberts Pl Cincinnati, OH | 2.0 | 1.0 | 1109 | $1,475 | $1.33 | 7d | 1 | 1.12mi |
| 1635 Section Rd Unit 3 Cincinnati, OH | 2.0 | 1.0 | 1500 | $995 | $0.66 | 23d | 1 | 1.34mi |
Listing history 38 events
-
2026-06-18days on market $140,000 Active 84 DOM
-
2026-06-17days on market $140,000 Active 83 DOM
-
2026-06-16days on market $140,000 Active 82 DOM
-
2026-06-15days on market $140,000 Active 81 DOM
-
2026-06-13days on market $140,000 Active 79 DOM
-
2026-06-09days on market $140,000 Active 75 DOM
-
2026-06-08days on market $140,000 Active 74 DOM
-
2026-06-07days on market $140,000 Active 73 DOM
-
2026-06-05days on market $140,000 Active 70 DOM
-
2026-06-03days on market $140,000 Active 69 DOM
-
2026-06-02days on market $140,000 Active 68 DOM
-
2026-06-01days on market $140,000 Active 67 DOM
-
2026-05-31days on market $140,000 Active 66 DOM
-
2026-04-07price $140,000 485-char remark
Show marketing remark (485 chars)
Calling all investors and house hackers, this duplex is begging to be a part of your portfolio. Both units feature separate utilities and individual washer and dryer hookups, with a shared water heater. Each unit offers spacious rooms and access to a full basement. Unit 1 is a 1-bedroom, 1-bath unit, while Unit 2 is a 2-bedroom, 1-bath unit with an enclosed porch, perfect for added living space or rental appeal. The property also includes a 3-car garage and a large fenced-in yard.
-
2026-03-23$150,000 Active 485-char remark
Show marketing remark (485 chars)
Calling all investors and house hackers, this duplex is begging to be a part of your portfolio. Both units feature separate utilities and individual washer and dryer hookups, with a shared water heater. Each unit offers spacious rooms and access to a full basement. Unit 1 is a 1-bedroom, 1-bath unit, while Unit 2 is a 2-bedroom, 1-bath unit with an enclosed porch, perfect for added living space or rental appeal. The property also includes a 3-car garage and a large fenced-in yard.
-
2025-10-24historical 355-char remark
Show marketing remark (355 chars)
Come check out this duplex featuring a 1-bedroom, 1-bath unit currently rented for $775 per month with a lease through June 2026, and a 2-bedroom, 1-bath unit that's owner-occupied! With separate utilities and an oversized garage, this property has everything you need to move in or add to your investment portfolio. Don't miss outcome check it out today!
-
2025-05-08$189,900 Active 355-char remark
Show marketing remark (355 chars)
Come check out this duplex featuring a 1-bedroom, 1-bath unit currently rented for $775 per month with a lease through June 2026, and a 2-bedroom, 1-bath unit that's owner-occupied! With separate utilities and an oversized garage, this property has everything you need to move in or add to your investment portfolio. Don't miss outcome check it out today!
-
2022-03-02soldstatus $178,000
-
2022-03-02soldstatus $178,000
-
2022-02-18soldstatus $178,000 Sold
-
2022-01-26historical Contingency Pending
-
2022-01-21$165,000 Active
-
2021-12-13historical
-
2021-11-27historical Contingency Pending
-
2021-11-19$160,000 Active
-
2016-12-05historical
-
2016-09-26price $69,900
-
2016-07-20$79,900 Active
-
2016-07-20historical
-
2016-07-07price $79,900
-
2016-06-03$89,900 Active
-
2016-06-03historical
-
2016-05-18price $89,900
-
2016-05-10$109,900 Active
-
2011-07-21historical
-
2011-02-01$85,900
-
1999-03-19soldstatus $73,000
-
1997-08-13soldstatus $59,900
ⓘ Source: listings_history table (triggers on properties + properties_extension) + one-shot
backfill from property_details.listing_events for pre-trigger history.
Tax reassessment forecast OH · Partial reset (capped growth)
- Current annual tax
- $3,750 · $313/mo
- Projected year-2 tax
- $3,750 · $313/mo
- Expected delta
- $0/yr ($0/mo · 0.0%)
ⓘ Screening estimate from a state-policy table — verify with the county assessor before closing.
Climate risk First Street
- Flood 9/10 Extreme FEMA zone X (unshaded) · 99% chance over 30 yrs
- Wildfire 1/10 Low
- Heat 5/10 Major 7 d/yr ≥103°F today · 19 d/yr by 30 yrs out
- Wind 2/10 Low 100% chance of damaging wind over 30 yrs
- Air quality 3/10 Moderate 2 unhealthy d/yr today · 3 by 30 yrs out
Nearby sold comps map
Loading sold comps map…
Walkable amenities ~0.75 mi
Loading nearby amenities…
Taxation est. · year 1
- Rental income
- $24,060
- − Mortgage interest
- −$7,842
- − Property taxes
- −$3,750
- − Insurance
- −$1,366
- − Repairs & maintenance
- −$1,925
- − Management
- −$1,925
- − Depreciation
- −$4,073
- Taxable income
- $3,179
- Est. tax owed @ 24.0%
- −$763
- After-tax cash flow
- $4,318/yr
For passive investors: Depreciation is non-cash, so a rental often shows a tax loss while cash-flowing — sheltering income. Rental losses are passive: they offset passive income freely, and up to $25,000/yr can offset ordinary (W-2) income if you actively participate and your MAGI is under $100k (phasing out to $0 by $150k); unused losses carry forward. On sale, claimed depreciation is recaptured at up to 25%, and gains may owe capital-gains tax (a 1031 exchange can defer both). Figures are a year-1 estimate at your 24.0% rate — not tax advice; consult a CPA.
Schools (NCES district)
- District
- Lockland Local
- NCES district ID
- 3904423
- Math proficiency
- 16% ▼ -4.00%
- Reading proficiency
- 23% ▼ -7.00%
- Median HH income
- $33,458
- Composite
- 15.89/100
- National rank
- #9256
- State rank
- #632 of 656 in OH
Livability — Arlington Heights
- Score
- 73/100
- State rank
- #334
- US rank
- #5481
Category grades
Schools grade is shown separately in the Schools card above.
Census & demographics
- Census place
- Arlington Heights, OH
- County
- Hamilton County · 701,295 people
- Metro
- Cincinnati, OH-KY-IN
- Population (ZIP)
- 30,586
- Household income
- $69,372
- Rent vs Own
- Severe rent burden
- 1529.0
Population outlook (Hamilton County) Hauer SSP2
- Today (2025)
- 826,054 people
- By 2030
- 830,947 · +0.6%
- By 2040
- 832,319 · +0.8%
- By 2050
- 822,428 · -0.4%
- By 2075
- 788,688 · -4.5%
- By 2100
- 710,674 · -14.0%
Race, ethnicity, and origin ACS 2023
- Neighborhood character
- Majority White (63%)
- Race & ethnicity
- White 63% Black 26% Two or more races 6% Hispanic / Latino 3% Asian 2%
- Common ancestry
- Italian 3% Slovak 2% Lithuanian 1%
- Foreign-born
- 4% · Canada
- Languages at home
- 95% English-only · Spanish 2% Other Indo-European 1% French/Haitian/Cajun 1%
Political lean MEDSL · Hamilton
- 2024 margin
- D (+14.9) · D 57.0% · R 42.1%
- 2008→2024 swing
- +7.9pp toward D · 2008: 7.0pp · 2024: 14.9pp
- All cycles
- 2024: D+14.9 2020: D+15.9 2016: D+9.5 2012: D+4.9 2008: D+7.0
Not yet ingested
- Civics
- —
Market trends
- HPI YoY
- ▼ -263.50%
- Current HPI
- 217.3319
- Rent YoY
- ▲ 8.02%
- Metro
- Cincinnati, OH-KY-IN
- State GDP YoY
- ▲ 1.98%
- F500 in state
- 48
Industry mix (Fortune 500 HQ in OH)
| Industry | F500 HQs | Revenue |
|---|---|---|
| Insurance | 3 | $145B |
|
||
| Industrial Machinery | 3 | $49B |
|
||
| Financial Services | 3 | $24B |
|
||
| Consumer Goods | 2 | $93B |
|
||
| Aerospace / Defense | 2 | $47B |
|
||
| Utilities | 2 | $33B |
|
||
Price history
+133.7% since first listed25 events — show timeline
- 2026-04-07 Price Changed $140,000 Cincy MLS
- 2026-03-23 Listed $150,000 Cincy MLS
- 2025-10-24 Listing Removed — Cincy MLS
- 2025-05-08 Listed $189,900 Cincy MLS
- 2022-03-02 Sold (Public Records) $178,000 Public Records
- 2022-03-02 Sold (Public Records) $178,000 Public Records
- 2022-02-18 Sold (MLS) $178,000 Cincy MLS
- 2022-01-26 Contingent — Cincy MLS
- 2022-01-21 Listed $165,000 Cincy MLS
- 2021-12-13 Listing Removed — Cincy MLS
- 2021-11-27 Contingent — Cincy MLS
- 2021-11-19 Listed $160,000 Cincy MLS
- 2016-12-05 Listing Removed — Cincy MLS
- 2016-09-26 Price Changed $69,900 Cincy MLS
- 2016-07-20 Listed $79,900 Cincy MLS
- 2016-07-20 Listing Removed — Cincy MLS
- 2016-07-07 Price Changed $79,900 Cincy MLS
- 2016-06-03 Listed $89,900 Cincy MLS
- 2016-06-03 Listing Removed — Cincy MLS
- 2016-05-18 Price Changed $89,900 Cincy MLS
- 2016-05-10 Listed $109,900 Cincy MLS
- 2011-07-21 Listing Removed — Cincy MLS
- 2011-02-01 Listed $85,900 Cincy MLS
- 1999-03-19 Sold (Public Records) $73,000 Public Records
- 1997-08-13 Sold (Public Records) $59,900 Public Records
Property tax history
+9.3%/yrLatest (2025): $3,750 · -0.5% YoY. Source: county tax records.
Cash-flow waterfall
monthlySold comps — $/sqft
last 12 mo · ≤1 miLoading sold comps…