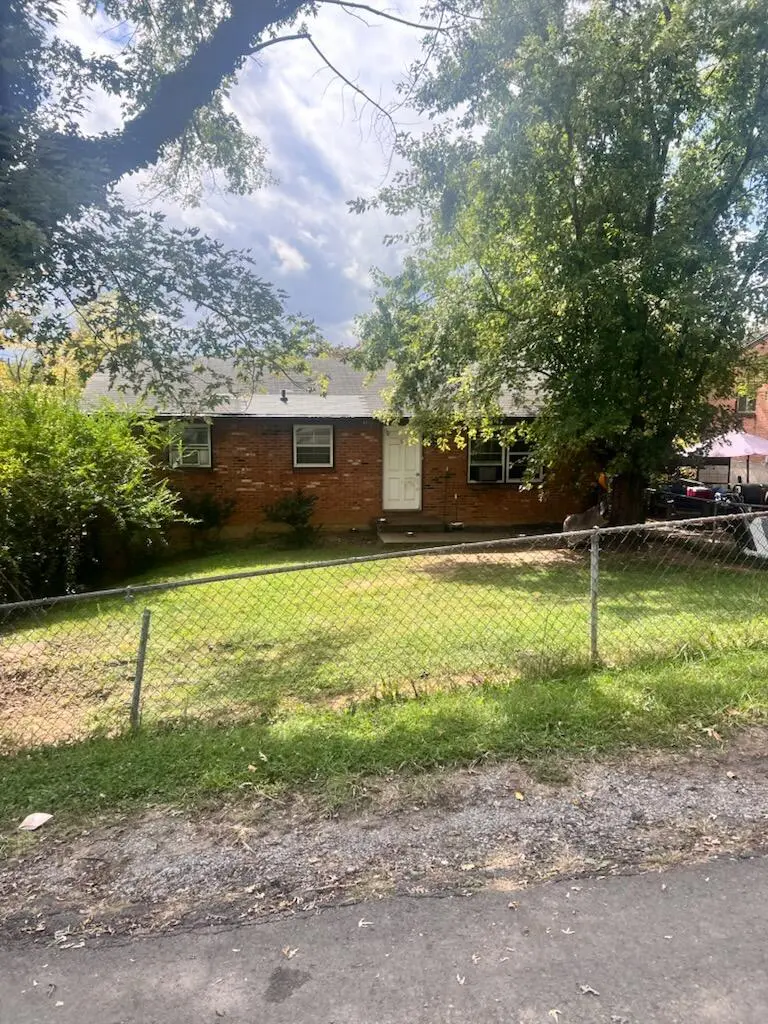
4010 Michigan Ave NW · Roanoke, VA
Flood risk 1/10 · Minimal
- FEMA flood zone
- X (unshaded)
- Chance of flooding over 30 yrs
- 0.0%
- Est. flood insurance / yr
- $473 – $860
Fire risk 1/10 · Minimal
- Est. fire insurance / yr
- $666 – $1,236
Heat risk 5/10 · Moderate
- Hot days now (above 101°F)
- 7 days/yr
- Hot days in 30 yrs
- 18 days/yr
Wind risk 2/10 · Minimal
- Chance of severe wind over 30 yrs
- 1.0%
Air-quality risk 1/10 · Minimal
- Unhealthy air days now
- 0 days/yr
- Unhealthy air days in 30 yrs
- 0 days/yr
Risk factors via First Street. Map © Google.
Why this score? — see what drove the D- grade
The composite is a weighted blend of 9 inputs, each scored 0–100. Each bar is that input's sub-score; the figure is the points it added to the 100-point composite (weight × sub-score).
- ARV discount +8.8/15.0
- Cash flow +7.4/30.0
- Appreciation +5.0/10.0
- Schools +4.1/10.0
- Livability +3.7/5.0
- Rent growth +2.5/5.0
- Condition / age +2.5/5.0
- 1% rule +1.8/10.0
- DSCR +1.6/10.0
$190,159
🖨 Deal sheet 📄 Offer letter ✓ Due diligence
Listing remarks MLS
Vacant.
Key facts
- 7,405 sq ft lot
- Built 1971
- Listed 246 days
Neighborhood map
What this means for you Summary
Snapshot
- This is a 3-bed/1.0-bath single-family listed at $190k.
Deal economics
- At list price, monthly cash flow is $-242 ($-3k/yr) — negative.
- To cash-flow at today's rent, offer at most $147k (22.5% below list).
- To meet the 1% rule (rent ≥ 1% of price), the offer needs to be $128k (32.4% below list).
- Recommended offer: $128k (32.4% below list) — sets the bar for 1% rule.
Location & tenants
- Location reads 73/100 on livability (#163 in VA) — a middle-class / working-renter tenant base. Strengths: cost of living A+, health & safety A+, housing A; Watch: amenities C-, employment D, crime F.
- Roanoke City Public School District (urban): math 40% / reading 58% proficiency, ranked #102 of 131 in VA (top 78%) — families likely to look elsewhere, expect single-tenant / working-renter base with shorter leases; 67% free/reduced lunch — lower-income household profile, screen leases tightly.
- Market conditions: 12 active listings in the ZIP; 12 comparable units currently listed for rent nearby; rentals leasing fast (median 14d on market — plan ~1-2 weeks tenant-placement turnaround); 113 units permitted in Roanoke city in 2024 (0 in 5+ unit buildings).
Forward outlook
- In year one you build about $7k of equity ($1k loan paydown + $6k appreciation (3.0% local appreciation)).
- Roanoke County population projected at +11% by 2050 — modest demand growth; plan on rents tracking national, not racing it.
- By year 5, paydown + projected appreciation supports a ~$30k cash-out refi (75% LTV) — recoverable capital for the next deal without selling this one.
Negotiation context
- It's been on market 246 days — a 12% lower offer ($167k) is reasonable based on typical stale-listing flexibility.
Risks & watch-outs
- Climate carrying-cost: extreme-heat days projected 7→18/yr by 2055 (HVAC capex compounding) — expect insurance premiums to compound above CPI over the hold.
Questions for the listing agent
- What do current leases actually rent for vs. the listed asking? Can we see a recent rent roll and the last 12 months of T-12 income?
- It's been on market 246 days. Have you received any prior offers? Is the seller open to a 32% concession, seller financing, or rate buy-down credit?
- Built in 1971 — when were the roof, HVAC, electrical panel, plumbing, and water heater last replaced?
- Why hasn't it sold? Are there any deal-killer items the seller is aware of (foundation, flood, title, zoning, code violations)?
- Is there a deadline driving the sale (1031 exchange, divorce, estate, relocation)? That informs how much negotiation room exists.
- Schools are A-rated — typically a magnet for longer-tenancy family renters. What's the average tenant stay here, and is there a school-zone premium baked into asking?
- Crime grade is F in this area — have there been break-ins, vandalism, or insurance claims at this property in the last 3 years? What carrier currently insures it and at what premium?
- The area grade is low — what's the realistic commute time and amenity access for the typical tenant pool here? Any planned neighborhood developments (good or bad) we should know about?
- What's the average days-on-market for RENTAL listings here right now (not sales)? A rising rental-DOM trend means longer vacancies and softer asking-rent achievability than the comps imply.
- What's the recent tenant-quality profile in this submarket — average credit score on applications, eviction rate, late-payment / NSF rate, and stable-employment percentage? A property-management company in the area should have these aggregated.
- How much new for-sale + rental construction is in the pipeline within 1–3 miles? Heavy new supply typically softens prices + rents 12–24 months out; constrained supply supports both.
Investment metrics
- 1% rule
- 0.68% ✗
- Cap rate
- 4.77%
- Cash-on-cash
- -5.45%
- DSCR
- 0.76
- GRM
- 12.3
CMA / ARV
- ARV (median comp)
- $195,987
- List price
- $190,159
- Delta
- -2.97%
- Verdict
- FAIR
- Comps
- 20 within 1.0 mi
Show comp detail 12 sales within ~0.75 mi
| Address | Dist | Beds/Ba | Sqft | Sold | Price | $/sf | Match |
|---|---|---|---|---|---|---|---|
| 4446 Stonewall Rd NW | 0.25mi | 3/2.0 | 1,188 (+3%) | 5mo | $266,950 | $225 | 75 |
| 3708 Michigan Ave NW | 0.29mi | 3/2.0 | 1,200 (+4%) | 1mo | $247,000 | $206 | 75 |
| 4026 Wyoming Ave NW | 0.52mi | 3/1.0 | 1,195 (+4%) | 1mo | $165,000 | $138 | 69 |
| 3828 Michigan Ave NW | 0.17mi | 4/1.0 (+1) | 1,255 (+9%) | 5mo | $140,000 | $112 | 68 |
| 3809 Woodleigh Rd NW | 0.26mi | 3/1.0 | 1,000 (-13%) | 3mo | $95,000 | $95 | 64 |
| 4117 Kentucky Ave NW | 0.50mi | 3/1.0 | 1,242 (+8%) | 1mo | $187,000 | $151 | 63 |
| 919 Glenn Ridge Rd NW | 0.34mi | 3/1.0 | 1,000 (-13%) | 2mo | $130,000 | $130 | 60 |
| 3651 Troutland Ave NW | 0.67mi | 3/1.0 | 1,229 (+7%) | 2mo | $180,000 | $146 | 56 |
| 4251 Hershberger Rd NW | 0.70mi | 2/1.0 (-1) | 1,172 (+2%) | 6mo | $185,000 | $158 | 55 |
| 4305 Camille Ave NW | 0.47mi | 3/2.0 | 1,285 (+12%) | 4mo | $259,950 | $202 | 52 |
| 3702 Troutland Ave NW | 0.70mi | 3/1.0 | 1,260 (+10%) | 2mo | $140,000 | $111 | 50 |
| 3768 Wilmont Ave NW | 0.75mi | 3/1.0 | 1,008 (-12%) | 2mo | $142,000 | $141 | 43 |
Match score weights: distance 35% · size 25% · config 20% · recency 20%. Top-matched comps best support the ARV.
Projected returns pro-forma
3.0% appreciation · 3.0% rent growth · sell at horizon
- IRR
- 2.4%
- Equity multiple
- 1.14×
- Total profit
- $7,480
- Equity at exit
- $85,504
- IRR
- 5.9%
- Equity multiple
- 1.91×
- Total profit
- $48,235
- Equity at exit
- $131,771
Cash invested: $53,245 (down + closing). Projections, not guarantees.
Landlord ↔ Tenant lean methodology
- Overall (STATE)
- 55 Moderately Landlord-Leaning
- State Virginia
- 55 Moderately Landlord-Leaning · D+2
- County
- — inherits STATE
- City
- — inherits STATE
ZIP-level market 24011
- Active inventory
- 12
- Price-to-rent
- 12.3×
Monthly cashflow live
- Estimated rent
- $1,285 high interval (Pro) →
- Mortgage (P&I)
- −$997
- Tax from tax record
- −$181 /mo · $2,166/yr
- Insurance
- −$79
- HOA
- −$0
- Vacancy / Maint / Mgmt
- −$270
- Net cashflow
- $-242
Break-even live
UW: 25.0% down · 7.5% · 30yr · 1.5% tax · 5.0% vac · 8.0% maint · 8.0% mgmt
Financing live
Cash to close
- Down payment
- $47,540
- Closing costs
- $5,705
- Reserves months
- —
- Total cash needed
- —
Loan-product check · same deal, 3 products live
Conventional
25% down · 7.5% · 30yr
- Down + closing
- —
- Monthly P&I
- —
- Monthly cashflow
- —
- DSCR
- —
- Eligible?
- —
Personal DTI + credit; lowest rate.
DSCR
20% down · 8.5% · 30yr
- Down + closing
- —
- Monthly P&I
- —
- Monthly cashflow
- —
- DSCR
- —
- Eligible?
- —
No personal income docs; deal must DSCR.
Hard money
10% down · 12.0% · 12mo
- Down + closing
- —
- Monthly P&I
- —
- Monthly cashflow
- —
- DSCR
- —
- Eligible?
- —
Short-term bridge; refi at stabilization.
Rent comps 12 comps
| Address | Beds | Baths | Sqft | Rent | $/sqft | DOM | Units | Dist |
|---|---|---|---|---|---|---|---|---|
| 3802 Panorama Ave NW #2 Roanoke, VA | 2.0 | 1.0 | 900 | $995 | $1.11 | 43d | 1 | 0.37mi |
| 3802 Panorama Ave NW #12 Roanoke, VA | 3.0 | 1.0 | 1100 | $995 | $0.90 | 43d | 1 | 0.37mi |
| 3802 Panorama Ave NW #6 Roanoke, VA | 2.0 | 1.0 | 900 | $1,050 | $1.17 | 43d | 1 | 0.37mi |
| 4310 Tyree Rd NW Roanoke, VA | 3.0 | 1.0 | 913 | $1,650 | $1.81 | 13d | 1 | 0.40mi |
| 4626 Autumn Ln NW Roanoke, VA | 3.0 | 2.5 | 1408 | $1,999 | $1.42 | 13d | 1 | 0.85mi |
| 3340 Hershberger Rd NW Roanoke, VA | 2.0 | 1.0 | 924 | $1,050 | $1.14 | 43d | 1 | 1.17mi |
| 2744 Melrose Ave NW Roanoke, VA | 1.0–2.0 | 1.0–1.5 | 936 | $1,045 | $1.12 | 13d | 7 | 1.25mi |
| 733 29th St NW Roanoke, VA | 2.0–3.0 | 2.0 | 1022 | $1,625 | $1.59 | 13d | 4 | 1.25mi |
| 3533 Ferncliff Ave NW Roanoke, VA | 1.0–3.0 | 1.0 | 980 | $1,426 | $1.46 | 13d | 11 | 1.33mi |
| 1741 Pexton Ave Salem, VA | 3.0 | 1.0 | 792 | $1,452 | $1.83 | 13d | 1 | 1.34mi |
| 1331 Dudley St NW Roanoke, VA | 2.0 | 1.0 | 700 | $1,500 | $2.14 | 13d | 1 | 1.42mi |
| 900 Camelot Dr Salem, VA | 1.0–3.0 | 1.0–1.5 | 905 | $1,760 | $1.94 | 13d | 10 | 1.43mi |
Listing history 21 events
-
2026-06-18days on market $190,159 Active 246 DOM
-
2026-06-17days on market $190,159 Active 245 DOM
-
2026-06-16days on market $190,159 Active 244 DOM
-
2026-06-15days on market $190,159 Active 243 DOM
-
2026-06-14days on market $190,159 Active 241 DOM
-
2026-06-13days on market $190,159 Active 240 DOM
-
2026-06-10days on market $190,159 Active 238 DOM
-
2026-06-09days on market $190,159 Active 237 DOM
-
2026-06-08days on market $190,159 Active 236 DOM
-
2026-06-05days on market $190,159 Active 232 DOM
-
2026-06-03days on market $190,159 Active 231 DOM
-
2026-06-02days on market $190,159 Active 230 DOM
-
2026-06-01days on market $190,159 Active 229 DOM
-
2026-05-31days on market $190,159 Active 228 DOM
-
2026-05-30days on market $190,159 Active 227 DOM
-
2026-02-05price $190,159 7-char remark
Show marketing remark (7 chars)
Vacant.
-
2026-01-05price $194,040 7-char remark
Show marketing remark (7 chars)
Vacant.
-
2025-10-15$198,000 Active 7-char remark
Show marketing remark (7 chars)
Vacant.
-
2020-11-23soldstatus $3,113,580
-
2019-03-18soldstatus $48,000
-
1971-09-24soldstatus $17,300
ⓘ Source: listings_history table (triggers on properties + properties_extension) + one-shot
backfill from property_details.listing_events for pre-trigger history.
Tax reassessment forecast VA · Resets to sale price
- Current annual tax
- $2,166 · $181/mo
- Projected year-2 tax
- $2,166 · $181/mo
- Expected delta
- $0/yr ($0/mo · 0.0%)
ⓘ Screening estimate from a state-policy table — verify with the county assessor before closing.
Climate risk First Street
- Flood 1/10 Low FEMA zone X (unshaded) · 0% chance over 30 yrs
- Wildfire 1/10 Low
- Heat 5/10 Major 7 d/yr ≥101°F today · 18 d/yr by 30 yrs out
- Wind 2/10 Low 100% chance of damaging wind over 30 yrs
- Air quality 1/10 Low 0 unhealthy d/yr today · 0 by 30 yrs out
Nearby sold comps map
Loading sold comps map…
Walkable amenities ~0.75 mi
Loading nearby amenities…
Taxation est. · year 1
- Rental income
- $15,417
- − Mortgage interest
- −$10,652
- − Property taxes
- −$2,166
- − Insurance
- −$951
- − Repairs & maintenance
- −$1,233
- − Management
- −$1,233
- − Depreciation
- −$5,532
- Taxable loss
- −$6,350
- Est. tax savings @ 24.0%
- +$1,524
- After-tax cash flow
- $-1,380/yr
For passive investors: Depreciation is non-cash, so a rental often shows a tax loss while cash-flowing — sheltering income. Rental losses are passive: they offset passive income freely, and up to $25,000/yr can offset ordinary (W-2) income if you actively participate and your MAGI is under $100k (phasing out to $0 by $150k); unused losses carry forward. On sale, claimed depreciation is recaptured at up to 25%, and gains may owe capital-gains tax (a 1031 exchange can defer both). Figures are a year-1 estimate at your 24.0% rate — not tax advice; consult a CPA.
Schools (NCES district)
- District
- Roanoke City Public School District
- NCES district ID
- 5103300
- Math proficiency
- 40% ▼ -38.00%
- Reading proficiency
- 58% ▼ -12.00%
- Median HH income
- $38,592
- Composite
- 40.8/100
- National rank
- #3639
- State rank
- #102 of 131 in VA
Livability — Roanoke
- Score
- 73/100
- State rank
- #163
- US rank
- #5055
Category grades
Schools grade is shown separately in the Schools card above.
Census & demographics
- Census place
- Roanoke, VA
- City population
- 168,930
- Population (ZIP)
- 789
Population outlook (Roanoke County) Hauer SSP2
- Today (2025)
- 106,094 people
- By 2030
- 108,927 · +2.7%
- By 2040
- 114,104 · +7.5%
- By 2050
- 118,032 · +11.3%
- By 2075
- 123,363 · +16.3%
- By 2100
- 116,827 · +10.1%
Race, ethnicity, and origin ACS 2023
- Neighborhood character
- Predominantly White (73%)
- Race & ethnicity
- White 73% Black 14% Two or more races 10% Hispanic / Latino 6% Asian 2%
- Hispanic origin (detail)
- Mexican 2% Puerto Rican 3%
- Common ancestry
- Romanian 5% Serbian 5% Iranian 2%
- Foreign-born
- 7% · China, South Korea
- Languages at home
- 91% English-only · Spanish 4% Russian/Polish/Slavic 2% Other Indo-European 2%
Political lean MEDSL · Roanoke
- 2024 margin
- Strong D (+23.6) · D 61.1% · R 37.5% · Other 1.4%
- 2008→2024 swing
- +0.2pp no change · 2008: 23.4pp · 2024: 23.6pp
- All cycles
- 2024: D+23.6 2020: D+25.8 2016: D+17.6 2012: D+21.5 2008: D+23.4
Not yet ingested
- Civics
- —
Market trends
- HPI YoY
- —
- Current HPI
- —
- Rent YoY
- —
- Metro
- —
- State GDP YoY
- ▲ 2.40%
- F500 in state
- 50
Industry mix (Fortune 500 HQ in VA)
| Industry | F500 HQs | Revenue |
|---|---|---|
| Aerospace / Defense | 4 | $236B |
|
||
| Technology / Defense | 3 | $32B |
|
||
| Financial Services | 2 | $176B |
|
||
| Utilities | 2 | $27B |
|
||
| Insurance | 2 | $25B |
|
||
| Technology | 2 | $15B |
|
||
Price history
+999.2% since first listed6 events — show timeline
- 2026-02-05 Price Changed $190,159 MLSRV
- 2026-01-05 Price Changed $194,040 MLSRV
- 2025-10-15 Listed $198,000 MLSRV
- 2020-11-23 Sold (Public Records) $3,113,580 Public Records
- 2019-03-18 Sold (Public Records) $48,000 Public Records
- 1971-09-24 Sold (Public Records) $17,300 Public Records
Property tax history
+13.1%/yrLatest (2025): $2,166 · +19.8% YoY. Source: county tax records.
Cash-flow waterfall
monthlySold comps — $/sqft
last 12 mo · ≤1 miLoading sold comps…