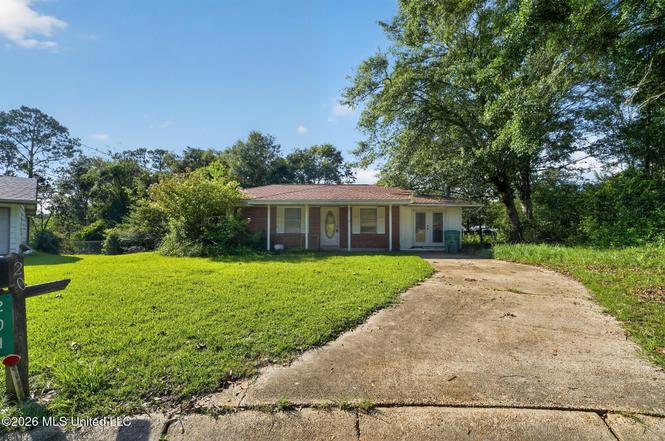
201 Fore Cir · Gulfport, MS
Flood risk 1/10 · Minimal
- FEMA flood zone
- X (unshaded)
- Chance of flooding over 30 yrs
- 0.0%
- Est. flood insurance / yr
- $507 – $1,088
Fire risk 3/10 · Minor
- Est. fire insurance / yr
- $1,241 – $2,305
Heat risk 10/10 · Severe
- Hot days now (above 107°F)
- 7 days/yr
- Hot days in 30 yrs
- 22 days/yr
Wind risk 9/10 · Severe
- Chance of severe wind over 30 yrs
- 99.0%
Air-quality risk 1/10 · Minimal
- Unhealthy air days now
- 0 days/yr
- Unhealthy air days in 30 yrs
- 0 days/yr
Risk factors via First Street. Map © Google.
Why this score? — see what drove the B+ grade
The composite is a weighted blend of 9 inputs, each scored 0–100. Each bar is that input's sub-score; the figure is the points it added to the 100-point composite (weight × sub-score).
- Cash flow +30.0/30.0
- ARV discount +11.7/15.0
- DSCR +10.0/10.0
- 1% rule +9.5/10.0
- Rent growth +4.2/5.0
- Schools +4.2/10.0
- Livability +3.7/5.0
- Condition / age +2.5/5.0
- Appreciation +0.0/10.0
$115,000
🖨 Deal sheet 📄 Offer letter ✓ Due diligence
Listing remarks
Welcome to this charming 3-bedroom, home located in the heart of Gulfport, MS. This property offers a unique opportunity for those looking to invest in a fixer-upper, perfect for first-time homeowners looking to redesign or seasoned renovators. The kitchen is functional but requires some repairs and updates, allowing you to create your dream cooking space. The property includes a sizeable backyard, ideal for entertaining or gardening, with plenty of room for outdoor activities. With some renovations and repairs, you can turn this house into a stunning residence that reflects your style and needs. Whether you're looking to flip the property or make it your forever home, the possibilities are
Key facts
- Sizeable backyard
- 0.33 acre lot
- 2 garage spots
Tags
Property features AI
Exterior
- Parking: Detached 2-car garage
- Utilities: Public water; Public sewer; Electricity available; Natural gas available
- Home design: Single family residence (house); One story
- Construction: Brick construction; Slab foundation; Built (year source: assessor)
- Exterior features: Architectural shingle roof
Interior
- Kitchen: Microwave
- Bathrooms: 2 full bathrooms
- Heating & cooling: Gas cooling; Heating: see remarks
- Interior features: Microwave
Neighborhood map
What this means for you Summary
Snapshot
- This is a 3-bed/1.0-bath single-family listed at $115k.
Deal economics
- At list price, monthly cash flow is $560 ($7k/yr) — positive.
- The deal already cash-flows at list — no discount required.
- Meets the 1% rule at list price ($2k rent vs $115k).
- Cap rate 12.1% vs local median 4.9% in Gulfport — top-decile yield for the area; either an underpriced asset or a hidden risk that comps aren't pricing in. Stress-test before assuming the spread holds.
Location & tenants
- Location reads 73/100 on livability (#15 in MS) — a middle-class / working-renter tenant base. Strengths: cost of living A+, housing A+, health & safety A+; Watch: schools D, amenities F, commute F.
- Harrison County School District (rural): math 52% / reading 46% proficiency, ranked #14 of 130 in MS (top 11%) — families likely to look elsewhere, expect single-tenant / working-renter base with shorter leases; 62% free/reduced lunch — lower-income household profile, screen leases tightly.
- Market conditions: Rents rising fast (+7.0%/yr); 763 active listings in the ZIP; 19 comparable units currently listed for rent nearby; rentals lingering (median 44d on market — plan ~5-8 weeks vacancy on turnover, expect pricing pressure); 53% of comp listings sitting > 30 days — soft ceiling on asking rent; 2,194 units permitted in Harrison County in 2024 (0 in 5+ unit buildings).
- This rent runs 32% of the median local income ($63k/yr) — at the standard rent-burdened threshold; future hikes will face affordability resistance.
Forward outlook
- Local home prices are declining (-3.0%/yr); year-one equity from $795 of loan paydown is wiped out by about $3k of value loss. Plan a longer hold.
- Harrison County population projected at +27% by 2050 — long-run rental-demand tailwind backs the buy-and-hold thesis.
- At projected returns (-3.0% appreciation + 7.0% rent growth), your $32k cash investment doubles in ~5 years — after that, you're playing with house money.
Negotiation context
- Only 3 days on market — expect competitive offers; lowballing is unlikely to land.
Risks & watch-outs
- Climate carrying-cost: severe wind risk, 99% chance of damaging wind over 30y; extreme-heat days projected 7→22/yr by 2055 (HVAC capex compounding) — expect insurance premiums to compound above CPI over the hold.
Questions for the listing agent
- Built in 1969 — when were the roof, HVAC, electrical panel, plumbing, and water heater last replaced?
- Is there a deadline driving the sale (1031 exchange, divorce, estate, relocation)? That informs how much negotiation room exists.
- Schools are D-rated, which usually means shorter tenancies and higher turnover. Who's the typical renter profile here, and what's been the actual vacancy rate?
- What's the average days-on-market for RENTAL listings here right now (not sales)? A rising rental-DOM trend means longer vacancies and softer asking-rent achievability than the comps imply.
- What's the recent tenant-quality profile in this submarket — average credit score on applications, eviction rate, late-payment / NSF rate, and stable-employment percentage? A property-management company in the area should have these aggregated.
- How much new for-sale + rental construction is in the pipeline within 1–3 miles? Heavy new supply typically softens prices + rents 12–24 months out; constrained supply supports both.
Investment metrics
- 1% rule
- 1.45% ✓
- Cap rate
- 12.14%
- Cash-on-cash
- 20.87%
- DSCR
- 1.93
- GRM
- 5.8
CMA / ARV
- ARV (on-the-fly)
- $126,750
- Comps found
- 12
Show comp detail 12 sales within ~0.75 mi
| Address | Dist | Beds/Ba | Sqft | Sold | Price | $/sf | Match |
|---|---|---|---|---|---|---|---|
| 413 N Wilson Blvd | 0.15mi | 3/1.0 | 1,000 (-1%) | 4mo | $125,000 | $125 | 87 |
| 11406 Harris Dr | 0.09mi | 3/1.5 | 1,070 (+6%) | 4mo | $165,000 | $154 | 82 |
| 301 N Wilson Blvd | 0.04mi | 3/1.5 | 1,108 (+9%) | 8mo | $125,000 | $113 | 74 |
| 104 Estes St | 0.17mi | 3/2.0 | 1,109 (+9%) | 6mo | $100,000 | $90 | 67 |
| 103 N Wilson Blvd | 0.09mi | 3/1.5 | 1,080 (+6%) | 20mo | $149,900 | $139 | 66 |
| 119 Gahan Dr | 0.37mi | 3/1.5 | 1,100 (+8%) | 3mo | $145,000 | $132 | 64 |
| 11433 Klein Rd | 0.24mi | 3/1.5 | 1,150 (+13%) | 3mo | $70,000 | $61 | 62 |
| 103 Estes St | 0.16mi | 3/1.5 | 1,107 (+9%) | 17mo | $90,000 | $81 | 61 |
| 103 Phylis Dr | 0.69mi | 3/2.0 | 1,057 (+4%) | 4mo | $99,900 | $95 | 54 |
| 147 James Dr | 0.66mi | 3/1.5 | 1,014 (0%) | 19mo | $142,000 | $140 | 52 |
| 101 Phylis Dr | 0.70mi | 3/1.5 | 1,052 (+4%) | 16mo | $147,000 | $140 | 46 |
| 114 Michael Ct | 0.74mi | 3/1.5 | 1,070 (+6%) | 13mo | $100,000 | $93 | 43 |
Match score weights: distance 35% · size 25% · config 20% · recency 20%. Top-matched comps best support the ARV.
Projected returns pro-forma
-3.0% appreciation · 6.99% rent growth · sell at horizon
- IRR
- 17.6%
- Equity multiple
- 1.74×
- Total profit
- $23,984
- Equity at exit
- $17,147
- IRR
- 28.7%
- Equity multiple
- 4.04×
- Total profit
- $97,762
- Equity at exit
- $9,943
Cash invested: $32,200 (down + closing). Projections, not guarantees.
Landlord ↔ Tenant lean methodology
- Overall (STATE)
- 90 Strongly Landlord-Friendly
- State Mississippi
- 90 Strongly Landlord-Friendly · R+11
- County
- — inherits STATE
- City
- — inherits STATE
ZIP-level market 39503
- Home prices YoY
- -21.5%
- Rents YoY
- 7.0%
- Active inventory
- 763
- Price-to-rent
- 5.8×
Monthly cashflow live
- Estimated rent
- $1,663 high interval (Pro) →
- Mortgage (P&I)
- −$603
- Tax from tax record
- −$103 /mo · $1,233/yr
- Insurance
- −$48
- HOA
- −$0
- Vacancy / Maint / Mgmt
- −$349
- Net cashflow
- $560
Break-even live
UW: 25.0% down · 7.5% · 30yr · 1.5% tax · 5.0% vac · 8.0% maint · 8.0% mgmt
Financing live
Cash to close
- Down payment
- $28,750
- Closing costs
- $3,450
- Reserves months
- —
- Total cash needed
- —
Loan-product check · same deal, 3 products live
Conventional
25% down · 7.5% · 30yr
- Down + closing
- —
- Monthly P&I
- —
- Monthly cashflow
- —
- DSCR
- —
- Eligible?
- —
Personal DTI + credit; lowest rate.
DSCR
20% down · 8.5% · 30yr
- Down + closing
- —
- Monthly P&I
- —
- Monthly cashflow
- —
- DSCR
- —
- Eligible?
- —
No personal income docs; deal must DSCR.
Hard money
10% down · 12.0% · 12mo
- Down + closing
- —
- Monthly P&I
- —
- Monthly cashflow
- —
- DSCR
- —
- Eligible?
- —
Short-term bridge; refi at stabilization.
Rent comps 19 comps
| Address | Beds | Baths | Sqft | Rent | $/sqft | DOM | Units | Dist |
|---|---|---|---|---|---|---|---|---|
| 11502 Camden Court Cir Gulfport, MS | 3.0 | 2.0 | 1495 | $1,775 | $1.19 | 21d | 1 | 0.17mi |
| 101 Fore St Gulfport, MS | 3.0 | 2.0 | 1215 | $1,700 | $1.40 | 13d | 1 | 0.17mi |
| 11413 Camden Court Cir Gulfport, MS | 3.0 | 2.0 | 1495 | $1,775 | $1.19 | 43d | 1 | 0.21mi |
| 11425 Camden Court Cir Gulfport, MS | 3.0 | 2.0 | 1495 | $1,775 | $1.19 | 21d | 1 | 0.21mi |
| 11487 Camden Court Cir Gulfport, MS | 3.0 | 2.0 | 1495 | $1,775 | $1.19 | 43d | 1 | 0.21mi |
| 11405 Camden Court Cir Gulfport, MS | 3.0 | 2.0 | 1495 | $1,775 | $1.19 | 43d | 1 | 0.21mi |
| 11213 Dobson Rd Gulfport, MS | 2.0 | 1.0 | 900 | $1,200 | $1.33 | 43d | 1 | 0.33mi |
| 125 Clarence Dr Gulfport, MS | 3.0 | 2.0 | 1300 | $1,500 | $1.15 | 13d | 1 | 0.57mi |
| 15373 Saint Charles St Gulfport, MS | 3.0 | 1.0–3.0 | 1075 | $1,350 | $1.26 | 43d | 2 | 0.65mi |
| 1009 Michelle Dr Gulfport, MS | 4.0 | 2.0 | 1254 | $1,650 | $1.32 | 43d | 1 | 0.82mi |
| 11200 Three Rivers Rd Gulfport, MS | 3.0 | 2.0 | 1124 | $1,445 | $1.29 | 13d | 1 | 0.91mi |
| 11200 Three Rivers Rd Gulfport, MS | 2.0 | 2.0 | 1042 | $1,147 | $1.10 | 43d | 1 | 0.91mi |
| 14437 Whitney Dr Gulfport, MS | 2.0 | 1.5 | 1200 | $1,200 | $1.00 | 43d | 1 | 0.92mi |
| 10479 Cal Ln Gulfport, MS | 2.0 | 1.5 | 1200 | $950 | $0.79 | 21d | 1 | 0.92mi |
| 10471 Three Rivers Rd Gulfport, MS | 1.0–2.0 | 1.0–2.0 | 778 | $1,050 | $1.35 | 43d | 1 | 0.94mi |
| 15251 Parkwood Dr N Gulfport, MS | 3.0 | 2.5 | 1200 | $1,200 | $1.00 | 43d | 1 | 1.07mi |
| 15235 Oneal Rd Gulfport, MS | 2.0 | 2.0 | 1101 | $1,200 | $1.09 | 13d | 1 | 1.23mi |
| 12040 Highland Ave Gulfport, MS | 3.0 | 2.0 | 1019 | $950 | $0.93 | 13d | 1 | 1.42mi |
| 12237 Vada Dr Gulfport, MS | 3.0 | 1.0 | 1350 | $1,349 | $1.00 | 13d | 1 | 1.45mi |
Listing history 4 events
-
2026-06-18days on market $115,000 Active 3 DOM
-
2026-06-17days on market $115,000 Active 2 DOM
-
2026-06-15remarks 699-char remark
-
2026-06-15$115,000 Active 1 DOM
ⓘ Source: listings_history table (triggers on properties + properties_extension) + one-shot
backfill from property_details.listing_events for pre-trigger history.
Tax reassessment forecast MS · Resets to sale price
- Current annual tax
- $1,233 · $103/mo
- Projected year-2 tax
- $1,233 · $103/mo
- Expected delta
- $0/yr ($0/mo · 0.0%)
ⓘ Screening estimate from a state-policy table — verify with the county assessor before closing.
Climate risk First Street
- Flood 1/10 Low FEMA zone X (unshaded) · 0% chance over 30 yrs
- Wildfire 3/10 Moderate
- Heat 10/10 Extreme 7 d/yr ≥107°F today · 22 d/yr by 30 yrs out
- Wind 9/10 Extreme 99% chance of damaging wind over 30 yrs
- Air quality 1/10 Low 0 unhealthy d/yr today · 0 by 30 yrs out
Nearby sold comps map
Loading sold comps map…
Walkable amenities ~0.75 mi
Loading nearby amenities…
Taxation est. · year 1
- Rental income
- $19,957
- − Mortgage interest
- −$6,442
- − Property taxes
- −$1,233
- − Insurance
- −$575
- − Repairs & maintenance
- −$1,597
- − Management
- −$1,597
- − Depreciation
- −$3,345
- Taxable income
- $5,169
- Est. tax owed @ 24.0%
- −$1,241
- After-tax cash flow
- $5,481/yr
For passive investors: Depreciation is non-cash, so a rental often shows a tax loss while cash-flowing — sheltering income. Rental losses are passive: they offset passive income freely, and up to $25,000/yr can offset ordinary (W-2) income if you actively participate and your MAGI is under $100k (phasing out to $0 by $150k); unused losses carry forward. On sale, claimed depreciation is recaptured at up to 25%, and gains may owe capital-gains tax (a 1031 exchange can defer both). Figures are a year-1 estimate at your 24.0% rate — not tax advice; consult a CPA.
Schools (NCES district)
- District
- Harrison County School District
- NCES district ID
- 2801770
- Math proficiency
- 52% ▼ -4.00%
- Reading proficiency
- 46% ▼ -4.00%
- Median HH income
- $46,504
- Composite
- 41.66/100
- National rank
- #3419
- State rank
- #14 of 130 in MS
Livability — Gulfport
- Score
- 73/100
- State rank
- #15
- US rank
- #5010
Category grades
Schools grade is shown separately in the Schools card above.
Census & demographics
- Census place
- Gulfport, MS
- County
- Harrison County · 178,171 people
- City population
- 96,188
- Metro
- Gulfport-Biloxi, MS
- Population (ZIP)
- 55,059
- Household income
- $62,641
- Rent vs Own
- Severe rent burden
- 1686.0
Population outlook (Harrison County) Hauer SSP2
- Today (2025)
- 228,444 people
- By 2030
- 241,942 · +5.9%
- By 2040
- 267,531 · +17.1%
- By 2050
- 291,062 · +27.4%
- By 2075
- 346,711 · +51.8%
- By 2100
- 378,165 · +65.5%
Race, ethnicity, and origin ACS 2023
- Neighborhood character
- Diverse neighborhood (Simpson 0.58)
- Race & ethnicity
- White 58% Black 27% Two or more races 9% Hispanic / Latino 6% Asian 2%
- Hispanic origin (detail)
- Mexican 2% Puerto Rican 1%
- Common ancestry
- Lithuanian 5% Slovak 1% Portuguese 1%
- Foreign-born
- 3% · Canada
- Languages at home
- 95% English-only · Spanish 3%
Political lean MEDSL · Harrison
- 2024 margin
- Strong R (+28.9) · D 35.0% · R 63.9% · Other 1.1%
- 2008→2024 swing
- -2.9pp toward R · 2008: -26.0pp · 2024: -28.9pp
- All cycles
- 2024: R+28.9 2020: R+25.2 2016: R+30.7 2012: R+26.6 2008: R+26.0
Not yet ingested
- Civics
- —
Market trends
- HPI YoY
- ▼ -51.39%
- Current HPI
- 187.285
- Rent YoY
- ▲ 6.99%
- Metro
- Gulfport-Biloxi, MS
- State GDP YoY
- —
- F500 in state
- 0
Price history
2 events — show timeline
- 2026-06-15 Listed $115,000 MLSU
- 2008-10-01 Sold (Public Records) — Public Records
Property tax history
+3.9%/yrLatest (2025): $1,233 · +3.9% YoY. Source: county tax records.
Cash-flow waterfall
monthlySold comps — $/sqft
last 12 mo · ≤1 miLoading sold comps…