5316 53rd Ave E Unit ZB1 · Samoset, FL
Flood risk 2/10 · Minimal
- FEMA flood zone
- X (unshaded)
- Chance of flooding over 30 yrs
- 0.05%
- Est. flood insurance / yr
- $507 – $1,088
Fire risk 1/10 · Minimal
- Est. fire insurance / yr
- $947 – $1,759
Heat risk 10/10 · Severe
- Hot days now (above 107°F)
- 7 days/yr
- Hot days in 30 yrs
- 29 days/yr
Wind risk 10/10 · Severe
- Chance of severe wind over 30 yrs
- 99.0%
Air-quality risk 2/10 · Minimal
- Unhealthy air days now
- 1 days/yr
- Unhealthy air days in 30 yrs
- 1 days/yr
Risk factors via First Street. Map © Google.
Why this score? — see what drove the C+ grade
The composite is a weighted blend of 9 inputs, each scored 0–100. Each bar is that input's sub-score; the figure is the points it added to the 100-point composite (weight × sub-score).
- Cash flow +24.9/30.0
- ARV discount +9.6/15.0
- 1% rule +8.7/10.0
- DSCR +8.1/10.0
- Schools +4.4/10.0
- Livability +3.2/5.0
- Condition / age +2.5/5.0
- Rent growth +2.3/5.0
- Appreciation +0.0/10.0
$149,750
🖨 Deal sheet 📄 Offer letter ✓ Due diligence
Listing remarks MLS
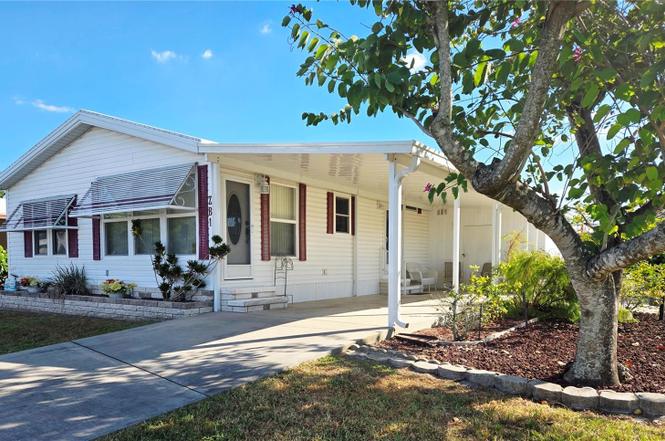
Remarkable and nicely decorated. Front sun room or office. Volume ceiling and open floor plan. Hurricane tinted windows with custom blinds. Custom entry doors. Insulated roof over. Custom kitchen cabinets. All rooms built at factory and assembled on site. This is truly a quality home.
Key facts
- Clubhouse
- Bonus room
- Heated pool
Tags
Property features AI
Finance
- Other: Partially furnished
- Financial info: Total monthly fees $300; Total annual fees $3,600
- HOA & community: Has HOA (Lou Paul) with monthly fee of $300; Association approval required; Association fees include cable TV, internet, pool, sewer, water, trash, management, maintenance of grounds, common area taxes, escrow reserves; Community amenities: clubhouse, pool, shuffleboard court, community mailbox, irrigation (reclaimed water); Community features include deed restrictions, vehicle restrictions, optional additional fees, buyer approval required; Senior community; Pets allowed with restrictions (cats OK, dogs OK, breed restrictions, number limit)
Exterior
- Parking: Carport (1 space)
- Utilities: Public water; Public sewer; Cable connected; Electricity connected; Sewer connected; Water connected; Underground utilities
- Home design: Residential manufactured home; Double wide; Single-story; North-facing; Crawlspace foundation
- Construction: Vinyl siding; Roof over
- Exterior features: Patio; Awnings; Landscaped yard; Paved surfaces
Interior
- Kitchen: Dishwasher; Disposal; Microwave; Range; Range hood; Refrigerator; Eat-in kitchen
- Bedrooms: 2 bedrooms
- Flooring: Carpet; Vinyl
- Bathrooms: 2 full bathrooms
- Heating & cooling: Central heating (electric); Central air conditioning
- Interior features: Ceiling fans; Eat-in kitchen; Thermostat; Window treatments
- Laundry & utility: Washer; Dryer; Electric water heater; Laundry located outside
Neighborhood map
What this means for you Summary
Snapshot
- This is a 2-bed/2.0-bath manufactured listed at $150k.
Deal economics
- At list price, monthly cash flow is $323 ($4k/yr) — positive.
- The deal already cash-flows at list — no discount required.
- Meets the 1% rule at list price ($2k rent vs $150k).
- Recommended offer: $132k (12.0% below list) — sets the bar for market timing.
- Cap rate 8.9% vs local median 4.3% in Samoset — top-decile yield for the area; either an underpriced asset or a hidden risk that comps aren't pricing in. Stress-test before assuming the spread holds.
Location & tenants
- Location reads 65/100 on livability (#645 in FL) — a middle-class / working-renter tenant base. Strengths: cost of living A+, housing A+, health & safety A+; Watch: amenities F, commute F, employment F.
- Manatee (suburban): math 54% / reading 50% proficiency, ranked #26 of 73 in FL (top 36%) — acceptable for families but not a draw, mixed tenant base, ~2y average lease.
- Zoned schools: Tara Elementary School (math 79% / reading 66%, grade A, #281 of 2,144 statewide, top 13%, 559 students, 52% FRL); Braden River High School (math 44% / reading 52%, grade D, #201 of 667 statewide, top 30%, 1,774 students, 45% FRL) — zoned schools at 48% FRL track the district average.
- Market conditions: Rents soft (-1.0%/yr); 384 active listings in the ZIP; 21 comparable units currently listed for rent nearby; rentals at typical pace (median 24d on market — plan ~3-4 weeks tenant-placement turnaround); 7,472 units permitted in Manatee County in 2024 (1,782 in 5+ unit buildings).
- This rent runs 35% of the median local income ($71k/yr) — at the standard rent-burdened threshold; future hikes will face affordability resistance.
Forward outlook
- Local home prices are declining (-3.0%/yr); year-one equity from $1k of loan paydown is wiped out by about $4k of value loss. Plan a longer hold.
- Manatee County population projected at +43% by 2050 — long-run rental-demand tailwind backs the buy-and-hold thesis.
Negotiation context
- It's been on market 209 days — a 12% lower offer ($132k) is reasonable based on typical stale-listing flexibility.
- 2 sale attempts since 6y ago; this cycle's ask has dropped $44k (23%) from the opening price — seller is motivated, your offer sets the floor, not the list.
- Current owner paid $115k; 30% above their basis — modest negotiation headroom, anchor on the comps not their cost.
Risks & watch-outs
- Climate carrying-cost: severe wind risk, 99% chance of damaging wind over 30y; extreme-heat days projected 7→29/yr by 2055 (HVAC capex compounding) — expect insurance premiums to compound above CPI over the hold.
Questions for the listing agent
- It's been on market 209 days. Have you received any prior offers? Is the seller open to a 12% concession, seller financing, or rate buy-down credit?
- What does the HOA fee cover, when was the last increase, and are there any pending special assessments or reserve-fund shortfalls?
- Why hasn't it sold? Are there any deal-killer items the seller is aware of (foundation, flood, title, zoning, code violations)?
- Is there a deadline driving the sale (1031 exchange, divorce, estate, relocation)? That informs how much negotiation room exists.
- Schools are D-rated, which usually means shorter tenancies and higher turnover. Who's the typical renter profile here, and what's been the actual vacancy rate?
- What's the average days-on-market for RENTAL listings here right now (not sales)? A rising rental-DOM trend means longer vacancies and softer asking-rent achievability than the comps imply.
- What's the recent tenant-quality profile in this submarket — average credit score on applications, eviction rate, late-payment / NSF rate, and stable-employment percentage? A property-management company in the area should have these aggregated.
- How much new for-sale + rental construction is in the pipeline within 1–3 miles? Heavy new supply typically softens prices + rents 12–24 months out; constrained supply supports both.
Investment metrics
- 1% rule
- 1.37% ✓
- Cap rate
- 8.88%
- Cash-on-cash
- 9.25%
- DSCR
- 1.41
- GRM
- 6.1
CMA / ARV
- ARV (on-the-fly)
- $157,000
- Comps found
- 12
Show comp detail 12 sales within ~0.75 mi
| Address | Dist | Beds/Ba | Sqft | Sold | Price | $/sf | Match |
|---|---|---|---|---|---|---|---|
| 5316 53rd Ave E Unit Q5 | 0.25mi | 2/2.0 | 960 (-4%) | 4mo | $105,000 | $109 | 78 |
| 5316 53rd Ave E Unit N9 | 0.22mi | 2/2.0 | 1,056 (+6%) | 3mo | $160,000 | $152 | 78 |
| 5316 53rd Ave E Unit K14 | 0.19mi | 2/2.0 | 1,056 (+6%) | 6mo | $140,000 | $133 | 77 |
| 5316 53rd Ave E Unit L1 | 0.23mi | 2/2.0 | 1,056 (+6%) | 5mo | $175,000 | $166 | 76 |
| 5707 45th St E #158 | 0.44mi | 2/2.0 | 1,042 (+4%) | 3mo | $170,000 | $163 | 70 |
| 5316 53rd Ave E Unit F24 | 0.29mi | 2/2.0 | 1,056 (+6%) | 9mo | $60,000 | $57 | 70 |
| 5316 53rd Ave E Unit F38 | 0.23mi | 2/1.5 | 896 (-10%) | 2mo | $100,500 | $112 | 68 |
| 5707 45th St E #35 | 0.44mi | 2/2.0 | 912 (-9%) | 4mo | $160,000 | $175 | 62 |
| 5707 45th St E #136 | 0.44mi | 2/2.0 | 1,100 (+10%) | 6mo | $150,000 | $136 | 58 |
| 5707 45th St E #253 | 0.44mi | 2/2.0 | 1,115 (+12%) | 3mo | $174,900 | $157 | 58 |
| 5316 53rd Ave E Unit Q18 | 0.36mi | 2/2.0 | 864 (-14%) | 5mo | $139,900 | $162 | 56 |
| 5707 45th St E #180 | 0.44mi | 2/2.0 | 1,125 (+12%) | 4mo | $225,000 | $200 | 55 |
Match score weights: distance 35% · size 25% · config 20% · recency 20%. Top-matched comps best support the ARV.
Projected returns pro-forma
-3.0% appreciation · 0.0% rent growth · sell at horizon
- IRR
- -6.3%
- Equity multiple
- 0.77×
- Total profit
- $-9,504
- Equity at exit
- $22,328
- IRR
- -1.8%
- Equity multiple
- 0.90×
- Total profit
- $-4,254
- Equity at exit
- $12,948
Cash invested: $41,930 (down + closing). Projections, not guarantees.
Landlord ↔ Tenant lean methodology
- Overall (STATE)
- 87 Strongly Landlord-Friendly
- State Florida
- 87 Strongly Landlord-Friendly · R+3
- County
- — inherits STATE
- City
- — inherits STATE
ZIP-level market 34203
- Home prices YoY
- -24.5%
- Rents YoY
- -1.0%
- Active inventory
- 384
- Price-to-rent
- 6.1×
Monthly cashflow live
- Estimated rent
- $2,056 high interval (Pro) →
- Mortgage (P&I)
- −$785
- Tax from tax record
- −$153 /mo · $1,837/yr
- Insurance
- −$62
- HOA
- −$300
- Vacancy / Maint / Mgmt
- −$432
- Net cashflow
- $323
Break-even live
UW: 25.0% down · 7.5% · 30yr · 1.5% tax · 5.0% vac · 8.0% maint · 8.0% mgmt
Financing live
Cash to close
- Down payment
- $37,438
- Closing costs
- $4,492
- Reserves months
- —
- Total cash needed
- —
Loan-product check · same deal, 3 products live
Conventional
25% down · 7.5% · 30yr
- Down + closing
- —
- Monthly P&I
- —
- Monthly cashflow
- —
- DSCR
- —
- Eligible?
- —
Personal DTI + credit; lowest rate.
DSCR
20% down · 8.5% · 30yr
- Down + closing
- —
- Monthly P&I
- —
- Monthly cashflow
- —
- DSCR
- —
- Eligible?
- —
No personal income docs; deal must DSCR.
Hard money
10% down · 12.0% · 12mo
- Down + closing
- —
- Monthly P&I
- —
- Monthly cashflow
- —
- DSCR
- —
- Eligible?
- —
Short-term bridge; refi at stabilization.
Rent comps 21 comps
| Address | Beds | Baths | Sqft | Rent | $/sqft | DOM | Units | Dist |
|---|---|---|---|---|---|---|---|---|
| 5616 Gentle Breeze St Bradenton, FL | 2.0 | 2.0 | 1100 | $1,700 | $1.55 | 23d | 1 | 0.08mi |
| 5316 53rd Ave E Unit Q111 Bradenton, FL | 2.0 | 2.0 | 1056 | $1,495 | $1.42 | 10d | 1 | 0.12mi |
| 5650 Simonton St Bradenton, FL | 2.0 | 2.5 | 1496 | $2,095 | $1.40 | 3d | 1 | 0.13mi |
| 5635 Whitehead St Bradenton, FL | 2.0 | 2.5 | 1496 | $2,300 | $1.54 | 23d | 1 | 0.20mi |
| 5707 45th St E #19 Bradenton, FL | 2.0 | 2.0 | 972 | $1,700 | $1.75 | 23d | 1 | 0.43mi |
| 5515 Fair Oaks St Unit 5515 Bradenton, FL | 2.0 | 2.0 | 1004 | $2,000 | $1.99 | 23d | 1 | 0.84mi |
| 5414 Fair Oaks St Unit 10-D Bradenton, FL | 2.0 | 2.0 | 1004 | $1,995 | $1.99 | 3d | 1 | 0.91mi |
| 6503 Fairway Gardens Dr Unit Available Bradenton, FL | 2.0 | 2.0 | 1346 | $2,200 | $1.63 | 23d | 1 | 0.92mi |
| 5016 Misty Canal Pl Bradenton, FL | 2.0 | 2.5 | 1080 | $1,950 | $1.81 | 23d | 1 | 0.95mi |
| 6501 Stone River Rd Bradenton, FL | 2.0 | 2.0 | 1080 | $2,820 | $2.61 | 15d | 2 | 0.97mi |
| 6501 Stone River Rd Unit Available Bradenton, FL | 2.0 | 2.0 | 1118 | $2,200 | $1.97 | 23d | 1 | 0.97mi |
| 4540 Runabout Way Bradenton, FL | 2.0 | 2.5 | 1080 | $2,300 | $2.13 | 23d | 1 | 0.97mi |
| 6505 Stone River Rd Bradenton, FL | 2.0 | 2.0 | 1080 | $2,825 | $2.62 | 15d | 3 | 1.05mi |
| 4815 Woodbrook Dr Sarasota, FL | 2.0 | 2.0 | 1080 | $2,290 | $2.12 | 3d | 1 | 1.16mi |
| 6713 Stone River Rd #202 Bradenton, FL | 2.0 | 2.0 | 1232 | $1,900 | $1.54 | 23d | 1 | 1.23mi |
| 6758 Fairview Ter Bradenton, FL | 2.0 | 2.0 | 1346 | $2,300 | $1.71 | 23d | 1 | 1.24mi |
| 6807 Stone River Rd #202 Bradenton, FL | 2.0 | 2.0 | 1292 | $3,500 | $2.71 | 15d | 1 | 1.26mi |
| 3645 Ali ala LOOP Braden River, FL | 1.0 | 1.0 | 950 | $1,400 | $1.47 | 23d | 1 | 1.28mi |
| 3880 Palm Isle Pl Bradenton, FL | 1.0–2.0 | 1.0–2.0 | 1042 | $2,499 | $2.40 | 1d | 13 | 1.32mi |
| 6870 Fairview Ter #6870 Bradenton, FL | 2.0 | 2.0 | 1346 | $2,200 | $1.63 | 15d | 1 | 1.32mi |
| 6872 Fairview Ter #101 Bradenton, FL | 2.0 | 2.0 | 1352 | $2,000 | $1.48 | 23d | 1 | 1.32mi |
HOA detail
- Monthly dues
- $300 · $3,600/yr
Listing history 24 events
-
2026-06-16statusdays on market $149,750 Pending 209 DOM
-
2026-06-15days on market $149,750 Active 208 DOM
-
2026-06-13days on market $149,750 Active 206 DOM
-
2026-06-13days on market $149,750 Active 205 DOM
-
2026-06-10days on market $149,750 Active 203 DOM
-
2026-06-09days on market $149,750 Active 202 DOM
-
2026-06-08days on market $149,750 Active 201 DOM
-
2026-06-08days on market $149,750 Active 200 DOM
-
2026-06-03days on market $149,750 Active 196 DOM
-
2026-06-02days on market $149,750 Active 195 DOM
-
2026-06-01days on market $149,750 Active 194 DOM
-
2026-05-31days on market $149,750 Active 193 DOM
-
2026-05-08price $149,750
-
2026-04-10price $164,750
-
2026-03-13price $169,750
-
2026-02-14price $178,750
-
2026-01-14price $184,750
-
2025-11-19$193,750 Active
-
2020-08-14soldstatus $115,000 Sold 285-char remark
Show marketing remark (285 chars)
Remarkable and nicely decorated. Front sun room or office. Volume ceiling and open floor plan. Hurricane tinted windows with custom blinds. Custom entry doors. Insulated roof over. Custom kitchen cabinets. All rooms built at factory and assembled on site. This is truly a quality home.
-
2020-08-05status Pending 285-char remark
Show marketing remark (285 chars)
Remarkable and nicely decorated. Front sun room or office. Volume ceiling and open floor plan. Hurricane tinted windows with custom blinds. Custom entry doors. Insulated roof over. Custom kitchen cabinets. All rooms built at factory and assembled on site. This is truly a quality home.
-
2020-06-26price $124,900 285-char remark
Show marketing remark (285 chars)
Remarkable and nicely decorated. Front sun room or office. Volume ceiling and open floor plan. Hurricane tinted windows with custom blinds. Custom entry doors. Insulated roof over. Custom kitchen cabinets. All rooms built at factory and assembled on site. This is truly a quality home.
-
2020-01-28$134,900 Active 285-char remark
Show marketing remark (285 chars)
Remarkable and nicely decorated. Front sun room or office. Volume ceiling and open floor plan. Hurricane tinted windows with custom blinds. Custom entry doors. Insulated roof over. Custom kitchen cabinets. All rooms built at factory and assembled on site. This is truly a quality home.
-
1996-12-03soldstatus $47,100
-
1993-08-12soldstatus $17,800
ⓘ Source: listings_history table (triggers on properties + properties_extension) + one-shot
backfill from property_details.listing_events for pre-trigger history.
Tax reassessment forecast FL · Resets to sale price
- Current annual tax
- $1,837 · $153/mo
- Projected year-2 tax
- $1,837 · $153/mo
- Expected delta
- $0/yr ($0/mo · 0.0%)
ⓘ Screening estimate from a state-policy table — verify with the county assessor before closing.
Climate risk First Street
- Flood 2/10 Low FEMA zone X (unshaded) · 5% chance over 30 yrs
- Wildfire 1/10 Low
- Heat 10/10 Extreme 7 d/yr ≥107°F today · 29 d/yr by 30 yrs out
- Wind 10/10 Extreme 99% chance of damaging wind over 30 yrs
- Air quality 2/10 Low 1 unhealthy d/yr today · 1 by 30 yrs out
Nearby sold comps map
Loading sold comps map…
Walkable amenities ~0.75 mi
Loading nearby amenities…
Taxation est. · year 1
- Rental income
- $24,670
- − Mortgage interest
- −$8,388
- − Property taxes
- −$1,837
- − Insurance
- −$749
- − Repairs & maintenance
- −$1,974
- − Management
- −$1,974
- − HOA
- −$3,600
- − Depreciation
- −$4,356
- Taxable income
- $1,792
- Est. tax owed @ 24.0%
- −$430
- After-tax cash flow
- $3,450/yr
For passive investors: Depreciation is non-cash, so a rental often shows a tax loss while cash-flowing — sheltering income. Rental losses are passive: they offset passive income freely, and up to $25,000/yr can offset ordinary (W-2) income if you actively participate and your MAGI is under $100k (phasing out to $0 by $150k); unused losses carry forward. On sale, claimed depreciation is recaptured at up to 25%, and gains may owe capital-gains tax (a 1031 exchange can defer both). Figures are a year-1 estimate at your 24.0% rate — not tax advice; consult a CPA.
Schools (NCES district)
- District
- Manatee
- NCES district ID
- 1201230
- Math proficiency
- 54% ▼ -6.00%
- Reading proficiency
- 50% ▼ -2.00%
- Median HH income
- $49,607
- Composite
- 44.43/100
- National rank
- #2806
- State rank
- #26 of 73 in FL
Livability — Samoset
- Score
- 65/100
- State rank
- #645
- US rank
- #12763
Category grades
Schools grade is shown separately in the Schools card above.
Census & demographics
- County
- Manatee County · 416,364 people
- Metro
- North Port-Sarasota-Bradenton, FL
- Population (ZIP)
- 40,618
- Household income
- $70,761
- Rent vs Own
- Severe rent burden
- 1469.0
Population outlook (Manatee County) Hauer SSP2
- Today (2025)
- 447,342 people
- By 2030
- 488,911 · +9.3%
- By 2040
- 567,934 · +27.0%
- By 2050
- 637,995 · +42.6%
- By 2075
- 781,970 · +74.8%
- By 2100
- 848,272 · +89.6%
Race, ethnicity, and origin ACS 2023
- Neighborhood character
- Predominantly White (65%)
- Race & ethnicity
- White 65% Hispanic / Latino 19% Two or more races 12% Black 9% Asian 5%
- Hispanic origin (detail)
- Mexican 9% Puerto Rican 3% Cuban 2% Dominican 1%
- Common ancestry
- Lithuanian 3% Romanian 3% Slovak 2%
- Foreign-born
- 17% · Canada, Vietnam, Dominican Republic
- Languages at home
- 76% English-only · Spanish 16% Vietnamese 2% Other Indo-European 1%
Political lean MEDSL · Manatee
- 2024 margin
- Strong R (+23.5) · D 37.9% · R 61.4%
- 2008→2024 swing
- -16.5pp toward R · 2008: -7.0pp · 2024: -23.5pp
- All cycles
- 2024: R+23.5 2020: R+16.1 2016: R+17.1 2012: R+12.5 2008: R+7.0
Not yet ingested
- Civics
- —
Market trends
- HPI YoY
- ▼ -95.87%
- Current HPI
- 295.8871
- Rent YoY
- ▼ -0.97%
- Metro
- North Port-Sarasota-Bradenton, FL
- State GDP YoY
- ▲ 3.28%
- F500 in state
- 36
Industry mix (Fortune 500 HQ in FL)
| Industry | F500 HQs | Revenue |
|---|---|---|
| Industrial Technology | 2 | $29B |
|
||
| Insurance | 2 | $17B |
|
||
| Retail | 1 | $60B |
|
||
| Technology Distribution | 1 | $58B |
|
||
| Homebuilding | 1 | $35B |
|
||
| Technology Manufacturing | 1 | $35B |
|
||
Price history
+741.3% since first listed12 events — show timeline
- 2026-05-08 Price Changed $149,750 Stellar MLS as Distributed by MLS Grid
- 2026-04-10 Price Changed $164,750 Stellar MLS as Distributed by MLS Grid
- 2026-03-13 Price Changed $169,750 Stellar MLS as Distributed by MLS Grid
- 2026-02-14 Price Changed $178,750 Stellar MLS as Distributed by MLS Grid
- 2026-01-14 Price Changed $184,750 Stellar MLS as Distributed by MLS Grid
- 2025-11-19 Listed $193,750 Stellar MLS as Distributed by MLS Grid
- 2020-08-14 Sold (MLS) $115,000 Stellar MLS as Distributed by MLS Grid
- 2020-08-05 Pending — Stellar MLS as Distributed by MLS Grid
- 2020-06-26 Price Changed $124,900 Stellar MLS as Distributed by MLS Grid
- 2020-01-28 Listed $134,900 Stellar MLS as Distributed by MLS Grid
- 1996-12-03 Sold (Public Records) $47,100 Public Records
- 1993-08-12 Sold (Public Records) $17,800 Public Records
Property tax history
+11.8%/yrLatest (2025): $1,837 · -2.7% YoY. Source: county tax records.
Cash-flow waterfall
monthlySold comps — $/sqft
last 12 mo · ≤1 miLoading sold comps…