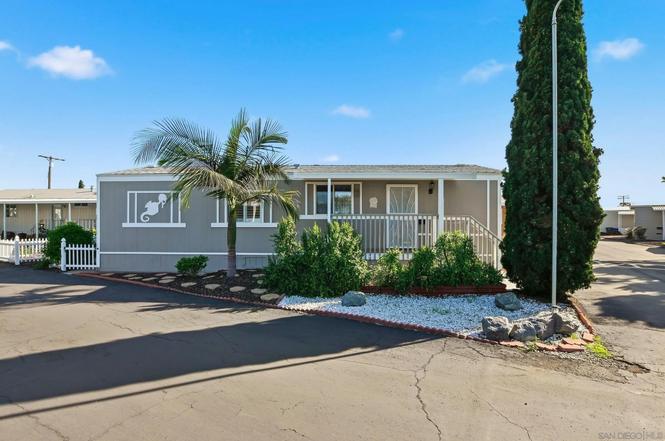
6460 Convoy Ct #46 · San Diego, CA
Flood risk 1/10 · Minimal
- FEMA flood zone
- X (unshaded)
- Chance of flooding over 30 yrs
- 0.0%
- Est. flood insurance / yr
- $507 – $1,088
Fire risk 3/10 · Minor
- Est. fire insurance / yr
- $659 – $1,223
Heat risk 3/10 · Minor
- Hot days now (above 89°F)
- 6 days/yr
- Hot days in 30 yrs
- 18 days/yr
Wind risk 1/10 · Minimal
- Chance of severe wind over 30 yrs
- —
Air-quality risk 3/10 · Minor
- Unhealthy air days now
- 4 days/yr
- Unhealthy air days in 30 yrs
- 4 days/yr
Risk factors via First Street. Map © Google.
Why this score? — see what drove the C+ grade
The composite is a weighted blend of 9 inputs, each scored 0–100. Each bar is that input's sub-score; the figure is the points it added to the 100-point composite (weight × sub-score).
- Cash flow +28.9/30.0
- DSCR +10.0/10.0
- 1% rule +6.7/10.0
- ARV discount +6.7/15.0
- Livability +3.8/5.0
- Rent growth +2.9/5.0
- Condition / age +2.5/5.0
- Schools +2.2/10.0
- Appreciation +0.0/10.0
$239,000
🖨 Deal sheet 📄 Offer letter ✓ Due diligence
Listing remarks MLS
Lovely Manufactured home, 2Bed. 2Ba. Excellent condition and quality. Central heat and air. Great pride of ownership.Located in popular family park, Kearney Lodge. Near shopping, restaurants, bus, freeway 805/52. Minutes to beaches and downtown.
Key facts
- Covered front porch
- Handy storage shed
- Corner lot
Tags
Neighborhood map
What this means for you Summary
Snapshot
- This is a 2-bed/2.0-bath manufactured listed at $239k.
Deal economics
- At list price, monthly cash flow is $810 ($10k/yr) — positive.
- The deal already cash-flows at list — no discount required.
- Meets the 1% rule at list price ($3k rent vs $239k).
- Recommended offer: $225k (6.0% below list) — sets the bar for market timing.
- Cap rate 10.4% vs local median 2.0% in San Diego — top-decile yield for the area; either an underpriced asset or a hidden risk that comps aren't pricing in. Stress-test before assuming the spread holds.
Location & tenants
- Location reads 75/100 on livability (#123 in CA, #4,206 nationally) — a middle-class / working-renter tenant base. Strengths: amenities A+, commute A+, employment A+; Watch: health & safety C-, crime D+, cost of living F.
- San Diego Unified (urban): math 19% / reading 29% proficiency, ranked #393 of 517 in CA (top 76%) — low school quality limits family demand, transient renter base, plan for 1-2y turnover.
- Market conditions: Rents rising (+1.4%/yr); 126 active listings in the ZIP; 24 comparable units currently listed for rent nearby; rentals at typical pace (median 15d on market — plan ~3-4 weeks tenant-placement turnaround); solid renter incomes; 11,759 units permitted in San Diego County in 2024 (7,244 in 5+ unit buildings).
- This rent runs 32% of the median local income ($104k/yr) — at the standard rent-burdened threshold; future hikes will face affordability resistance.
Forward outlook
- Local home prices are declining (-3.0%/yr); year-one equity from $2k of loan paydown is wiped out by about $7k of value loss. Plan a longer hold.
- San Diego County population projected at +20% by 2050 — long-run rental-demand tailwind backs the buy-and-hold thesis.
- At projected returns (-3.0% appreciation + 1.4% rent growth), your $67k cash investment doubles in ~10 years — after that, you're playing with house money.
Negotiation context
- It's been on market 67 days — a 6% lower offer ($225k) is reasonable based on typical stale-listing flexibility.
- 4 sale attempts since 13y ago with the ask held roughly flat each time — persistent listings suggest the price (not the market) is what's stuck; bring a comps-based counter.
- Current owner paid $75k; list at $239k implies a 219% gain — meaningful room to come down on a strong offer.
Questions for the listing agent
- It's been on market 67 days. Have you received any prior offers? Is the seller open to a 6% concession, seller financing, or rate buy-down credit?
- Why hasn't it sold? Are there any deal-killer items the seller is aware of (foundation, flood, title, zoning, code violations)?
- Is there a deadline driving the sale (1031 exchange, divorce, estate, relocation)? That informs how much negotiation room exists.
- Schools are B-rated — typically a magnet for longer-tenancy family renters. What's the average tenant stay here, and is there a school-zone premium baked into asking?
- Crime grade is D in this area — have there been break-ins, vandalism, or insurance claims at this property in the last 3 years? What carrier currently insures it and at what premium?
- What's the average days-on-market for RENTAL listings here right now (not sales)? A rising rental-DOM trend means longer vacancies and softer asking-rent achievability than the comps imply.
- What's the recent tenant-quality profile in this submarket — average credit score on applications, eviction rate, late-payment / NSF rate, and stable-employment percentage? A property-management company in the area should have these aggregated.
- How much new for-sale + rental construction is in the pipeline within 1–3 miles? Heavy new supply typically softens prices + rents 12–24 months out; constrained supply supports both.
Investment metrics
- 1% rule
- 1.17% ✓
- Cap rate
- 10.36%
- Cash-on-cash
- 14.53%
- DSCR
- 1.65
- GRM
- 7.1
CMA / ARV
- ARV (on-the-fly)
- $234,960
- Comps found
- 1
Show comp detail 1 sale within ~0.75 mi
| Address | Dist | Beds/Ba | Sqft | Sold | Price | $/sf | Match |
|---|---|---|---|---|---|---|---|
| 6460 Convoy Ct #46 | 0.00mi | 2/2.0 | 880 (0%) | 1mo | $235,000 | $267 | 100 |
Match score weights: distance 35% · size 25% · config 20% · recency 20%. Top-matched comps best support the ARV.
Projected returns pro-forma
-3.0% appreciation · 1.42% rent growth · sell at horizon
- IRR
- 3.3%
- Equity multiple
- 1.13×
- Total profit
- $8,376
- Equity at exit
- $35,636
- IRR
- 11.4%
- Equity multiple
- 1.83×
- Total profit
- $55,871
- Equity at exit
- $20,664
Cash invested: $66,920 (down + closing). Projections, not guarantees.
Landlord ↔ Tenant lean methodology
- Overall (STATE)
- 18 Strongly Tenant-Friendly
- State California
- 18 Strongly Tenant-Friendly · D+13
- County
- — inherits STATE
- City
- — inherits STATE
ZIP-level market 92117
- Rents YoY
- 1.4%
- Active inventory
- 126
- Price-to-rent
- 7.1×
Monthly cashflow live
- Estimated rent
- $2,797 high interval (Pro) →
- Mortgage (P&I)
- −$1,253
- Tax from tax record
- −$47 /mo · $559/yr
- Insurance
- −$100
- HOA
- −$0
- Vacancy / Maint / Mgmt
- −$587
- Net cashflow
- $810
Break-even live
UW: 25.0% down · 7.5% · 30yr · 1.5% tax · 5.0% vac · 8.0% maint · 8.0% mgmt
Financing live
Cash to close
- Down payment
- $59,750
- Closing costs
- $7,170
- Reserves months
- —
- Total cash needed
- —
Loan-product check · same deal, 3 products live
Conventional
25% down · 7.5% · 30yr
- Down + closing
- —
- Monthly P&I
- —
- Monthly cashflow
- —
- DSCR
- —
- Eligible?
- —
Personal DTI + credit; lowest rate.
DSCR
20% down · 8.5% · 30yr
- Down + closing
- —
- Monthly P&I
- —
- Monthly cashflow
- —
- DSCR
- —
- Eligible?
- —
No personal income docs; deal must DSCR.
Hard money
10% down · 12.0% · 12mo
- Down + closing
- —
- Monthly P&I
- —
- Monthly cashflow
- —
- DSCR
- —
- Eligible?
- —
Short-term bridge; refi at stabilization.
Rent comps 24 comps
| Address | Beds | Baths | Sqft | Rent | $/sqft | DOM | Units | Dist |
|---|---|---|---|---|---|---|---|---|
| 4822 Doliva Dr Unit 4826 201 San Diego, CA | 2.0 | 1.0 | 623 | $2,768 | $4.44 | 24d | 1 | 0.48mi |
| 5136 Kesling St San Diego, CA | 3.0 | 1.0 | 1018 | $3,500 | $3.44 | 5d | 1 | 0.63mi |
| 4960 Clairemont Mesa Blvd Unit 207 San Diego, CA | 1.0 | 1.0 | 525 | $1,695 | $3.23 | 24d | 1 | 0.79mi |
| 4975 Clairemont Mesa Blvd San Diego, CA | 1.0–2.0 | 1.0–1.5 | 626 | $2,295 | $3.67 | 17d | 2 | 0.82mi |
| 4880 Clairemont Mesa Blvd San Diego, CA | 3.0 | 1.0–2.0 | 657 | $3,128 | $4.76 | 2d | 14 | 0.86mi |
| 4863 Clairemont Mesa Blvd San Diego, CA | 2.0 | 1.0 | 900 | $2,450 | $2.72 | 16d | 1 | 0.93mi |
| 4888 Convoy St San Diego, CA | 2.0 | 1.0–2.0 | 860 | $4,468 | $5.19 | 1d | 306 | 1.01mi |
| 4890 Diane Ave Unit H-212 San Diego, CA | 2.0 | 2.0 | 1000 | $2,930 | $2.93 | 24d | 1 | 1.03mi |
| 5404 Balboa Arms Dr #355 San Diego, CA | 2.0 | 2.0 | 880 | $3,000 | $3.41 | 24d | 1 | 1.04mi |
| 4290 Mount Abernathy Ave San Diego, CA | 1.0 | 1.0 | 605 | $2,450 | $4.05 | 7d | 1 | 1.04mi |
| 5550 Balboa Arms Dr San Diego, CA | 1.0–2.0 | 1.0–2.0 | 807 | $2,893 | $3.58 | 3d | 7 | 1.06mi |
| 5402 Balboa Arms Dr #305 San Diego, CA | 2.0 | 2.0 | 827 | $2,800 | $3.39 | 14d | 1 | 1.08mi |
| 6778 Beadnell Way San Diego, CA | 1.0 | 1.0 | 635 | $2,045 | $3.22 | 7d | 1 | 1.09mi |
| 6666 Beadnell Way #21 San Diego, CA | 2.0 | 2.0 | 920 | $2,895 | $3.15 | 21d | 1 | 1.09mi |
| 6602 Beadnell Way #20 San Diego, CA | 2.0 | 2.0 | 920 | $2,595 | $2.82 | 21d | 1 | 1.09mi |
| 6520 Beadnell Way San Diego, CA | 2.0 | 2.0 | 950 | $2,338 | $2.46 | 3d | 1 | 1.09mi |
| 5252 Balboa Arms Dr San Diego, CA | 1.0–2.0 | 1.0–2.0 | 692 | $3,600 | $5.20 | 2d | 3 | 1.09mi |
| 5252 Balboa Arms Dr San Diego, CA | 1.0–2.0 | 1.0–2.0 | 692 | $3,600 | $5.20 | 10d | 3 | 1.09mi |
| 5188 Balboa Arms Dr San Diego, CA | 2.0–3.0 | 1.5–2.0 | 938 | $2,475 | $2.64 | 21d | 2 | 1.10mi |
| 6779 Beadnell Way San Diego, CA | 1.0 | 1.0 | 825 | $2,095 | $2.54 | 7d | 1 | 1.12mi |
| 5150 Balboa Arms Dr San Diego, CA | 2.0 | 1.0–2.0 | 665 | $2,495 | $3.75 | 3d | 3 | 1.12mi |
| 6363 Beadnell Way San Diego, CA | 2.0 | 1.0–2.0 | 875 | $2,899 | $3.31 | 2d | 17 | 1.15mi |
| 6333 Mount Ada Rd #168 San Diego, CA | 1.0 | 1.0 | 581 | $2,595 | $4.47 | 14d | 1 | 1.27mi |
| 5251 Mount Etna Dr San Diego, CA | 1.0–3.0 | 1.0–2.0 | 735 | $2,108 | $2.87 | 24d | 1 | 1.39mi |
Listing history 8 events
-
2026-04-24status Pending
-
2026-04-01status Active
-
2026-03-20status Pending
-
2026-03-12status Active
-
2026-03-11historical
-
2026-02-04$239,000 Active
-
2013-09-11soldstatus $75,000 Sold 245-char remark
Show marketing remark (245 chars)
Lovely Manufactured home, 2Bed. 2Ba. Excellent condition and quality. Central heat and air. Great pride of ownership.Located in popular family park, Kearney Lodge. Near shopping, restaurants, bus, freeway 805/52. Minutes to beaches and downtown.
-
2013-07-18$83,000 Active 245-char remark
Show marketing remark (245 chars)
Lovely Manufactured home, 2Bed. 2Ba. Excellent condition and quality. Central heat and air. Great pride of ownership.Located in popular family park, Kearney Lodge. Near shopping, restaurants, bus, freeway 805/52. Minutes to beaches and downtown.
ⓘ Source: listings_history table (triggers on properties + properties_extension) + one-shot
backfill from property_details.listing_events for pre-trigger history.
Tax reassessment forecast CA · Resets to sale price
- Current annual tax
- $559 · $47/mo
- Projected year-2 tax
- $1,816 · $151/mo
- Expected delta
- +$1,257/yr (+$105/mo · 224.9%)
ⓘ Screening estimate from a state-policy table — verify with the county assessor before closing.
Climate risk First Street
- Flood 1/10 Low FEMA zone X (unshaded) · 0% chance over 30 yrs
- Wildfire 3/10 Moderate
- Heat 3/10 Moderate 6 d/yr ≥89°F today · 18 d/yr by 30 yrs out
- Wind 1/10 Low
- Air quality 3/10 Moderate 4 unhealthy d/yr today · 4 by 30 yrs out
Nearby sold comps map
Loading sold comps map…
Walkable amenities ~0.75 mi
Loading nearby amenities…
Taxation est. · year 1
- Rental income
- $33,564
- − Mortgage interest
- −$13,388
- − Property taxes
- −$559
- − Insurance
- −$1,195
- − Repairs & maintenance
- −$2,685
- − Management
- −$2,685
- − Depreciation
- −$6,953
- Taxable income
- $6,099
- Est. tax owed @ 24.0%
- −$1,464
- After-tax cash flow
- $8,257/yr
For passive investors: Depreciation is non-cash, so a rental often shows a tax loss while cash-flowing — sheltering income. Rental losses are passive: they offset passive income freely, and up to $25,000/yr can offset ordinary (W-2) income if you actively participate and your MAGI is under $100k (phasing out to $0 by $150k); unused losses carry forward. On sale, claimed depreciation is recaptured at up to 25%, and gains may owe capital-gains tax (a 1031 exchange can defer both). Figures are a year-1 estimate at your 24.0% rate — not tax advice; consult a CPA.
Schools (NCES district)
- District
- San Diego Unified
- NCES district ID
- 0634320
- Math proficiency
- 19% ▼ -29.00%
- Reading proficiency
- 29% ▼ -28.00%
- Median HH income
- $61,673
- Composite
- 22.31/100
- National rank
- #8135
- State rank
- #393 of 517 in CA
Livability — San Diego
- Score
- 75/100
- State rank
- #123
- US rank
- #4206
Category grades
Schools grade is shown separately in the Schools card above.
Census & demographics
- Census place
- San Diego, CA
- County
- San Diego County · 3,178,799 people
- City population
- 1,397,612
- Metro
- San Diego-Chula Vista-Carlsbad, CA
- Population (ZIP)
- 52,275
- Household income
- $103,661
- Rent vs Own
- Severe rent burden
- 2209.0
Population outlook (San Diego County) Hauer SSP2
- Today (2025)
- 3,678,185 people
- By 2030
- 3,856,546 · +4.8%
- By 2040
- 4,171,407 · +13.4%
- By 2050
- 4,421,607 · +20.2%
- By 2075
- 4,831,599 · +31.4%
- By 2100
- 4,832,502 · +31.4%
Race, ethnicity, and origin ACS 2023
- Neighborhood character
- Diverse neighborhood (Simpson 0.60)
- Race & ethnicity
- White 57% Hispanic / Latino 25% Two or more races 17% Asian 9% Black 2%
- Hispanic origin (detail)
- Mexican 20%
- Common ancestry
- Lithuanian 2% Italian 2% Slovak 2%
- Foreign-born
- 19% · Canada, Vietnam, Jamaica
- Languages at home
- 73% English-only · Spanish 17% Other Indo-European 3% Vietnamese 2%
Political lean MEDSL · San Diego
- 2024 margin
- D (+16.8) · D 56.9% · R 40.1% · Other 2.9%
- 2008→2024 swing
- +6.6pp toward D · 2008: 10.2pp · 2024: 16.8pp
- All cycles
- 2024: D+16.8 2020: D+22.8 2016: D+17.8 2012: D+5.1 2008: D+10.2
Not yet ingested
- Civics
- —
Market trends
- HPI YoY
- ▼ -1228.75%
- Current HPI
- 398.6104
- Rent YoY
- ▲ 1.42%
- Metro
- San Diego-Chula Vista-Carlsbad, CA
- State GDP YoY
- ▲ 3.21%
- F500 in state
- 116
Industry mix (Fortune 500 HQ in CA)
| Industry | F500 HQs | Revenue |
|---|---|---|
| Technology | 27 | $1,492B |
|
||
| Financial Services | 3 | $174B |
|
||
| Retail | 3 | $44B |
|
||
| Insurance | 3 | $26B |
|
||
| Media / Entertainment | 2 | $115B |
|
||
| Pharmaceuticals / Biotech | 2 | $62B |
|
||
Price history
+188.0% since first listed8 events — show timeline
- 2026-04-24 Pending — SDMLS
- 2026-04-01 Relisted — SDMLS
- 2026-03-20 Pending — SDMLS
- 2026-03-12 Relisted — SDMLS
- 2026-03-11 Listing Removed — SDMLS
- 2026-02-04 Listed $239,000 SDMLS
- 2013-09-11 Sold (MLS) $75,000 SDMLS
- 2013-07-18 Listed $83,000 SDMLS
Property tax history
+3.3%/yrLatest (2013): $559 · +8.8% YoY. Source: county tax records.
Cash-flow waterfall
monthlySold comps — $/sqft
last 12 mo · ≤1 miLoading sold comps…