 🏷️ Likely Rental
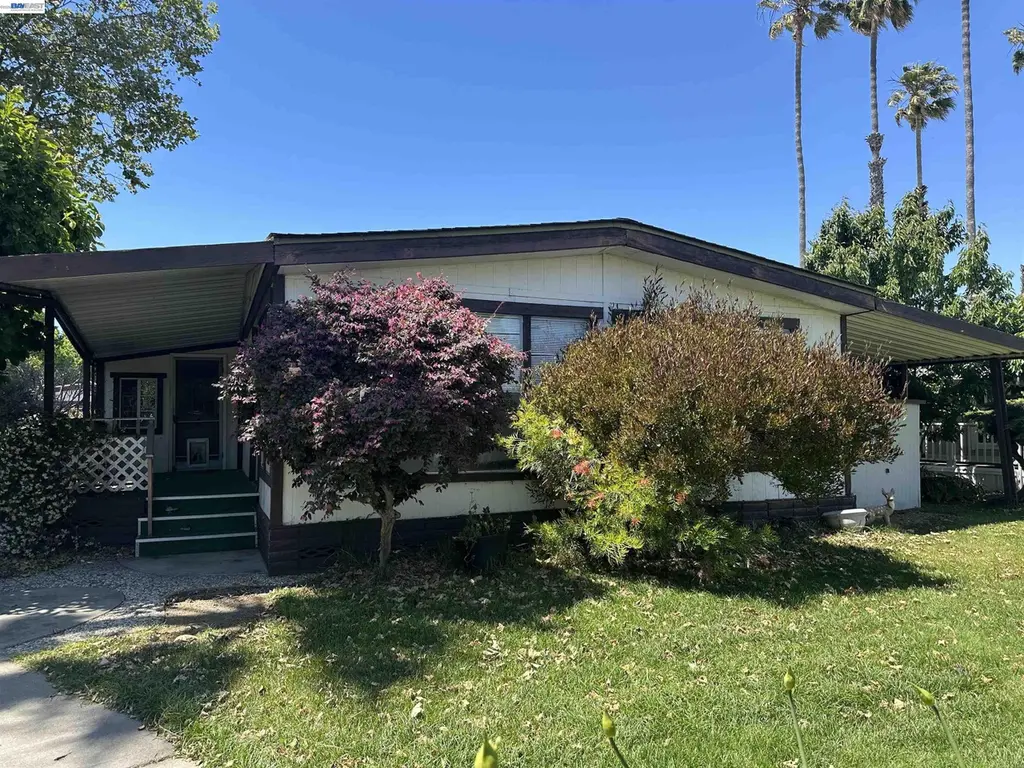
390 Tropicana Way · Union City, CA
Flood risk 3/10 · Minor
- FEMA flood zone
- X (unshaded)
- Chance of flooding over 30 yrs
- 0.18%
- Est. flood insurance / yr
- $507 – $1,088
Fire risk 1/10 · Minimal
- Est. fire insurance / yr
- $659 – $1,223
Heat risk 4/10 · Minor
- Hot days now (above 90°F)
- 7 days/yr
- Hot days in 30 yrs
- 14 days/yr
Wind risk 1/10 · Minimal
- Chance of severe wind over 30 yrs
- —
Air-quality risk 7/10 · Major
- Unhealthy air days now
- 12 days/yr
- Unhealthy air days in 30 yrs
- 12 days/yr
Risk factors via First Street. Map © Google.
Why this score? — see what drove the B+ grade
The composite is a weighted blend of 9 inputs, each scored 0–100. Each bar is that input's sub-score; the figure is the points it added to the 100-point composite (weight × sub-score).
- Cash flow +30.0/30.0
- ARV discount +15.0/15.0
- 1% rule +10.0/10.0
- DSCR +10.0/10.0
- Schools +5.1/10.0
- Livability +3.7/5.0
- Rent growth +3.4/5.0
- Condition / age +2.2/5.0
- Appreciation +0.0/10.0
$149,900
🖨 Deal sheet (PDF) 📄 Offer letter ✓ Due diligence
Listing remarks
Open House Sunday 5/24/26 1:00-4:00PM. Exceptional value and endless potential! Bring your vision and creativity to transform this spacious 2-bedroom, 2-bath home into your perfect retreat. Ideally located next to the clubhouse and guest parking in The Tropics, a friendly senior community, this home offers both convenience and comfort. Features include a large screened-in room, covered parking, and a storage shed for extra space. The washer, dryer, and refrigerator are all included, making your move even easier. Enjoy affordable living with low space rent of just $847.47 per month, along with fantastic community amenities such as a pool, spa, clubhouse, BBQ area, and more. Don’t miss
Key facts
- Covered parking
- Community amenities
- Spa
Tags
Property features AI
Finance
- HOA & community: Pets allowed with limits and approval; Senior community; Community amenities include clubhouse, pool, sauna, spa, BBQ area, game room, guest parking, laundry facilities, putting green, rec room with fireplace, and proximity to golf course; Park interview required
Exterior
- Parking: Carport (tandem)
- Utilities: Public water; Public sewer
- Home design: Manufactured in park (mobile home); Double wide model (San Simeon)
- Construction: Wood siding; Styrofoam skirt
- Exterior features: Covered porch with awning(s); Side yard; Close to clubhouse; Shed(s)
Interior
- Kitchen: Laminate counters; Dishwasher; Disposal; Gas range/cooktop; Built-in oven; Refrigerator
- Bedrooms: 2 bedrooms (street level)
- Flooring: Vinyl flooring; Carpet
- Bathrooms: 2 full bathrooms; Primary bathroom with tub and stall shower; Additional bathroom with stall shower
- Heating & cooling: Forced air heating (natural gas); Central air conditioning
- Interior features: Dining area; Family room; Florida/screen room
- Laundry & utility: Dedicated laundry room; Washer and dryer included; Gas water heater
Neighborhood map
What this means for you Summary
Snapshot
- This is a 2-bed/2.0-bath manufactured listed at $150k. Condition is rated fair.
Deal economics
- At list price, monthly cash flow is $2k ($21k/yr) — positive.
- The deal already cash-flows at list — no discount required.
- Meets the 1% rule at list price ($3k rent vs $150k).
- Cap rate 20.1% vs local median 1.8% in Union City — top-decile yield for the area; either an underpriced asset or a hidden risk that comps aren't pricing in. Stress-test before assuming the spread holds.
Location & tenants
- Location reads 73/100 on livability (#150 in CA) — a middle-class / working-renter tenant base. Strengths: commute A+, employment A+, health & safety A+; Watch: crime D, amenities D, cost of living F.
- New Haven Unified (suburban): math 43% / reading 69% proficiency, ranked #85 of 517 in CA (top 16%) — acceptable for families but not a draw, mixed tenant base, ~2y average lease.
- Market conditions: Rents rising (+3.5%/yr); 145 active listings in the ZIP; 15 comparable units currently listed for rent nearby; rentals at typical pace (median 16d on market — plan ~3-4 weeks tenant-placement turnaround); high-income renter base; 1,742 units permitted in Alameda County in 2024 (856 in 5+ unit buildings).
- This rent runs 31% of the median local income ($134k/yr) — at the standard rent-burdened threshold; future hikes will face affordability resistance.
Forward outlook
- Local home prices are declining (-3.0%/yr); year-one equity from $1k of loan paydown is wiped out by about $4k of value loss. Plan a longer hold.
- Alameda County population projected at +34% by 2050 — long-run rental-demand tailwind backs the buy-and-hold thesis.
- At projected returns (-3.0% appreciation + 3.5% rent growth), your $42k cash investment doubles in ~3 years — after that, you're playing with house money.
Negotiation context
- Only 9 days on market — expect competitive offers; lowballing is unlikely to land.
Questions for the listing agent
- Have any recent inspections been done? Can we get a copy of the seller's disclosures and any deferred-maintenance estimates?
- Built in 1976 — when were the roof, HVAC, electrical panel, plumbing, and water heater last replaced?
- Is there a deadline driving the sale (1031 exchange, divorce, estate, relocation)? That informs how much negotiation room exists.
- Schools are B-rated — typically a magnet for longer-tenancy family renters. What's the average tenant stay here, and is there a school-zone premium baked into asking?
- Crime grade is D in this area — have there been break-ins, vandalism, or insurance claims at this property in the last 3 years? What carrier currently insures it and at what premium?
- What's the average days-on-market for RENTAL listings here right now (not sales)? A rising rental-DOM trend means longer vacancies and softer asking-rent achievability than the comps imply.
- What's the recent tenant-quality profile in this submarket — average credit score on applications, eviction rate, late-payment / NSF rate, and stable-employment percentage? A property-management company in the area should have these aggregated.
- How much new for-sale + rental construction is in the pipeline within 1–3 miles? Heavy new supply typically softens prices + rents 12–24 months out; constrained supply supports both.
Investment metrics
- 1% rule
- 2.33% ✓
- Cap rate
- 20.08%
- Cash-on-cash
- 49.23%
- DSCR
- 3.19
- GRM
- 3.6
CMA / ARV
- ARV (on-the-fly)
- $224,640
- Comps found
- 12
Show comp detail 12 sales within ~0.75 mi
| Address | Dist | Beds/Ba | Sqft | Sold | Price | $/sf | Match |
|---|---|---|---|---|---|---|---|
| 167 Kona Cir | 0.05mi | 2/2.0 | 1,440 (0%) | 7mo | $247,000 | $172 | 92 |
| 269 Oahu | 0.17mi | 2/2.0 | 1,440 (0%) | 1mo | $285,000 | $198 | 91 |
| 324 Waikiki Cir | 0.14mi | 2/2.0 | 1,440 (0%) | 3mo | $165,000 | $115 | 91 |
| 179 Kona Cir | 0.09mi | 2/2.0 | 1,344 (-7%) | 1mo | $260,000 | $193 | 84 |
| 198 Hawaii Cir | 0.13mi | 2/2.0 | 1,464 (+2%) | 10mo | $185,000 | $126 | 83 |
| 51 Palm Dr | 0.21mi | 2/2.0 | 1,440 (0%) | 9mo | $225,000 | $156 | 83 |
| 259 Molokai Cir #259 | 0.13mi | 2/2.0 | 1,344 (-7%) | 0mo | $180,000 | $134 | 83 |
| 418 Fiji Cir #418 | 0.10mi | 2/2.0 | 1,344 (-7%) | 2mo | $313,333 | $233 | 83 |
| 328 Waikiki Cir | 0.12mi | 2/2.0 | 1,344 (-7%) | 3mo | $215,000 | $160 | 81 |
| 17 Palm Dr | 0.19mi | 3/2.0 (+1) | 1,368 (-5%) | 3mo | $200,000 | $146 | 75 |
| 226 Hula Cir | 0.19mi | 2/2.0 | 1,344 (-7%) | 10mo | $205,000 | $153 | 71 |
| 4141 Deepcreek #106 | 0.71mi | 2/2.0 | 1,440 (0%) | 9mo | $130,000 | $90 | 59 |
Match score weights: distance 35% · size 25% · config 20% · recency 20%. Top-matched comps best support the ARV.
Projected returns pro-forma
-3.0% appreciation · 3.49% rent growth · sell at horizon
- IRR
- 47.4%
- Equity multiple
- 3.08×
- Total profit
- $87,163
- Equity at exit
- $22,351
- IRR
- 53.3%
- Equity multiple
- 6.35×
- Total profit
- $224,500
- Equity at exit
- $12,961
Cash invested: $41,972 (down + closing). Projections, not guarantees.
Landlord ↔ Tenant lean methodology
- Overall (STATE)
- 18 Strongly Tenant-Friendly
- State California
- 18 Strongly Tenant-Friendly · D+13
- County
- — inherits STATE
- City
- — inherits STATE
ZIP-level market 94587
- Rents YoY
- 3.5%
- Active inventory
- 145
- Price-to-rent
- 3.6×
Monthly cashflow live
- Estimated rent
- $3,491 high interval (Pro) →
- Mortgage (P&I)
- −$786
- Tax est. 1.5%
- −$187 /mo · $2,248/yr
- Insurance
- −$62
- HOA
- −$0
- Vacancy / Maint / Mgmt
- −$733
- Net cashflow
- $1,722
Break-even live
Sensitivity live
| Price | -10% $1,826 | -5% $1,774 | +0% $1,722 | +5% $1,670 | +10% $1,618 |
|---|---|---|---|---|---|
| Rent | -10% $1,446 | -5% $1,584 | +0% $1,722 | +5% $1,860 | +10% $1,998 |
| Rate | -1.0pp $1,797 | -0.5pp $1,760 | base $1,722 | +0.5pp $1,683 | +1.0pp $1,644 |
UW: 25.0% down · 7.5% · 30yr · 1.5% tax · 5.0% vac · 8.0% maint · 8.0% mgmt
Financing live
Cash to close
- Down payment
- $37,475
- Closing costs
- $4,497
- Reserves months
- —
- Total cash needed
- —
Loan-product check · same deal, 3 products live
Conventional
25% down · 7.5% · 30yr
- Down + closing
- —
- Monthly P&I
- —
- Monthly cashflow
- —
- DSCR
- —
- Eligible?
- —
Personal DTI + credit; lowest rate.
DSCR
20% down · 8.5% · 30yr
- Down + closing
- —
- Monthly P&I
- —
- Monthly cashflow
- —
- DSCR
- —
- Eligible?
- —
No personal income docs; deal must DSCR.
Hard money
10% down · 12.0% · 12mo
- Down + closing
- —
- Monthly P&I
- —
- Monthly cashflow
- —
- DSCR
- —
- Eligible?
- —
Short-term bridge; refi at stabilization.
Rent comps 15 comps
| Address | Beds | Baths | Sqft | Rent | $/sqft | DOM | Units | Dist |
|---|---|---|---|---|---|---|---|---|
| 2262 Eric Ct #4 Union City, CA | 3.0 | 1.5 | 1003 | $3,400 | $3.39 | 4d | 1 | 0.43mi |
| 3842 Cardinal Ter Fremont, CA | 3.0 | 2.5 | 1607 | $4,100 | $2.55 | 18d | 1 | 0.66mi |
| 33877 Raven Ter Fremont, CA | 2.0 | 1.5 | 1315 | $3,700 | $2.81 | 15d | 1 | 0.72mi |
| 2449 Almaden Blvd Union City, CA | 3.0 | 2.0 | 1565 | $4,495 | $2.87 | 2d | 1 | 0.77mi |
| 33411 Madelyn Ter Union City, CA | 2.0 | 2.5 | 1441 | $3,798 | $2.64 | 18d | 1 | 0.78mi |
| 4123 Asimuth Cir Union City, CA | 3.0 | 1.5 | 1280 | $3,350 | $2.62 | 44d | 1 | 0.83mi |
| 4292 Comet Cir Union City, CA | 3.0 | 1.5 | 1250 | $2,950 | $2.36 | 24d | 1 | 0.95mi |
| 34077 Paseo Padre Pkwy Fremont, CA | 1.0–2.0 | 1.0 | 788 | $2,887 | $3.66 | 2d | 13 | 1.11mi |
| 3307 San Marco Ct Union City, CA | 3.0 | 2.0 | 1349 | $3,900 | $2.89 | 3d | 1 | 1.11mi |
| 34426 Bentley Pl Fremont, CA | 3.0 | 2.0 | 1290 | $3,500 | $2.71 | 21d | 1 | 1.13mi |
| 3221 San Carlos Way Union City, CA | 3.0 | 2.0 | 1396 | $3,795 | $2.72 | 4d | 1 | 1.14mi |
| 2500 Medallion Dr Union City, CA | 1.0–3.0 | 1.0 | 781 | $2,585 | $3.31 | 2d | 9 | 1.14mi |
| 3168 Courthouse Dr Union City, CA | 3.0 | 2.0 | 1207 | $4,200 | $3.48 | 15d | 1 | 1.34mi |
| 32468 Deborah Dr Union City, CA | 3.0 | 2.0 | 1340 | $3,949 | $2.95 | 24d | 1 | 1.39mi |
| 4402 Queen Anne Dr Union City, CA | 3.0 | 2.0 | 1357 | $4,200 | $3.10 | 2d | 1 | 1.43mi |
Listing history 1 events
-
2026-05-19$149,900 Active
ⓘ Source: listings_history table (triggers on properties + properties_extension) + one-shot
backfill from property_details.listing_events for pre-trigger history.
Climate risk First Street
- Flood 3/10 Moderate FEMA zone X (unshaded) · 18% chance over 30 yrs
- Wildfire 1/10 Low
- Heat 4/10 Moderate 7 d/yr ≥90°F today · 14 d/yr by 30 yrs out
- Wind 1/10 Low
- Air quality 7/10 Severe 12 unhealthy d/yr today · 12 by 30 yrs out
Nearby sold comps map
Loading sold comps map…
Walkable amenities ~0.75 mi
Loading nearby amenities…
Taxation est. · year 1
- Rental income
- $41,892
- − Mortgage interest
- −$8,397
- − Property taxes
- −$2,248
- − Insurance
- −$750
- − Repairs & maintenance
- −$3,351
- − Management
- −$3,351
- − Depreciation
- −$4,361
- Taxable income
- $19,433
- Est. tax owed @ 24.0%
- −$4,664
- After-tax cash flow
- $15,999/yr
For passive investors: Depreciation is non-cash, so a rental often shows a tax loss while cash-flowing — sheltering income. Rental losses are passive: they offset passive income freely, and up to $25,000/yr can offset ordinary (W-2) income if you actively participate and your MAGI is under $100k (phasing out to $0 by $150k); unused losses carry forward. On sale, claimed depreciation is recaptured at up to 25%, and gains may owe capital-gains tax (a 1031 exchange can defer both). Figures are a year-1 estimate at your 24.0% rate — not tax advice; consult a CPA.
Condition & rehab AI · 30 photos
This manufactured home requires moderate repairs and maintenance to improve its condition and value. Upgrades to the kitchen, bathrooms, and flooring, along with fresh paint and landscaping, can significantly enhance its resale and rental potential.
Repairs flagged
- Moderate kitchen cabinets — Worn and outdated
- Moderate bathroom fixtures — Older and dated
- Minor flooring — Carpet in living areas, vinyl in bathrooms
Value-add opportunities
- Resale Paint interior walls — Fresh paint enhances curb appeal and interior aesthetics
- Resale Replace worn kitchen cabinets — New cabinets improve functionality and aesthetics
- Resale Upgrade bathroom fixtures — Modern fixtures enhance functionality and aesthetics
- Resale Replace worn flooring — New flooring improves comfort and aesthetics
- Both Landscaping — Well-maintained landscaping enhances curb appeal and property value
Renovation cost estimate screening
| Repair item | Severity | Est. cost |
|---|---|---|
| kitchen cabinets · Worn and outdated | Moderate | $3,000–15,000 |
| bathroom fixtures · Older and dated | Moderate | $3,000–15,000 |
| flooring · Carpet in living areas, vinyl in bathrooms | Minor | $500–3,000 |
| Total estimated repair cost · 3 items | $6,500–33,000 |
Value-add ROI direction
- Resale Paint interior walls — Fresh paint enhances curb appeal and interior aesthetics ↑
- Resale Replace worn kitchen cabinets — New cabinets improve functionality and aesthetics ↑
- Resale Upgrade bathroom fixtures — Modern fixtures enhance functionality and aesthetics ↑
- Resale Replace worn flooring — New flooring improves comfort and aesthetics ↑
- Both Landscaping — Well-maintained landscaping enhances curb appeal and property value ↑
ⓘ Cost ranges are severity-bucket heuristics (US national rule-of-thumb). Get contractor quotes + a written scope before underwriting a rehab budget.
Schools (NCES district)
- District
- New Haven Unified
- NCES district ID
- 0626910
- Math proficiency
- 43% ▲ 1.00%
- Reading proficiency
- 69% ▲ 18.00%
- Median HH income
- $87,202
- Composite
- 51.21/100
- National rank
- #1754
- State rank
- #85 of 517 in CA
Livability — Union City
- Score
- 73/100
- State rank
- #150
- US rank
- #5027
Category grades
Schools grade is shown separately in the Schools card above.
Census & demographics
- Census place
- Union City, CA
- County
- Alameda County · 1,614,355 people
- City population
- 67,464
- Metro
- San Francisco-Oakland-Berkeley, CA
- Population (ZIP)
- 67,464
- Household income
- $133,715
- Rent vs Own
- Severe rent burden
- 1565.0
Population outlook (Alameda County) Hauer SSP2
- Today (2025)
- 1,928,884 people
- By 2030
- 2,069,146 · +7.3%
- By 2040
- 2,338,405 · +21.2%
- By 2050
- 2,586,608 · +34.1%
- By 2075
- 3,061,911 · +58.7%
- By 2100
- 3,234,133 · +67.7%
Race, ethnicity, and origin ACS 2023
- Neighborhood character
- Diverse neighborhood (Simpson 0.63)
- Race & ethnicity
- Asian 55% Hispanic / Latino 19% White 15% Two or more races 10% Black 5%
- Hispanic origin (detail)
- Mexican 16%
- Common ancestry
- Russian 1% Slovak 1%
- Foreign-born
- 47% · China, Canada, Vietnam
- Languages at home
- 39% English-only · Spanish 13% Other Indo-European 13% Tagalog/Filipino 12%
Political lean MEDSL · Alameda
- 2024 margin
- Solid D (+53.6) · D 74.6% · R 21.0% · Other 4.4%
- 2008→2024 swing
- -5.9pp toward R · 2008: 59.5pp · 2024: 53.6pp
- All cycles
- 2024: D+53.6 2020: D+62.5 2016: D+64.4 2012: D+59.8 2008: D+59.5
Not yet ingested
- Civics
- —
Market trends
- HPI YoY
- ▼ -1280.49%
- Current HPI
- 343.0333
- Rent YoY
- ▲ 3.49%
- Metro
- San Francisco-Oakland-Berkeley, CA
- State GDP YoY
- ▲ 3.21%
- F500 in state
- 116
Industry mix (Fortune 500 HQ in CA)
| Industry | F500 HQs | Revenue |
|---|---|---|
| Technology | 27 | $1,492B |
|
||
| Financial Services | 3 | $174B |
|
||
| Retail | 3 | $44B |
|
||
| Insurance | 3 | $26B |
|
||
| Media / Entertainment | 2 | $115B |
|
||
| Pharmaceuticals / Biotech | 2 | $62B |
|
||
Price history
1 event — show timeline
- 2026-05-19 Listed $149,900 bridgeMLS, Bay East AOR, or Contra Costa AOR
Cash-flow waterfall
monthlySold comps — $/sqft
last 12 mo · ≤1 miLoading sold comps…