29 W Andrew Ln · Cortez, CO
Flood risk 1/10 · Minimal
- FEMA flood zone
- X (unshaded)
- Chance of flooding over 30 yrs
- 0.0%
- Est. flood insurance / yr
- $507 – $1,088
Fire risk 6/10 · Moderate
- Est. fire insurance / yr
- $939 – $1,743
Heat risk 4/10 · Minor
- Hot days now (above 91°F)
- 8 days/yr
- Hot days in 30 yrs
- 22 days/yr
Wind risk 1/10 · Minimal
- Chance of severe wind over 30 yrs
- —
Air-quality risk 1/10 · Minimal
- Unhealthy air days now
- 0 days/yr
- Unhealthy air days in 30 yrs
- 0 days/yr
Risk factors via First Street. Map © Google.
Why this score? — see what drove the B grade
The composite is a weighted blend of 9 inputs, each scored 0–100. Each bar is that input's sub-score; the figure is the points it added to the 100-point composite (weight × sub-score).
- Cash flow +30.0/30.0
- ARV discount +15.0/15.0
- DSCR +10.0/10.0
- 1% rule +8.7/10.0
- Livability +3.4/5.0
- Rent growth +2.5/5.0
- Condition / age +2.5/5.0
- Schools +2.1/10.0
- Appreciation +0.0/10.0
$130,000
🖨 Deal sheet 📄 Offer letter ✓ Due diligence
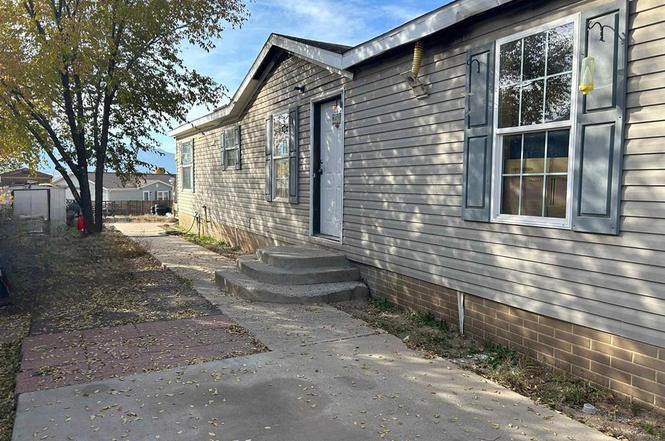
Listing remarks
Are you looking for a fixer upper project or just a lot zoned for mobile/modular in the city limits? This property could go either way. Unfortunately, the 2006 manufactured home experienced fire damage. The house could be leveled or possibly be salvaged. This . 22 acre lot is in city limits, a rare find if you're looking for a lot zoned for modular/manufactured homes and a lot that has all utilities ready to go.
Key facts
- Lot zoned for mobile
- 9,583 sq ft lot
- Built 2006
Tags
Property features AI
Exterior
- Utilities: Connected to public water; Public sewer
- Home design: Single-story; Double wide mobile home
- Construction: Modular/Prefab construction; Vinyl siding; Block foundation with skirt and tie-downs
- Exterior features: Partial fencing; City street frontage; Residential single-family zoning
Interior
- Kitchen: Oven; Range; Refrigerator; Dishwasher
- Bedrooms: Primary bedroom located on the main level
- Bathrooms: 2 full bathrooms
- Heating & cooling: Forced air heating; Natural gas heating
- Interior features: Main level primary bedroom; Unfurnished
- Laundry & utility: Washer; Dryer
Neighborhood map
What this means for you Summary
Snapshot
- This is a 3-bed/2.0-bath manufactured listed at $130k.
Deal economics
- At list price, monthly cash flow is $636 ($8k/yr) — positive.
- The deal already cash-flows at list — no discount required.
- Meets the 1% rule at list price ($2k rent vs $130k).
- Recommended offer: $114k (12.0% below list) — sets the bar for market timing.
- Cap rate 12.2% vs local median 3.3% in Cortez — top-decile yield for the area; either an underpriced asset or a hidden risk that comps aren't pricing in. Stress-test before assuming the spread holds.
Location & tenants
- Location reads 67/100 on livability (#125 in CO) — a middle-class / working-renter tenant base. Strengths: cost of living A+, health & safety A+, housing A; Watch: schools D-, crime F, amenities F.
- Montezuma-Cortez School District No. Re-1 (town): math 16% / reading 33% proficiency, ranked #70 of 86 in CO (top 81%) — low school quality limits family demand, transient renter base, plan for 1-2y turnover.
- Market conditions: 223 active listings in the ZIP; 3 comparable units currently listed for rent nearby; rentals leasing fast (median 3d on market — plan ~1-2 weeks tenant-placement turnaround); 24 units permitted in Montezuma County in 2024 (0 in 5+ unit buildings).
- This rent runs 36% of the median local income ($60k/yr) — at the standard rent-burdened threshold; future hikes will face affordability resistance.
Forward outlook
- Local home prices are declining (-3.0%/yr); year-one equity from $899 of loan paydown is wiped out by about $4k of value loss. Plan a longer hold.
- At projected returns (-3.0% appreciation + 3.0% rent growth), your $36k cash investment doubles in ~6 years — after that, you're playing with house money.
Negotiation context
- It's been on market 223 days — a 12% lower offer ($114k) is reasonable based on typical stale-listing flexibility.
- Current owner paid $91k; 43% above their basis — modest negotiation headroom, anchor on the comps not their cost.
Risks & watch-outs
- Climate carrying-cost: major wildfire risk — expect insurance premiums to compound above CPI over the hold.
Questions for the listing agent
- It's been on market 223 days. Have you received any prior offers? Is the seller open to a 12% concession, seller financing, or rate buy-down credit?
- Why hasn't it sold? Are there any deal-killer items the seller is aware of (foundation, flood, title, zoning, code violations)?
- Is there a deadline driving the sale (1031 exchange, divorce, estate, relocation)? That informs how much negotiation room exists.
- Schools are D-rated, which usually means shorter tenancies and higher turnover. Who's the typical renter profile here, and what's been the actual vacancy rate?
- Crime grade is F in this area — have there been break-ins, vandalism, or insurance claims at this property in the last 3 years? What carrier currently insures it and at what premium?
- What's the average days-on-market for RENTAL listings here right now (not sales)? A rising rental-DOM trend means longer vacancies and softer asking-rent achievability than the comps imply.
- What's the recent tenant-quality profile in this submarket — average credit score on applications, eviction rate, late-payment / NSF rate, and stable-employment percentage? A property-management company in the area should have these aggregated.
- How much new for-sale + rental construction is in the pipeline within 1–3 miles? Heavy new supply typically softens prices + rents 12–24 months out; constrained supply supports both.
Investment metrics
- 1% rule
- 1.37% ✓
- Cap rate
- 12.17%
- Cash-on-cash
- 20.98%
- DSCR
- 1.93
- GRM
- 6.1
CMA / ARV
- ARV (on-the-fly)
- $258,336
- Comps found
- 5
Show comp detail 5 sales within ~0.75 mi
| Address | Dist | Beds/Ba | Sqft | Sold | Price | $/sf | Match |
|---|---|---|---|---|---|---|---|
| 1255 S Madison St | 0.21mi | 3/2.0 | 1,232 (-1%) | 9mo | $255,000 | $207 | 80 |
| 802 Bluffs Blvd | 0.57mi | 3/2.0 | 1,344 (+8%) | 0mo | $355,000 | $264 | 60 |
| 405 W 7th #70 | 0.44mi | 2/2.0 (-1) | 1,280 (+3%) | 13mo | $45,000 | $35 | 60 |
| 425 W 7th St | 0.54mi | 3/2.0 | 1,128 (-10%) | 7mo | $289,000 | $256 | 53 |
| 519 S Beech St | 0.55mi | 3/2.0 | 1,120 (-10%) | 6mo | $129,000 | $115 | 52 |
Match score weights: distance 35% · size 25% · config 20% · recency 20%. Top-matched comps best support the ARV.
Projected returns pro-forma
-3.0% appreciation · 3.0% rent growth · sell at horizon
- IRR
- 13.4%
- Equity multiple
- 1.53×
- Total profit
- $19,415
- Equity at exit
- $19,383
- IRR
- 22.2%
- Equity multiple
- 2.89×
- Total profit
- $68,896
- Equity at exit
- $11,240
Cash invested: $36,400 (down + closing). Projections, not guarantees.
Landlord ↔ Tenant lean methodology
- Overall (STATE)
- 38 Tenant-Leaning
- State Colorado
- 38 Tenant-Leaning · D+4
- County
- — inherits STATE
- City
- — inherits STATE
ZIP-level market 81321
- Active inventory
- 223
- Price-to-rent
- 6.1×
Monthly cashflow live
- Estimated rent
- $1,786 medium interval (Pro) →
- Mortgage (P&I)
- −$682
- Tax from tax record
- −$39 /mo · $464/yr
- Insurance
- −$54
- HOA
- −$0
- Vacancy / Maint / Mgmt
- −$375
- Net cashflow
- $636
Break-even live
UW: 25.0% down · 7.5% · 30yr · 1.5% tax · 5.0% vac · 8.0% maint · 8.0% mgmt
Financing live
Cash to close
- Down payment
- $32,500
- Closing costs
- $3,900
- Reserves months
- —
- Total cash needed
- —
Loan-product check · same deal, 3 products live
Conventional
25% down · 7.5% · 30yr
- Down + closing
- —
- Monthly P&I
- —
- Monthly cashflow
- —
- DSCR
- —
- Eligible?
- —
Personal DTI + credit; lowest rate.
DSCR
20% down · 8.5% · 30yr
- Down + closing
- —
- Monthly P&I
- —
- Monthly cashflow
- —
- DSCR
- —
- Eligible?
- —
No personal income docs; deal must DSCR.
Hard money
10% down · 12.0% · 12mo
- Down + closing
- —
- Monthly P&I
- —
- Monthly cashflow
- —
- DSCR
- —
- Eligible?
- —
Short-term bridge; refi at stabilization.
Rent comps 3 comps
| Address | Beds | Baths | Sqft | Rent | $/sqft | DOM | Units | Dist |
|---|---|---|---|---|---|---|---|---|
| 507 S Chestnut St Cortez, CO | 3.0 | 2.0 | 1398 | $1,800 | $1.29 | 2d | 1 | 0.55mi |
| 446 S Linden St Cortez, CO | 2.0 | 1.0 | 1040 | $1,700 | $1.63 | 2d | 1 | 0.61mi |
| 417 S Cedar St Cortez, CO | 2.0 | 1.0 | 760 | $1,350 | $1.78 | 23d | 1 | 0.76mi |
Listing history 19 events
-
2026-06-18days on market $130,000 Active 223 DOM
-
2026-06-17days on market $130,000 Active 222 DOM
-
2026-06-16days on market $130,000 Active 221 DOM
-
2026-06-15days on market $130,000 Active 220 DOM
-
2026-06-14days on market $130,000 Active 218 DOM
-
2026-06-10days on market $130,000 Active 215 DOM
-
2026-06-09days on market $130,000 Active 214 DOM
-
2026-06-08days on market $130,000 Active 213 DOM
-
2026-06-07days on market $130,000 Active 212 DOM
-
2026-06-05days on market $130,000 Active 209 DOM
-
2026-06-03days on market $130,000 Active 208 DOM
-
2026-06-02days on market $130,000 Active 207 DOM
-
2026-06-01days on market $130,000 Active 206 DOM
-
2026-05-31days on market $130,000 Active 205 DOM
-
2026-05-31days on market $130,000 Active 204 DOM
-
2026-02-22price $130,000
-
2025-12-07price $145,000
-
2025-11-06$160,000 Active
-
2005-10-21soldstatus $90,798
ⓘ Source: listings_history table (triggers on properties + properties_extension) + one-shot
backfill from property_details.listing_events for pre-trigger history.
Tax reassessment forecast CO · Resets to sale price
- Current annual tax
- $464 · $39/mo
- Projected year-2 tax
- $715 · $60/mo
- Expected delta
- +$251/yr (+$21/mo · 54.2%)
ⓘ Screening estimate from a state-policy table — verify with the county assessor before closing.
Climate risk First Street
- Flood 1/10 Low FEMA zone X (unshaded) · 0% chance over 30 yrs
- Wildfire 6/10 Major
- Heat 4/10 Moderate 8 d/yr ≥91°F today · 22 d/yr by 30 yrs out
- Wind 1/10 Low
- Air quality 1/10 Low 0 unhealthy d/yr today · 0 by 30 yrs out
Nearby sold comps map
Loading sold comps map…
Walkable amenities ~0.75 mi
Loading nearby amenities…
Taxation est. · year 1
- Rental income
- $21,431
- − Mortgage interest
- −$7,282
- − Property taxes
- −$464
- − Insurance
- −$650
- − Repairs & maintenance
- −$1,715
- − Management
- −$1,715
- − Depreciation
- −$3,782
- Taxable income
- $5,825
- Est. tax owed @ 24.0%
- −$1,398
- After-tax cash flow
- $6,238/yr
For passive investors: Depreciation is non-cash, so a rental often shows a tax loss while cash-flowing — sheltering income. Rental losses are passive: they offset passive income freely, and up to $25,000/yr can offset ordinary (W-2) income if you actively participate and your MAGI is under $100k (phasing out to $0 by $150k); unused losses carry forward. On sale, claimed depreciation is recaptured at up to 25%, and gains may owe capital-gains tax (a 1031 exchange can defer both). Figures are a year-1 estimate at your 24.0% rate — not tax advice; consult a CPA.
Schools (NCES district)
- District
- Montezuma-Cortez School District No. Re-1
- NCES district ID
- 0803090
- Math proficiency
- 16% ▼ -2.00%
- Reading proficiency
- 33% ▼ -1.00%
- Median HH income
- $42,394
- Composite
- 20.85/100
- National rank
- #8499
- State rank
- #70 of 86 in CO
Livability — Cortez
- Score
- 67/100
- State rank
- #125
- US rank
- #10641
Category grades
Schools grade is shown separately in the Schools card above.
Census & demographics
- Census place
- Cortez, CO
- County
- Montezuma County · 18,723 people
- City population
- 14,236
- Metro
- nan
- Population (ZIP)
- 14,236
- Household income
- $59,506
- Rent vs Own
- Severe rent burden
- 403.0
Population outlook (Montezuma County) Hauer SSP2
- Today (2025)
- 26,943 people
- By 2030
- 27,208 · +1.0%
- By 2040
- 27,372 · +1.6%
- By 2050
- 27,180 · +0.9%
- By 2075
- 26,493 · -1.7%
- By 2100
- 23,364 · -13.3%
Race, ethnicity, and origin ACS 2023
- Neighborhood character
- Predominantly White (69%)
- Race & ethnicity
- White 69% Hispanic / Latino 15% Two or more races 10% Native American 9% Asian 1% Black 1%
- Hispanic origin (detail)
- Mexican 9%
- Common ancestry
- Slovak 3% Iranian 3% Italian 2%
- Foreign-born
- 4% · Canada, China
- Languages at home
- 87% English-only · Spanish 6% Chinese 1% Russian/Polish/Slavic 1%
Political lean MEDSL · Montezuma
- 2024 margin
- Strong R (+21.0) · D 38.3% · R 59.3% · Other 2.5%
- 2008→2024 swing
- -1.6pp toward R · 2008: -19.4pp · 2024: -21.0pp
- All cycles
- 2024: R+21.0 2020: R+22.4 2016: R+30.3 2012: R+23.6 2008: R+19.4
Not yet ingested
- Civics
- —
Market trends
- HPI YoY
- ▼ -274.25%
- Current HPI
- 264.2281
- Rent YoY
- —
- Metro
- nan
- State GDP YoY
- ▲ 1.95%
- F500 in state
- 14
Industry mix (Fortune 500 HQ in CO)
| Industry | F500 HQs | Revenue |
|---|---|---|
| Technology Distribution | 1 | $31B |
|
||
| Food / Agriculture | 1 | $18B |
|
||
| Packaging | 1 | $14B |
|
||
| Healthcare | 1 | $13B |
|
||
| Energy | 1 | $10B |
|
||
| Technology | 1 | $4B |
|
||
Price history
+43.2% since first listed4 events — show timeline
- 2026-02-22 Price Changed $130,000 cren
- 2025-12-07 Price Changed $145,000 cren
- 2025-11-06 Listed $160,000 cren
- 2005-10-21 Sold (Public Records) $90,798 Public Records
Property tax history
-2.1%/yrLatest (2025): $464 · -11.4% YoY. Source: county tax records.
Cash-flow waterfall
monthlySold comps — $/sqft
last 12 mo · ≤1 miLoading sold comps…