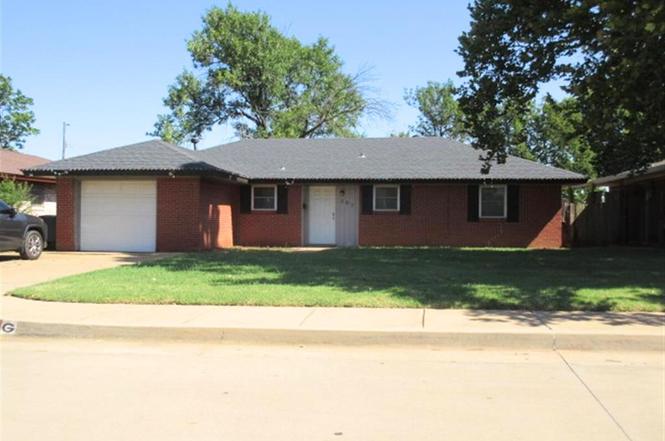
507 E 29th St · Edmond, OK
Flood risk 1/10 · Minimal
- FEMA flood zone
- X (unshaded)
- Chance of flooding over 30 yrs
- 0.0%
- Est. flood insurance / yr
- $507 – $1,088
Fire risk 1/10 · Minimal
- Est. fire insurance / yr
- $2,463 – $4,575
Heat risk 6/10 · Moderate
- Hot days now (above 108°F)
- 7 days/yr
- Hot days in 30 yrs
- 19 days/yr
Wind risk 2/10 · Minimal
- Chance of severe wind over 30 yrs
- 3.0%
Air-quality risk 2/10 · Minimal
- Unhealthy air days now
- 2 days/yr
- Unhealthy air days in 30 yrs
- 2 days/yr
Risk factors via First Street. Map © Google.
Why this score? — see what drove the D grade
The composite is a weighted blend of 9 inputs, each scored 0–100. Each bar is that input's sub-score; the figure is the points it added to the 100-point composite (weight × sub-score).
- Cash flow +13.0/30.0
- ARV discount +10.9/15.0
- DSCR +3.9/10.0
- Livability +3.9/5.0
- Schools +3.6/10.0
- 1% rule +3.5/10.0
- Rent growth +3.3/5.0
- Condition / age +2.5/5.0
- Appreciation +0.0/10.0
$180,000
🖨 Deal sheet 📄 Offer letter ✓ Due diligence
Listing remarks MLS
Welcome home!! This cozy three bedroom home is waiting for its new owners! Come see all this home has to offer, including beautiful wood flooring throughout, fresh paint, eye catching backsplash, three large bedrooms, one and half baths, huge yard, beautiful landscaping, walking distance to schools, shopping, dining, and so much more.
Key facts
- Wood flooring
- Updated finishes
- Large backyard
Tags
Property features AI
Finance
- Other: Living area: 1,070 (assessor)
- Financial info: Offered as-is; Not assumable; Occupied (rented) — sale may require court approval
- HOA & community: No mandatory association dues
Exterior
- Parking: Detached 1-car garage
- Utilities: Public utilities
- Home design: Single family residence; One level; South-facing
- Construction: Brick and frame construction; Composition roof; Slab foundation; Existing property
- Exterior features: Interior lot; Open patio
Interior
- Kitchen: Built-in range (gas); Double ovens (electric); Dishwasher
- Bedrooms: 3 bedrooms
- Bathrooms: 1 full bath; 1 half bath
- Interior features: Ceiling fan(s); Open patio
- Laundry & utility: Garage door lift
Neighborhood map
What this means for you Summary
Snapshot
- This is a 3-bed/2.0-bath single-family listed at $180k.
Deal economics
- At list price, monthly cash flow is $-8 ($-100/yr) — negative.
- To cash-flow at today's rent, offer at most $179k (0.8% below list).
- To meet the 1% rule (rent ≥ 1% of price), the offer needs to be $153k (14.8% below list).
- Recommended offer: $153k (14.8% below list) — sets the bar for 1% rule.
- Cap rate 6.2% vs local median 3.4% in Edmond — top-decile yield for the area; either an underpriced asset or a hidden risk that comps aren't pricing in. Stress-test before assuming the spread holds.
Location & tenants
- Location reads 78/100 on livability (#6 in OK, #2,383 nationally) — a middle-class / working-renter tenant base. Strengths: employment A+, housing A+, crime A-; Watch: health & safety C-, commute F.
- Edmond (suburban): math 38% / reading 40% proficiency, ranked #11 of 270 in OK (top 4%) — families likely to look elsewhere, expect single-tenant / working-renter base with shorter leases.
- Zoned schools: Orvis Risner Es (math 26% / reading 33%, grade F, #255 of 845 statewide, top 35%, 568 students, 0% FRL); Memorial Hs (math 44% / reading 56%, grade D+, #4 of 447 statewide, top 1%, 2,605 students, 0% FRL) — zoned schools average 0% FRL vs 22% district-wide (22 pts lower); this property's tenant base skews higher-income than the district average.
- Market conditions: Rents rising (+3.1%/yr); 654 active listings in the ZIP; 22 comparable units currently listed for rent nearby; rentals at typical pace (median 15d on market — plan ~3-4 weeks tenant-placement turnaround); high-income renter base; 5,365 units permitted in Oklahoma County in 2024 (569 in 5+ unit buildings).
- This rent is only 16% of the median local income ($114k/yr) — well below the 30% rent-burden line; pricing power to push rent on renewal without tenant pushback.
Forward outlook
- Local home prices are declining (-3.0%/yr); year-one equity from $1k of loan paydown is wiped out by about $5k of value loss. Plan a longer hold.
- Oklahoma County population projected at +41% by 2050 — long-run rental-demand tailwind backs the buy-and-hold thesis.
Negotiation context
- It's been on market 89 days — a 6% lower offer ($169k) is reasonable based on typical stale-listing flexibility.
- 2 sale attempts since 4y ago; this cycle's ask has dropped $12k (6%) from the opening price — seller is motivated, your offer sets the floor, not the list.
Risks & watch-outs
- Climate carrying-cost: extreme-heat days projected 7→19/yr by 2055 (HVAC capex compounding) — expect insurance premiums to compound above CPI over the hold.
Questions for the listing agent
- What do current leases actually rent for vs. the listed asking? Can we see a recent rent roll and the last 12 months of T-12 income?
- It's been on market 89 days. Have you received any prior offers? Is the seller open to a 15% concession, seller financing, or rate buy-down credit?
- Built in 1964 — when were the roof, HVAC, electrical panel, plumbing, and water heater last replaced?
- Why hasn't it sold? Are there any deal-killer items the seller is aware of (foundation, flood, title, zoning, code violations)?
- Is there a deadline driving the sale (1031 exchange, divorce, estate, relocation)? That informs how much negotiation room exists.
- Schools are A-rated — typically a magnet for longer-tenancy family renters. What's the average tenant stay here, and is there a school-zone premium baked into asking?
- The area grade is low — what's the realistic commute time and amenity access for the typical tenant pool here? Any planned neighborhood developments (good or bad) we should know about?
- What's the average days-on-market for RENTAL listings here right now (not sales)? A rising rental-DOM trend means longer vacancies and softer asking-rent achievability than the comps imply.
- What's the recent tenant-quality profile in this submarket — average credit score on applications, eviction rate, late-payment / NSF rate, and stable-employment percentage? A property-management company in the area should have these aggregated.
- How much new for-sale + rental construction is in the pipeline within 1–3 miles? Heavy new supply typically softens prices + rents 12–24 months out; constrained supply supports both.
Investment metrics
- 1% rule
- 0.85% ✗
- Cap rate
- 6.24%
- Cash-on-cash
- -0.20%
- DSCR
- 0.99
- GRM
- 9.8
CMA / ARV
- ARV (on-the-fly)
- $194,740
- Comps found
- 12
Show comp detail 12 sales within ~0.75 mi
| Address | Dist | Beds/Ba | Sqft | Sold | Price | $/sf | Match |
|---|---|---|---|---|---|---|---|
| 2329 Elwood Dr | 0.43mi | 3/1.5 | 1,074 (+0%) | 4mo | $196,225 | $183 | 74 |
| 1817 Edgewood Dr | 0.44mi | 3/2.0 | 1,108 (+4%) | 0mo | $165,000 | $149 | 73 |
| 125 Ann Arbor | 0.33mi | 3/1.5 | 1,030 (-4%) | 9mo | $185,000 | $180 | 69 |
| 652 Reynolds Rd | 0.40mi | 2/1.5 (-1) | 1,097 (+2%) | 3mo | $199,900 | $182 | 68 |
| 3001 Beverly Dr | 0.12mi | 3/2.0 | 1,228 (+15%) | 2mo | $210,000 | $171 | 68 |
| 308 N Reynolds Rd | 0.39mi | 3/1.5 | 1,152 (+8%) | 7mo | $217,000 | $188 | 61 |
| 104 Burton Pl | 0.39mi | 3/2.0 | 1,205 (+13%) | 3mo | $225,000 | $187 | 58 |
| 605 Reynolds Rd | 0.39mi | 3/1.5 | 954 (-11%) | 9mo | $186,935 | $196 | 55 |
| 1715 Edgewood Dr | 0.54mi | 3/1.0 | 1,191 (+11%) | 1mo | $197,000 | $165 | 51 |
| 625 Reynolds Rd | 0.39mi | 2/1.0 (-1) | 955 (-11%) | 5mo | $185,000 | $194 | 51 |
| 1813 S Rankin St | 0.49mi | 3/1.5 | 1,203 (+12%) | 7mo | $210,000 | $175 | 48 |
| 2209 Marshall Dr | 0.48mi | 3/1.0 | 923 (-14%) | 9mo | $152,700 | $165 | 43 |
Match score weights: distance 35% · size 25% · config 20% · recency 20%. Top-matched comps best support the ARV.
Projected returns pro-forma
-3.0% appreciation · 3.14% rent growth · sell at horizon
- IRR
- -16.5%
- Equity multiple
- 0.42×
- Total profit
- $-29,471
- Equity at exit
- $26,839
- IRR
- -8.0%
- Equity multiple
- 0.50×
- Total profit
- $-25,417
- Equity at exit
- $15,563
Cash invested: $50,400 (down + closing). Projections, not guarantees.
Landlord ↔ Tenant lean methodology
- Overall (STATE)
- 83 Strongly Landlord-Friendly
- State Oklahoma
- 83 Strongly Landlord-Friendly · R+20
- County
- — inherits STATE
- City
- — inherits STATE
ZIP-level market 73013
- Rents YoY
- 3.1%
- Active inventory
- 654
- Price-to-rent
- 9.8×
Monthly cashflow live
- Estimated rent
- $1,534 high interval (Pro) →
- Mortgage (P&I)
- −$944
- Tax from tax record
- −$201 /mo · $2,418/yr
- Insurance
- −$75
- HOA
- −$0
- Vacancy / Maint / Mgmt
- −$322
- Net cashflow
- $-8
Break-even live
UW: 25.0% down · 7.5% · 30yr · 1.5% tax · 5.0% vac · 8.0% maint · 8.0% mgmt
Financing live
Cash to close
- Down payment
- $45,000
- Closing costs
- $5,400
- Reserves months
- —
- Total cash needed
- —
Loan-product check · same deal, 3 products live
Conventional
25% down · 7.5% · 30yr
- Down + closing
- —
- Monthly P&I
- —
- Monthly cashflow
- —
- DSCR
- —
- Eligible?
- —
Personal DTI + credit; lowest rate.
DSCR
20% down · 8.5% · 30yr
- Down + closing
- —
- Monthly P&I
- —
- Monthly cashflow
- —
- DSCR
- —
- Eligible?
- —
No personal income docs; deal must DSCR.
Hard money
10% down · 12.0% · 12mo
- Down + closing
- —
- Monthly P&I
- —
- Monthly cashflow
- —
- DSCR
- —
- Eligible?
- —
Short-term bridge; refi at stabilization.
Rent comps 22 comps
| Address | Beds | Baths | Sqft | Rent | $/sqft | DOM | Units | Dist |
|---|---|---|---|---|---|---|---|---|
| 205 E 30th St Unit 1 Edmond, OK | 3.0 | 2.0 | 1400 | $1,450 | $1.04 | 23d | 1 | 0.21mi |
| 140 Ridgecrest Rd Edmond, OK | 3.0 | 1.0 | 1000 | $1,400 | $1.40 | 21d | 1 | 0.37mi |
| 2113 Henderson Dr Unit 1 Edmond, OK | 3.0 | 1.0 | 1036 | $1,295 | $1.25 | 14d | 1 | 0.46mi |
| 637 Redstone Ave Edmond, OK | 3.0 | 1.5 | 1228 | $1,450 | $1.18 | 14d | 1 | 0.46mi |
| 1817 Hardy Dr Edmond, OK | 3.0 | 2.0 | 1074 | $1,350 | $1.26 | 23d | 1 | 0.52mi |
| 345 Travis Cir Edmond, OK | 3.0 | 2.0 | 1325 | $1,495 | $1.13 | 2d | 1 | 0.55mi |
| 1715 Edgewood Dr Edmond, OK | 2.0 | 1.0 | 1191 | $1,450 | $1.22 | 11d | 1 | 0.56mi |
| 118 Sahoma Ter Edmond, OK | 3.0 | 2.0 | 1200 | $1,350 | $1.12 | 3d | 1 | 0.61mi |
| 118 Sahoma Ter Edmond, OK | 3.0 | 2.0 | 1200 | $1,350 | $1.12 | 4d | 1 | 0.61mi |
| 117 Sahoma Ter Edmond, OK | 2.0 | 2.0 | 1183 | $1,345 | $1.14 | 23d | 1 | 0.64mi |
| 240 E 15th St Edmond, OK | 1.0–2.0 | 1.0 | 745 | $1,075 | $1.44 | 23d | 6 | 0.75mi |
| 1600 Chelsea Dr Edmond, OK | 1.0–2.0 | 1.0 | 700 | $895 | $1.28 | 3d | 5 | 0.78mi |
| 3621 Wynn Dr Edmond, OK | 1.0–2.0 | 1.0–1.5 | 894 | $1,099 | $1.23 | 1d | 6 | 0.85mi |
| 777 E 15th St Edmond, OK | 1.0–3.0 | 1.0–2.0 | 1135 | $1,866 | $1.64 | 1d | 23 | 0.88mi |
| 14025 N Eastern Ave Edmond, OK | 2.0 | 2.0 | 1108 | $1,349 | $1.22 | 23d | 1 | 1.04mi |
| 14140 N Broadway Ext Edmond, OK | 4.0 | 2.0 | 1327 | $1,708 | $1.29 | 23d | 1 | 1.10mi |
| 930 S Boulevard Edmond, OK | 1.0–2.0 | 1.0–2.0 | 792 | $1,085 | $1.37 | 4d | 10 | 1.13mi |
| 14002 Crossing Way E Edmond, OK | 2.0 | 2.0 | 1327 | $1,600 | $1.21 | 11d | 1 | 1.27mi |
| 1028 Mollie Rausch Ln Edmond, OK | 3.0 | 2.0 | 1495 | $1,650 | $1.10 | 23d | 1 | 1.38mi |
| 730 S Littler Ave Edmond, OK | 2.0 | 1.0 | 792 | $1,250 | $1.58 | 21d | 1 | 1.43mi |
| 2501 Kelley Pointe Pkwy Edmond, OK | 1.0–2.0 | 1.0–2.0 | 909 | $1,979 | $2.18 | 1d | 18 | 1.47mi |
| 401 E 7th St Edmond, OK | 3.0 | 2.0 | 1255 | $1,450 | $1.16 | 23d | 1 | 1.47mi |
Listing history 9 events
-
2026-05-13status Pending
-
2026-03-31price $180,000
-
2026-02-10$192,500 Active
-
2022-05-10soldstatus $185,000
-
2022-05-10soldstatus $185,000
-
2022-05-06soldstatus $185,000 Sold 336-char remark
Show marketing remark (336 chars)
Welcome home!! This cozy three bedroom home is waiting for its new owners! Come see all this home has to offer, including beautiful wood flooring throughout, fresh paint, eye catching backsplash, three large bedrooms, one and half baths, huge yard, beautiful landscaping, walking distance to schools, shopping, dining, and so much more.
-
2022-04-05status Pending 336-char remark
Show marketing remark (336 chars)
Welcome home!! This cozy three bedroom home is waiting for its new owners! Come see all this home has to offer, including beautiful wood flooring throughout, fresh paint, eye catching backsplash, three large bedrooms, one and half baths, huge yard, beautiful landscaping, walking distance to schools, shopping, dining, and so much more.
-
2022-03-31$174,500 Active 336-char remark
Show marketing remark (336 chars)
Welcome home!! This cozy three bedroom home is waiting for its new owners! Come see all this home has to offer, including beautiful wood flooring throughout, fresh paint, eye catching backsplash, three large bedrooms, one and half baths, huge yard, beautiful landscaping, walking distance to schools, shopping, dining, and so much more.
-
2013-07-02soldstatus $90,000
ⓘ Source: listings_history table (triggers on properties + properties_extension) + one-shot
backfill from property_details.listing_events for pre-trigger history.
Tax reassessment forecast OK · Resets to sale price
- Current annual tax
- $2,418 · $201/mo
- Projected year-2 tax
- $2,418 · $201/mo
- Expected delta
- $0/yr ($0/mo · 0.0%)
ⓘ Screening estimate from a state-policy table — verify with the county assessor before closing.
Climate risk First Street
- Flood 1/10 Low FEMA zone X (unshaded) · 0% chance over 30 yrs
- Wildfire 1/10 Low
- Heat 6/10 Major 7 d/yr ≥108°F today · 19 d/yr by 30 yrs out
- Wind 2/10 Low 3% chance of damaging wind over 30 yrs
- Air quality 2/10 Low 2 unhealthy d/yr today · 2 by 30 yrs out
Nearby sold comps map
Loading sold comps map…
Walkable amenities ~0.75 mi
Loading nearby amenities…
Taxation est. · year 1
- Rental income
- $18,412
- − Mortgage interest
- −$10,083
- − Property taxes
- −$2,418
- − Insurance
- −$900
- − Repairs & maintenance
- −$1,473
- − Management
- −$1,473
- − Depreciation
- −$5,236
- Taxable loss
- −$3,171
- Est. tax savings @ 24.0%
- +$761
- After-tax cash flow
- $661/yr
For passive investors: Depreciation is non-cash, so a rental often shows a tax loss while cash-flowing — sheltering income. Rental losses are passive: they offset passive income freely, and up to $25,000/yr can offset ordinary (W-2) income if you actively participate and your MAGI is under $100k (phasing out to $0 by $150k); unused losses carry forward. On sale, claimed depreciation is recaptured at up to 25%, and gains may owe capital-gains tax (a 1031 exchange can defer both). Figures are a year-1 estimate at your 24.0% rate — not tax advice; consult a CPA.
Schools (NCES district)
- District
- Edmond
- NCES district ID
- 4010590
- Math proficiency
- 38% ▼ -12.00%
- Reading proficiency
- 40% ▼ -12.00%
- Median HH income
- $73,212
- Composite
- 35.88/100
- National rank
- #4814
- State rank
- #11 of 270 in OK
Livability — Edmond
- Score
- 78/100
- State rank
- #6
- US rank
- #2383
Category grades
Schools grade is shown separately in the Schools card above.
Census & demographics
- Census place
- Edmond, OK
- County
- Oklahoma County · 771,644 people
- City population
- 177,083
- Metro
- Oklahoma City, OK
- Population (ZIP)
- 58,023
- Household income
- $113,870
- Rent vs Own
- Severe rent burden
- 1313.0
Population outlook (Oklahoma County) Hauer SSP2
- Today (2025)
- 911,875 people
- By 2030
- 982,413 · +7.7%
- By 2040
- 1,130,468 · +24.0%
- By 2050
- 1,288,422 · +41.3%
- By 2075
- 1,711,482 · +87.7%
- By 2100
- 2,088,448 · +129.0%
Race, ethnicity, and origin ACS 2023
- Neighborhood character
- Predominantly White (67%)
- Race & ethnicity
- White 67% Two or more races 11% Black 9% Asian 7% Hispanic / Latino 5% Native American 2%
- Hispanic origin (detail)
- Mexican 2%
- Common ancestry
- Slovak 3% Italian 2% Lithuanian 2%
- Foreign-born
- 7% · Canada, Vietnam
- Languages at home
- 91% English-only · Other Indo-European 3% Spanish 2% Vietnamese 1%
Political lean MEDSL · Oklahoma
- 2024 margin
- Toss-up / Even · D 48.0% · R 49.7% · Other 2.3%
- 2008→2024 swing
- +15.1pp toward D · 2008: -16.8pp · 2024: -1.7pp
- All cycles
- 2024: R+1.7 2020: R+1.1 2016: R+10.5 2012: R+16.7 2008: R+16.8
Not yet ingested
- Civics
- —
Market trends
- HPI YoY
- ▼ -201.41%
- Current HPI
- 214.2251
- Rent YoY
- ▲ 3.14%
- Metro
- Oklahoma City, OK
- State GDP YoY
- ▲ 1.55%
- F500 in state
- 6
Industry mix (Fortune 500 HQ in OK)
| Industry | F500 HQs | Revenue |
|---|---|---|
| Energy | 3 | $48B |
|
||
Price history
+100.0% since first listed9 events — show timeline
- 2026-05-13 Pending — MLSOK
- 2026-03-31 Price Changed $180,000 MLSOK
- 2026-02-10 Listed $192,500 MLSOK
- 2022-05-10 Sold (Public Records) $185,000 Public Records
- 2022-05-10 Sold (Public Records) $185,000 Public Records
- 2022-05-06 Sold (MLS) $185,000 MLSOK
- 2022-04-05 Pending — MLSOK
- 2022-03-31 Listed $174,500 MLSOK
- 2013-07-02 Sold (Public Records) $90,000 Public Records
Property tax history
+7.5%/yrLatest (2025): $2,418 · +4.6% YoY. Source: county tax records.
Cash-flow waterfall
monthlySold comps — $/sqft
last 12 mo · ≤1 miLoading sold comps…