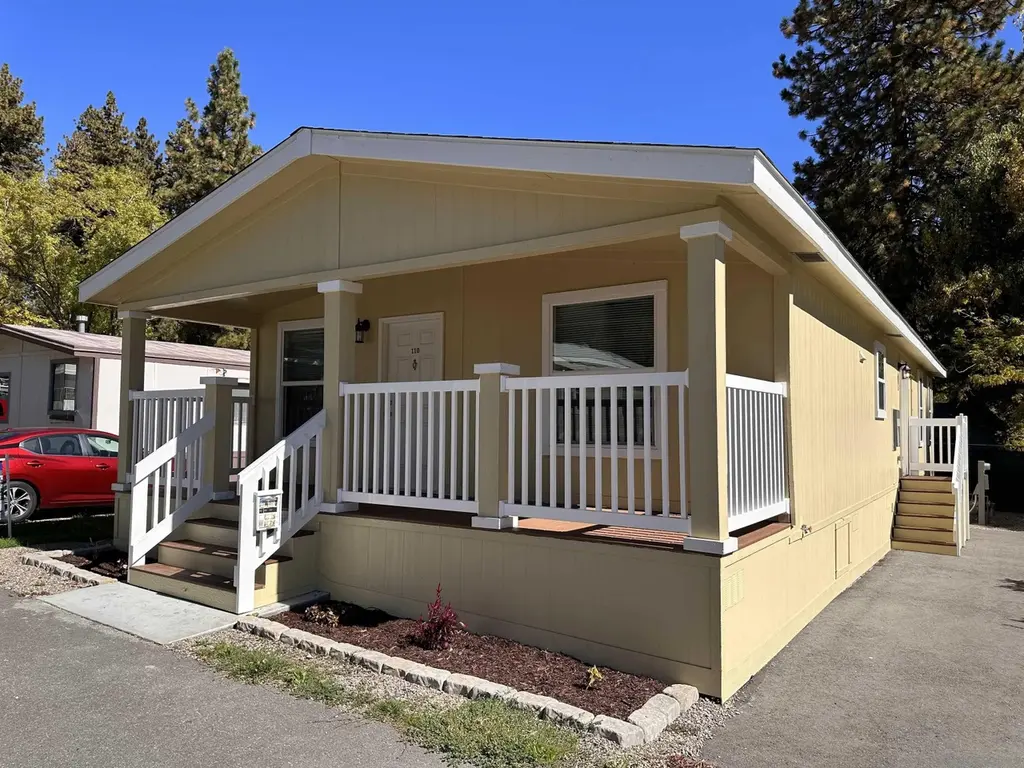
22899 Byron Rd #110 · Crestline, CA
Flood risk 4/10 · Minor
- FEMA flood zone
- A
- Chance of flooding over 30 yrs
- 0.21%
- Est. flood insurance / yr
- $1,009 – $1,996
Fire risk 8/10 · Major
- Est. fire insurance / yr
- $659 – $1,223
Heat risk 4/10 · Minor
- Hot days now (above 89°F)
- 3 days/yr
- Hot days in 30 yrs
- 8 days/yr
Wind risk 1/10 · Minimal
- Chance of severe wind over 30 yrs
- —
Air-quality risk 10/10 · Severe
- Unhealthy air days now
- 31 days/yr
- Unhealthy air days in 30 yrs
- 41 days/yr
Risk factors via First Street. Map © Google.
Why this score? — see what drove the B- grade
The composite is a weighted blend of 9 inputs, each scored 0–100. Each bar is that input's sub-score; the figure is the points it added to the 100-point composite (weight × sub-score).
- Cash flow +29.7/30.0
- DSCR +10.0/10.0
- 1% rule +8.3/10.0
- ARV discount +7.5/15.0
- Condition / age +4.8/5.0
- Rent growth +3.7/5.0
- Livability +2.8/5.0
- Schools +2.1/10.0
- Appreciation +0.0/10.0
$162,900
🖨 Deal sheet 📄 Offer letter ✓ Due diligence
Listing remarks MLS
This stunning newly built 3-bedroom, 2-bath manufactured home in the sought-after Valley of Enchantment family park offers the perfect blend of modern design and mountain charm. Built with durable 2x4 construction and a 60 lb. roof load for snow, it provides lasting quality and peace of mind. Large windows fill the home with natural light, complementing the bright, open layout with vinyl sheet flooring and cozy carpeted bedrooms. The spacious kitchen features modern appliances and ample storage, opening to a welcoming dining area ideal for family gatherings. The primary bedroom includes a private ensuite with a shower and bathtub for added comfort. With stylish finishes and thoughtful design, this home is a fantastic starter for families or first-time buyers seeking quality and value. Monthly space rent $1049.
Key facts
- Large windows
- Manufactured home
- Durable construction
Tags
Neighborhood map
What this means for you Summary
Snapshot
- This is a 3-bed/2.0-bath manufactured listed at $163k. Condition is rated excellent.
Deal economics
- At list price, monthly cash flow is $466 ($6k/yr) — positive.
- The deal already cash-flows at list — no discount required.
- Meets the 1% rule at list price ($2k rent vs $163k).
- Recommended offer: $143k (12.0% below list) — sets the bar for market timing.
- Cap rate 10.6% vs local median 3.9% in Crestline — top-decile yield for the area; either an underpriced asset or a hidden risk that comps aren't pricing in. Stress-test before assuming the spread holds.
Location & tenants
- Location reads 56/100 on livability (#805 in CA) — a working-class tenant base; expect higher turnover. Strengths: housing A+; Watch: commute D, schools D-, crime F.
- Rim Of The World Unified (town): math 13% / reading 34% proficiency, ranked #415 of 517 in CA (top 80%) — low school quality limits family demand, transient renter base, plan for 1-2y turnover.
- Market conditions: Rents rising fast (+4.7%/yr); 252 active listings in the ZIP; 10 comparable units currently listed for rent nearby; rentals at typical pace (median 17d on market — plan ~3-4 weeks tenant-placement turnaround); 5,458 units permitted in San Bernardino County in 2024 (1,500 in 5+ unit buildings).
- This rent runs 37% of the median local income ($71k/yr) — at the standard rent-burdened threshold; future hikes will face affordability resistance.
Forward outlook
- Local home prices are declining (-3.0%/yr); year-one equity from $1k of loan paydown is wiped out by about $5k of value loss. Plan a longer hold.
- San Bernardino County population projected at +15% by 2050 — modest demand growth; plan on rents tracking national, not racing it.
- At projected returns (-3.0% appreciation + 4.7% rent growth), your $46k cash investment doubles in ~8 years — after that, you're playing with house money.
Negotiation context
- It's been on market 252 days — a 12% lower offer ($143k) is reasonable based on typical stale-listing flexibility.
- 2 sale attempts since 3y ago; this cycle's ask has dropped $12k (7%) from the opening price — seller is motivated, your offer sets the floor, not the list.
Risks & watch-outs
- Watch-outs: flood insurance adds $125/mo.
- Climate carrying-cost: in FEMA flood zone A (mandatory federal flood insurance); severe wildfire risk — expect insurance premiums to compound above CPI over the hold.
Questions for the listing agent
- It's been on market 252 days. Have you received any prior offers? Is the seller open to a 12% concession, seller financing, or rate buy-down credit?
- What's the actual annual flood-insurance premium (NFIP or private), and is the property in a SFHA with mandatory coverage?
- Why hasn't it sold? Are there any deal-killer items the seller is aware of (foundation, flood, title, zoning, code violations)?
- Is there a deadline driving the sale (1031 exchange, divorce, estate, relocation)? That informs how much negotiation room exists.
- Schools are D-rated, which usually means shorter tenancies and higher turnover. Who's the typical renter profile here, and what's been the actual vacancy rate?
- Crime grade is F in this area — have there been break-ins, vandalism, or insurance claims at this property in the last 3 years? What carrier currently insures it and at what premium?
- What's the average days-on-market for RENTAL listings here right now (not sales)? A rising rental-DOM trend means longer vacancies and softer asking-rent achievability than the comps imply.
- What's the recent tenant-quality profile in this submarket — average credit score on applications, eviction rate, late-payment / NSF rate, and stable-employment percentage? A property-management company in the area should have these aggregated.
- How much new for-sale + rental construction is in the pipeline within 1–3 miles? Heavy new supply typically softens prices + rents 12–24 months out; constrained supply supports both.
Investment metrics
- 1% rule
- 1.33% ✓
- Cap rate
- 10.65%
- Cash-on-cash
- 15.56%
- DSCR
- 1.69
- GRM
- 6.2
CMA / ARV
- ARV (median comp)
- $92,500
- List price
- $162,900
- Delta
- 76.11%
- Verdict
- OVERPRICED
- Comps
- 4 within 1.0 mi
Show comp detail 3 sales within ~0.75 mi
| Address | Dist | Beds/Ba | Sqft | Sold | Price | $/sf | Match |
|---|---|---|---|---|---|---|---|
| 22899 Byron Rd #19 | 0.18mi | 3/1.0 | 1,064 (-11%) | 4mo | $65,000 | $61 | 66 |
| 22899 Byron Rd #65 | 0.18mi | 2/2.0 (-1) | 1,344 (+12%) | 21mo | $90,000 | $67 | 49 |
| 22899 Byron Rd #105 | 0.18mi | 2/2.0 (-1) | 1,040 (-13%) | 22mo | $133,900 | $129 | 46 |
Match score weights: distance 35% · size 25% · config 20% · recency 20%. Top-matched comps best support the ARV.
Projected returns pro-forma
-3.0% appreciation · 4.65% rent growth · sell at horizon
- IRR
- 3.9%
- Equity multiple
- 1.15×
- Total profit
- $7,066
- Equity at exit
- $24,289
- IRR
- 15.1%
- Equity multiple
- 2.32×
- Total profit
- $60,389
- Equity at exit
- $14,085
Cash invested: $45,612 (down + closing). Projections, not guarantees.
Landlord ↔ Tenant lean methodology
- Overall (STATE)
- 18 Strongly Tenant-Friendly
- State California
- 18 Strongly Tenant-Friendly · D+13
- County
- — inherits STATE
- City
- — inherits STATE
ZIP-level market 92325
- Rents YoY
- 4.7%
- Active inventory
- 252
- Price-to-rent
- 6.2×
Monthly cashflow live
- Estimated rent
- $2,174 high interval (Pro) →
- Mortgage (P&I)
- −$854
- Tax est. 1.5%
- −$204 /mo · $2,444/yr
- Insurance
- −$68
- Flood insurance flood zone
- −$125 /mo · $1,502/yr
- HOA
- −$0
- Vacancy / Maint / Mgmt
- −$456
- Net cashflow
- $466
Break-even live
UW: 25.0% down · 7.5% · 30yr · 1.5% tax · 5.0% vac · 8.0% maint · 8.0% mgmt
Financing live
Cash to close
- Down payment
- $40,725
- Closing costs
- $4,887
- Reserves months
- —
- Total cash needed
- —
Loan-product check · same deal, 3 products live
Conventional
25% down · 7.5% · 30yr
- Down + closing
- —
- Monthly P&I
- —
- Monthly cashflow
- —
- DSCR
- —
- Eligible?
- —
Personal DTI + credit; lowest rate.
DSCR
20% down · 8.5% · 30yr
- Down + closing
- —
- Monthly P&I
- —
- Monthly cashflow
- —
- DSCR
- —
- Eligible?
- —
No personal income docs; deal must DSCR.
Hard money
10% down · 12.0% · 12mo
- Down + closing
- —
- Monthly P&I
- —
- Monthly cashflow
- —
- DSCR
- —
- Eligible?
- —
Short-term bridge; refi at stabilization.
Rent comps 10 comps
| Address | Beds | Baths | Sqft | Rent | $/sqft | DOM | Units | Dist |
|---|---|---|---|---|---|---|---|---|
| 22858 Lupin Ln Cedarpines Park, CA | 3.0 | 2.0 | 1176 | $2,000 | $1.70 | 1d | 1 | 0.20mi |
| 686 Ca-138 Crestline, CA | 2.0 | 1.0 | 720 | $1,800 | $2.50 | 3d | 1 | 0.83mi |
| 767 Woodland Rd Unit 1 Crestline, CA | 2.0 | 1.0 | 1100 | $1,700 | $1.55 | 2d | 1 | 0.87mi |
| 794 Woodland Rd Crestline, CA | 3.0 | 2.0 | 1372 | $1,400 | $1.02 | 17d | 1 | 0.95mi |
| 23654 Lake Dr Crestline, CA | 2.0 | 1.0 | 720 | $1,995 | $2.77 | 1d | 1 | 1.05mi |
| 23855 Zuger Dr Unit B Crestline, CA | 3.0 | 1.0 | 1300 | $1,995 | $1.53 | 19d | 1 | 1.24mi |
| 23882 Springwater Rd Crestline, CA | 3.0 | 1.0 | 1133 | $2,500 | $2.21 | 19d | 1 | 1.29mi |
| 198 Mile High Rd Crestline, CA | 3.0 | 2.5 | 850 | $2,300 | $2.71 | 1d | 1 | 1.33mi |
| 979 Venus Way Crestline, CA | 2.0 | 2.0 | 800 | $2,500 | $3.12 | 21d | 1 | 1.36mi |
| 23920 Scenic Dr Crestline, CA | 2.0 | 1.0 | 770 | $1,795 | $2.33 | 24d | 1 | 1.49mi |
Listing history 20 events
-
2026-06-18days on market $162,900 Active 252 DOM
-
2026-06-17days on market $162,900 Active 251 DOM
-
2026-06-16days on market $162,900 Active 250 DOM
-
2026-06-15days on market $162,900 Active 249 DOM
-
2026-06-13days on market $162,900 Active 247 DOM
-
2026-06-13days on market $162,900 Active 246 DOM
-
2026-06-09days on market $162,900 Active 243 DOM
-
2026-06-08days on market $162,900 Active 242 DOM
-
2026-06-07days on market $162,900 Active 241 DOM
-
2026-06-04days on market $162,900 Active 238 DOM
-
2026-06-03days on market $162,900 Active 237 DOM
-
2026-06-02days on market $162,900 Active 236 DOM
-
2026-06-01days on market $162,900 Active 235 DOM
-
2026-05-31days on market $162,900 Active 234 DOM
-
2026-04-07price $162,900 821-char remark
Show marketing remark (821 chars)
This stunning newly built 3-bedroom, 2-bath manufactured home in the sought-after Valley of Enchantment family park offers the perfect blend of modern design and mountain charm. Built with durable 2x4 construction and a 60 lb. roof load for snow, it provides lasting quality and peace of mind. Large windows fill the home with natural light, complementing the bright, open layout with vinyl sheet flooring and cozy carpeted bedrooms. The spacious kitchen features modern appliances and ample storage, opening to a welcoming dining area ideal for family gatherings. The primary bedroom includes a private ensuite with a shower and bathtub for added comfort. With stylish finishes and thoughtful design, this home is a fantastic starter for families or first-time buyers seeking quality and value. Monthly space rent $1049.
-
2025-10-09$174,900 Active 821-char remark
Show marketing remark (821 chars)
This stunning newly built 3-bedroom, 2-bath manufactured home in the sought-after Valley of Enchantment family park offers the perfect blend of modern design and mountain charm. Built with durable 2x4 construction and a 60 lb. roof load for snow, it provides lasting quality and peace of mind. Large windows fill the home with natural light, complementing the bright, open layout with vinyl sheet flooring and cozy carpeted bedrooms. The spacious kitchen features modern appliances and ample storage, opening to a welcoming dining area ideal for family gatherings. The primary bedroom includes a private ensuite with a shower and bathtub for added comfort. With stylish finishes and thoughtful design, this home is a fantastic starter for families or first-time buyers seeking quality and value. Monthly space rent $1049.
-
2025-03-04historical
-
2024-06-06price $179,900
-
2023-10-24price $185,900
-
2023-10-17$199,900 Active
ⓘ Source: listings_history table (triggers on properties + properties_extension) + one-shot
backfill from property_details.listing_events for pre-trigger history.
Climate risk First Street
- Flood 4/10 Moderate FEMA zone A · 21% chance over 30 yrs
- Wildfire 8/10 Severe
- Heat 4/10 Moderate 3 d/yr ≥89°F today · 8 d/yr by 30 yrs out
- Wind 1/10 Low
- Air quality 10/10 Extreme 31 unhealthy d/yr today · 41 by 30 yrs out
Nearby sold comps map
Loading sold comps map…
Walkable amenities ~0.75 mi
Loading nearby amenities…
Taxation est. · year 1
- Rental income
- $26,082
- − Mortgage interest
- −$9,125
- − Property taxes
- −$2,444
- − Insurance
- −$2,317
- − Repairs & maintenance
- −$2,087
- − Management
- −$2,087
- − Depreciation
- −$4,739
- Taxable income
- $3,285
- Est. tax owed @ 24.0%
- −$788
- After-tax cash flow
- $4,805/yr
For passive investors: Depreciation is non-cash, so a rental often shows a tax loss while cash-flowing — sheltering income. Rental losses are passive: they offset passive income freely, and up to $25,000/yr can offset ordinary (W-2) income if you actively participate and your MAGI is under $100k (phasing out to $0 by $150k); unused losses carry forward. On sale, claimed depreciation is recaptured at up to 25%, and gains may owe capital-gains tax (a 1031 exchange can defer both). Figures are a year-1 estimate at your 24.0% rate — not tax advice; consult a CPA.
Condition & rehab AI · 1 photo
This brand-new 3-bedroom, 2-bath manufactured home in the Valley of Enchantment family park is in excellent condition with no visible repairs needed. It offers modern comfort and mountain charm, making it an ideal investment for both resale and rental.
Value-add opportunities
- Both Landscaping improvements — Enhances curb appeal and adds value for both resale and rental.
- Both Painting exterior and interior — Fresh paint can make the home look newer and more appealing to potential buyers or renters.
Renovation cost estimate screening
Value-add ROI direction
- Both Landscaping improvements — Enhances curb appeal and adds value for both resale and rental. ↑
- Both Painting exterior and interior — Fresh paint can make the home look newer and more appealing to potential buyers or renters. ↑
ⓘ Cost ranges are severity-bucket heuristics (US national rule-of-thumb). Get contractor quotes + a written scope before underwriting a rehab budget.
Schools (NCES district)
- District
- Rim Of The World Unified
- NCES district ID
- 0632610
- Math proficiency
- 13% ▼ -10.00%
- Reading proficiency
- 34% ▼ -7.00%
- Median HH income
- $55,860
- Composite
- 21.29/100
- National rank
- #8389
- State rank
- #415 of 517 in CA
Livability — Crestline
- Score
- 56/100
- State rank
- #805
- US rank
- #22821
Category grades
Schools grade is shown separately in the Schools card above.
Census & demographics
- Census place
- Crestline, CA
- County
- San Bernardino County · 2,030,291 people
- City population
- 9,065
- Metro
- Riverside-San Bernardino-Ontario, CA
- Population (ZIP)
- 9,065
- Household income
- $70,563
- Rent vs Own
- Severe rent burden
- 179.0
Population outlook (San Bernardino County) Hauer SSP2
- Today (2025)
- 2,300,329 people
- By 2030
- 2,378,907 · +3.4%
- By 2040
- 2,523,137 · +9.7%
- By 2050
- 2,642,388 · +14.9%
- By 2075
- 2,880,769 · +25.2%
- By 2100
- 2,909,436 · +26.5%
Race, ethnicity, and origin ACS 2023
- Neighborhood character
- Predominantly White (68%)
- Race & ethnicity
- White 68% Hispanic / Latino 25% Two or more races 20% Black 2%
- Hispanic origin (detail)
- Mexican 21%
- Common ancestry
- Romanian 5% Slovak 5% Lithuanian 4%
- Foreign-born
- 9% · Canada
- Languages at home
- 85% English-only · Spanish 12% Russian/Polish/Slavic 3% German/W. Germanic 1%
Political lean MEDSL · San Bernardino
- 2024 margin
- Toss-up / Even · D 47.5% · R 49.7% · Other 2.8%
- 2008→2024 swing
- -8.5pp toward R · 2008: 6.3pp · 2024: -2.1pp
- All cycles
- 2024: R+2.1 2020: D+10.7 2016: D+9.8 2012: D+5.4 2008: D+6.3
Not yet ingested
- Civics
- —
Market trends
- HPI YoY
- ▼ -255.88%
- Current HPI
- 352.6512
- Rent YoY
- ▲ 4.65%
- Metro
- Riverside-San Bernardino-Ontario, CA
- State GDP YoY
- ▲ 3.21%
- F500 in state
- 116
Industry mix (Fortune 500 HQ in CA)
| Industry | F500 HQs | Revenue |
|---|---|---|
| Technology | 27 | $1,492B |
|
||
| Financial Services | 3 | $174B |
|
||
| Retail | 3 | $44B |
|
||
| Insurance | 3 | $26B |
|
||
| Media / Entertainment | 2 | $115B |
|
||
| Pharmaceuticals / Biotech | 2 | $62B |
|
||
Price history
-18.5% since first listed6 events — show timeline
- 2026-04-07 Price Changed $162,900 SDMLS
- 2025-10-09 Listed $174,900 SDMLS
- 2025-03-04 Listing Removed — SDMLS
- 2024-06-06 Price Changed $179,900 SDMLS
- 2023-10-24 Price Changed $185,900 SDMLS
- 2023-10-17 Listed $199,900 SDMLS
Cash-flow waterfall
monthlySold comps — $/sqft
last 12 mo · ≤1 miLoading sold comps…