231 Cherry Rd · Jefferson Valley-Yorktown, NY
Flood risk 1/10 · Minimal
- FEMA flood zone
- X (unshaded)
- Chance of flooding over 30 yrs
- 0.0%
- Est. flood insurance / yr
- $507 – $1,088
Fire risk 3/10 · Minor
- Est. fire insurance / yr
- $691 – $1,283
Heat risk 5/10 · Moderate
- Hot days now (above 98°F)
- 7 days/yr
- Hot days in 30 yrs
- 15 days/yr
Wind risk 4/10 · Minor
- Chance of severe wind over 30 yrs
- 23.0%
Air-quality risk 3/10 · Minor
- Unhealthy air days now
- 2 days/yr
- Unhealthy air days in 30 yrs
- 5 days/yr
Risk factors via First Street. Map © Google.
Why this score? — see what drove the C- grade
The composite is a weighted blend of 9 inputs, each scored 0–100. Each bar is that input's sub-score; the figure is the points it added to the 100-point composite (weight × sub-score).
- ARV discount +15.0/15.0
- Cash flow +14.9/30.0
- Schools +6.6/10.0
- DSCR +4.5/10.0
- 1% rule +4.0/10.0
- Rent growth +2.5/5.0
- Livability +2.5/5.0
- Condition / age +2.5/5.0
- Appreciation +0.0/10.0
$310,000
🖨 Deal sheet 📄 Offer letter ✓ Due diligence
Listing remarks
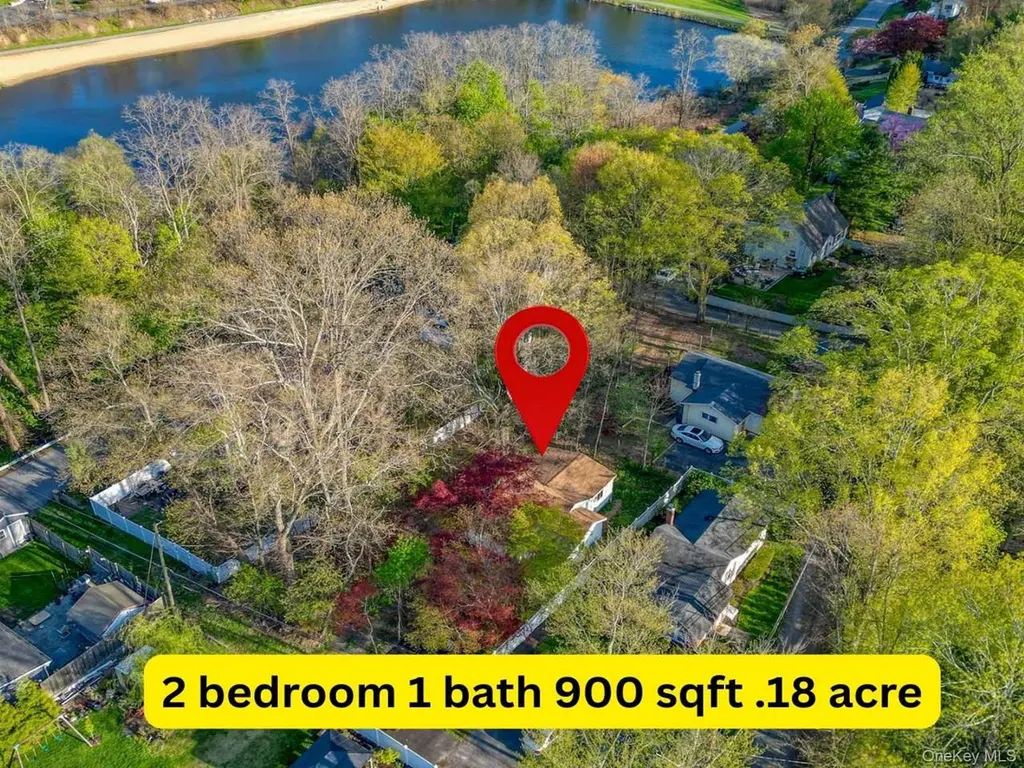
In Yorktown Heights, there is a charming 2-bedroom, 1-bath cottage-style home offering approximately 900 square feet on a . 18-acre lot. This rare opportunity is ideal for investors, renovators, contractors, or buyers looking to reimagine a home with character and potential. The roof is 2 years with architectural shingles. Windows are 1 year old, brand new boiler and brand new electric hot water heater, 30 gallon, (both not connected but in the home). Baseboard and town water and sewer. Laminate flooring going over existing floor is in process. The property features two separate entrances, with access from both Cherry Road and Kent Lane, offering added flexibility and convenience. The lot
Key facts
- Cottage-style home
- 8,119 sq ft lot
- Built 1930
Tags
Property features AI
Exterior
- Parking: Driveway; Off-street parking
- Utilities: Public sewer; Electricity connected
- Home design: Single-family residence; Living area reported from public records
- Construction: Frame construction
- Exterior features: Frame construction; Not waterfront
Interior
- Kitchen: Refrigerator included
- Bedrooms: 3 rooms total (includes bedrooms and living areas)
- Bathrooms: 1 full bathroom
- Heating & cooling: Baseboard heating; Wall/window air conditioning units
- Interior features: First-floor bedroom; First-floor full bathroom; Deck
- Laundry & utility: No basement
Neighborhood map
What this means for you Summary
Snapshot
- This is a 2-bed/1.0-bath other listed at $310k.
Deal economics
- At list price, monthly cash flow is $89 ($1k/yr) — positive.
- The deal already cash-flows at list — no discount required.
- To meet the 1% rule (rent ≥ 1% of price), the offer needs to be $278k (10.2% below list).
- Recommended offer: $278k (10.2% below list) — sets the bar for 1% rule.
- Cap rate 6.6% vs local median 2.8% in Jefferson Valley-Yorktown — top-decile yield for the area; either an underpriced asset or a hidden risk that comps aren't pricing in. Stress-test before assuming the spread holds.
Location & tenants
- Location reads: area grade C — affects rentability + tenant quality, not the cash-flow math above.
- Yorktown Central School District (rural): math 67% / reading 73% proficiency, ranked #83 of 590 in NY (top 14%) — strong family-tenant draw, lease renewals of 3-5y typical; only 5% free/reduced lunch — higher-income household profile.
- Zoned schools: Brookside School (math 77% / reading 92%, grade A+, #93 of 2,108 statewide, top 6%, 519 students, 10% FRL); Mildred E Strang Middle School (math 52% / reading 73%, grade B+, #133 of 729 statewide, top 18%, 794 students, 14% FRL); Yorktown High School (math 100% / reading 84%, grade A+, #171 of 1,100 statewide, top 18%, 1,104 students, 14% FRL).
- Market conditions: 160 active listings in the ZIP; 954 units permitted in Westchester County in 2024 (649 in 5+ unit buildings).
Forward outlook
- Local home prices are declining (-3.0%/yr); year-one equity from $2k of loan paydown is wiped out by about $9k of value loss. Plan a longer hold.
- Westchester County population projected at +10% by 2050 — modest demand growth; plan on rents tracking national, not racing it.
Negotiation context
- It's been on market 48 days — a 3% lower offer ($301k) is reasonable based on typical stale-listing flexibility.
- 4 sale attempts since 2y ago with the ask held roughly flat each time — persistent listings suggest the price (not the market) is what's stuck; bring a comps-based counter.
Risks & watch-outs
- Watch-outs: built in 1930 — expect roof / HVAC / electrical / plumbing capex.
- Climate carrying-cost: extreme-heat days projected 7→15/yr by 2055 (HVAC capex compounding) — expect insurance premiums to compound above CPI over the hold.
Questions for the listing agent
- It's been on market 48 days. Have you received any prior offers? Is the seller open to a 10% concession, seller financing, or rate buy-down credit?
- Built in 1930 — when were the roof, HVAC, electrical panel, plumbing, and water heater last replaced?
- Is there a deadline driving the sale (1031 exchange, divorce, estate, relocation)? That informs how much negotiation room exists.
- What's the average days-on-market for RENTAL listings here right now (not sales)? A rising rental-DOM trend means longer vacancies and softer asking-rent achievability than the comps imply.
- What's the recent tenant-quality profile in this submarket — average credit score on applications, eviction rate, late-payment / NSF rate, and stable-employment percentage? A property-management company in the area should have these aggregated.
- How much new for-sale + rental construction is in the pipeline within 1–3 miles? Heavy new supply typically softens prices + rents 12–24 months out; constrained supply supports both.
Investment metrics
- 1% rule
- 0.90% ✗
- Cap rate
- 6.64%
- Cash-on-cash
- 1.23%
- DSCR
- 1.05
- GRM
- 9.3
CMA / ARV
- ARV (median comp)
- $411,435
- List price
- $310,000
- Delta
- -24.65%
- Verdict
- UNDERPRICED
- Comps
- 5 within 1.0 mi
Projected returns pro-forma
-3.0% appreciation · 3.0% rent growth · sell at horizon
- IRR
- -14.3%
- Equity multiple
- 0.49×
- Total profit
- $-44,528
- Equity at exit
- $46,222
- IRR
- -5.6%
- Equity multiple
- 0.64×
- Total profit
- $-31,366
- Equity at exit
- $26,803
Cash invested: $86,800 (down + closing). Projections, not guarantees.
Landlord ↔ Tenant lean methodology
- Overall (STATE)
- 15 Strongly Tenant-Friendly
- State New York
- 15 Strongly Tenant-Friendly · D+10
- County
- — inherits STATE
- City
- — inherits STATE
ZIP-level market 10598
- Active inventory
- 160
- Price-to-rent
- 9.3×
Monthly cashflow live
- Estimated rent
- $2,784 medium interval (Pro) →
- Mortgage (P&I)
- −$1,626
- Tax from tax record
- −$355 /mo · $4,259/yr
- Insurance
- −$129
- HOA
- −$0
- Vacancy / Maint / Mgmt
- −$585
- Net cashflow
- $89
Break-even live
UW: 25.0% down · 7.5% · 30yr · 1.5% tax · 5.0% vac · 8.0% maint · 8.0% mgmt
Financing live
Cash to close
- Down payment
- $77,500
- Closing costs
- $9,300
- Reserves months
- —
- Total cash needed
- —
Loan-product check · same deal, 3 products live
Conventional
25% down · 7.5% · 30yr
- Down + closing
- —
- Monthly P&I
- —
- Monthly cashflow
- —
- DSCR
- —
- Eligible?
- —
Personal DTI + credit; lowest rate.
DSCR
20% down · 8.5% · 30yr
- Down + closing
- —
- Monthly P&I
- —
- Monthly cashflow
- —
- DSCR
- —
- Eligible?
- —
No personal income docs; deal must DSCR.
Hard money
10% down · 12.0% · 12mo
- Down + closing
- —
- Monthly P&I
- —
- Monthly cashflow
- —
- DSCR
- —
- Eligible?
- —
Short-term bridge; refi at stabilization.
Listing history 17 events
-
2026-06-13statusdays on market $310,000 Pending 48 DOM
-
2026-06-09days on market $310,000 Active 46 DOM
-
2026-06-08days on market $310,000 Active 45 DOM
-
2026-06-07days on market $310,000 Active 44 DOM
-
2026-06-04days on market $310,000 Active 41 DOM
-
2026-06-03days on market $310,000 Active 40 DOM
-
2026-06-02days on market $310,000 Active 39 DOM
-
2026-06-01days on market $310,000 Active 38 DOM
-
2026-05-31days on market $310,000 Active 37 DOM
-
2026-04-24$310,000 Active 1052-char remark
-
2025-09-02$299,999 Active
-
2025-04-03historical
-
2024-11-04price $299,000
-
2024-10-12$300,000 Active
-
2024-10-10historical
-
2024-08-31$200,000 Active
-
2024-08-27historical
ⓘ Source: listings_history table (triggers on properties + properties_extension) + one-shot
backfill from property_details.listing_events for pre-trigger history.
Tax reassessment forecast NY · Partial reset (capped growth)
- Current annual tax
- $4,259 · $355/mo
- Projected year-2 tax
- $4,749 · $396/mo
- Expected delta
- +$490/yr (+$41/mo · 11.5%)
ⓘ Screening estimate from a state-policy table — verify with the county assessor before closing.
Climate risk First Street
- Flood 1/10 Low FEMA zone X (unshaded) · 0% chance over 30 yrs
- Wildfire 3/10 Moderate
- Heat 5/10 Major 7 d/yr ≥98°F today · 15 d/yr by 30 yrs out
- Wind 4/10 Moderate 23% chance of damaging wind over 30 yrs
- Air quality 3/10 Moderate 2 unhealthy d/yr today · 5 by 30 yrs out
Nearby sold comps map
Loading sold comps map…
Walkable amenities ~0.75 mi
Loading nearby amenities…
Taxation est. · year 1
- Rental income
- $33,403
- − Mortgage interest
- −$17,365
- − Property taxes
- −$4,259
- − Insurance
- −$1,550
- − Repairs & maintenance
- −$2,672
- − Management
- −$2,672
- − Depreciation
- −$9,018
- Taxable loss
- −$4,134
- Est. tax savings @ 24.0%
- +$992
- After-tax cash flow
- $2,063/yr
For passive investors: Depreciation is non-cash, so a rental often shows a tax loss while cash-flowing — sheltering income. Rental losses are passive: they offset passive income freely, and up to $25,000/yr can offset ordinary (W-2) income if you actively participate and your MAGI is under $100k (phasing out to $0 by $150k); unused losses carry forward. On sale, claimed depreciation is recaptured at up to 25%, and gains may owe capital-gains tax (a 1031 exchange can defer both). Figures are a year-1 estimate at your 24.0% rate — not tax advice; consult a CPA.
Schools (NCES district)
- District
- Yorktown Central School District
- NCES district ID
- 3631980
- Math proficiency
- 67% ▼ -4.00%
- Reading proficiency
- 73% ▲ 7.00%
- Median HH income
- $117,838
- Composite
- 65.83/100
- National rank
- #454
- State rank
- #83 of 590 in NY
Livability — Jefferson Valley-Yorktown
No livability data for this city. (Only ~50 U.S. cities are tracked.)
Census & demographics
- Census place
- Jefferson Valley-Yorktown, NY
- City population
- 323
- Population (ZIP)
- 28,894
Population outlook (Westchester County) Hauer SSP2
- Today (2025)
- 1,028,035 people
- By 2030
- 1,051,636 · +2.3%
- By 2040
- 1,098,520 · +6.9%
- By 2050
- 1,136,044 · +10.5%
- By 2075
- 1,196,925 · +16.4%
- By 2100
- 1,175,147 · +14.3%
Race, ethnicity, and origin ACS 2023
- Neighborhood character
- Predominantly White (74%)
- Race & ethnicity
- White 74% Hispanic / Latino 14% Two or more races 7% Black 5% Asian 4%
- Hispanic origin (detail)
- Puerto Rican 6% Dominican 2%
- Common ancestry
- Romanian 5% Scotch-Irish 2% Slovak 2%
- Foreign-born
- 12% · Canada, Jamaica, China
- Languages at home
- 82% English-only · Spanish 8% Other Indo-European 5% Other Asian/Pacific 1%
Political lean MEDSL · Westchester
- 2024 margin
- Strong D (+26.3) · D 63.1% · R 36.9%
- 2008→2024 swing
- -1.3pp toward R · 2008: 27.6pp · 2024: 26.3pp
- All cycles
- 2024: D+26.3 2020: D+36.3 2016: D+32.8 2012: D+22.2 2008: D+27.6
Not yet ingested
- Civics
- —
Market trends
- HPI YoY
- ▼ -580.71%
- Current HPI
- 248.9112
- Rent YoY
- —
- Metro
- —
- State GDP YoY
- ▲ 2.60%
- F500 in state
- 92
Industry mix (Fortune 500 HQ in NY)
| Industry | F500 HQs | Revenue |
|---|---|---|
| Financial Services | 10 | $950B |
|
||
| Consumer Goods | 9 | $162B |
|
||
| Insurance | 4 | $225B |
|
||
| Telecommunications | 2 | $144B |
|
||
| Pharmaceuticals | 2 | $112B |
|
||
| Media / Entertainment | 2 | $69B |
|
||
Price history
+55.0% since first listed9 events — show timeline
- 2026-06-11 Pending — OneKey® MLS as Distributed by MLS Grid
- 2026-04-24 Listed $310,000 OneKey® MLS as Distributed by MLS Grid
- 2025-09-02 Listed $299,999 OneKey® MLS as Distributed by MLS Grid
- 2025-04-03 Listing Removed — OneKey® MLS as Distributed by MLS Grid
- 2024-11-04 Price Changed $299,000 OneKey® MLS as Distributed by MLS Grid
- 2024-10-12 Listed $300,000 OneKey® MLS as Distributed by MLS Grid
- 2024-10-10 Coming Soon — OneKey® MLS as Distributed by MLS Grid
- 2024-08-31 Listed $200,000 OneKey® MLS as Distributed by MLS Grid
- 2024-08-27 Coming Soon — OneKey® MLS as Distributed by MLS Grid
Property tax history
+2.0%/yrLatest (2025): $4,259 · +2.0% YoY. Source: county tax records.
Cash-flow waterfall
monthlySold comps — $/sqft
last 12 mo · ≤1 miLoading sold comps…