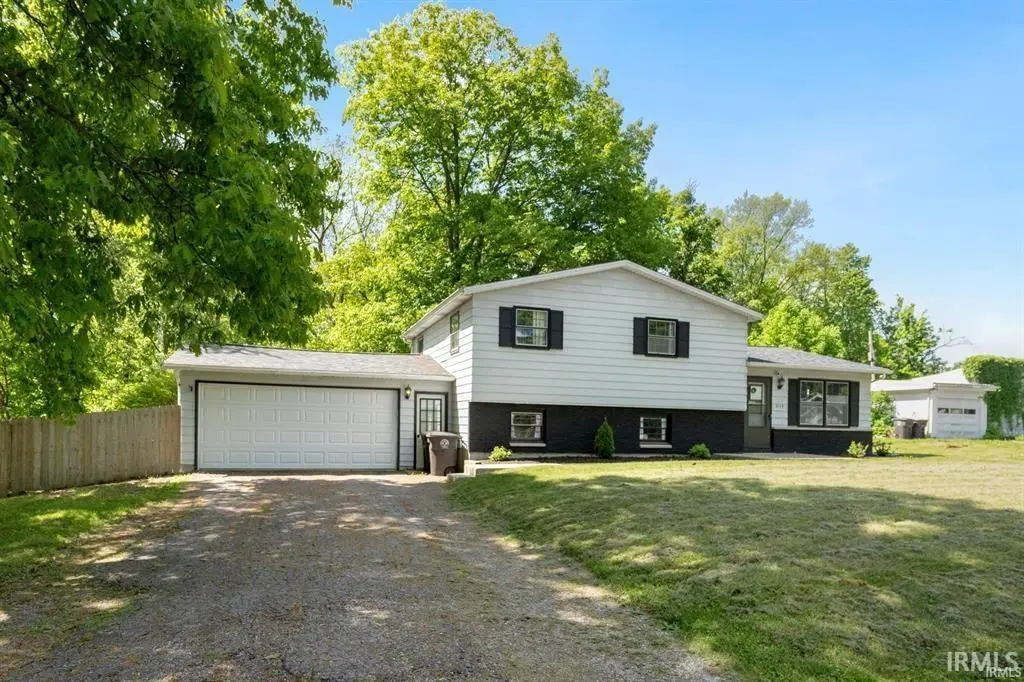
2115 Graham Dr · Fort Wayne, IN
Flood risk 1/10 · Minimal
- FEMA flood zone
- X (unshaded)
- Chance of flooding over 30 yrs
- 0.0%
- Est. flood insurance / yr
- $507 – $1,088
Fire risk 1/10 · Minimal
- Est. fire insurance / yr
- $717 – $1,331
Heat risk 3/10 · Minor
- Hot days now (above 100°F)
- 7 days/yr
- Hot days in 30 yrs
- 17 days/yr
Wind risk 2/10 · Minimal
- Chance of severe wind over 30 yrs
- —
Air-quality risk 3/10 · Minor
- Unhealthy air days now
- 2 days/yr
- Unhealthy air days in 30 yrs
- 3 days/yr
Risk factors via First Street. Map © Google.
Why this score? — see what drove the C- grade
The composite is a weighted blend of 9 inputs, each scored 0–100. Each bar is that input's sub-score; the figure is the points it added to the 100-point composite (weight × sub-score).
- Cash flow +16.8/30.0
- ARV discount +15.0/15.0
- DSCR +5.2/10.0
- Rent growth +4.4/5.0
- Livability +4.2/5.0
- 1% rule +4.1/10.0
- Condition / age +2.5/5.0
- Schools +2.2/10.0
- Appreciation +0.0/10.0
$219,000
🖨 Deal sheet 📄 Offer letter ✓ Due diligence
Listing remarks MLS
LOOK AT THIS NICE 2000 ft² ~ Move in Ready ~ 4 bed/2 bath Tri-level home with huge fenced in backyard! Large lot with mature trees and patio in back. Big bedrooms. Nice Hardwood flooring. Lots of open space in the two spacious living areas. Basement recently finished. Laundry Room added. Close to shopping, dinning and easy access to I-69. Bring your family, bring your pets, Plenty of room!! Home WARRANTY included.
Key facts
- Ample natural light
- Recent updates
- Two living areas
Tags
Property features AI
Exterior
- Parking: Attached garage; 2 garage spaces; Asphalt parking
- Utilities: Public water; Public sewer
- Home design: Single family residence (site-built); Residential property
- Construction: Aluminum siding and brick exterior; Concrete perimeter foundation; Built above and below grade finished areas
- Exterior features: Wooded lot; Privacy wood fencing (full fenced); Shingle roof
Interior
- Kitchen: Dishwasher; Microwave; Refrigerator; Gas range
- Bathrooms: 2 full bathrooms
- Heating & cooling: Natural gas heating; Hot water heating; Ceiling fans; Window units and multiple cooling units
- Interior features: Ceiling fans; Built-in features; One fireplace (no fireplace features specified); Basement (partial, crawl space)
- Laundry & utility: Laundry located on lower level
Neighborhood map
What this means for you Summary
Snapshot
- This is a 3-bed/1.5-bath single-family listed at $219k.
Deal economics
- At list price, monthly cash flow is $141 ($2k/yr) — positive.
- The deal already cash-flows at list — no discount required.
- To meet the 1% rule (rent ≥ 1% of price), the offer needs to be $200k (8.6% below list).
- Recommended offer: $200k (8.6% below list) — sets the bar for 1% rule.
- Cap rate 7.1% vs local median 4.8% in Fort Wayne — top-decile yield for the area; either an underpriced asset or a hidden risk that comps aren't pricing in. Stress-test before assuming the spread holds.
Location & tenants
- Location reads 84/100 on livability (#6 in IN, #676 nationally) — a professional / high-income tenant draw. Strengths: amenities A+, commute A+, cost of living A+; Watch: crime C-, employment D+.
- Fort Wayne Community Schools (urban): math 22% / reading 29% proficiency, ranked #263 of 301 in IN (top 87%) — low school quality limits family demand, transient renter base, plan for 1-2y turnover; 60% free/reduced lunch — lower-income household profile, screen leases tightly.
- Zoned schools: Washington Center Elementary Sch (math 33% / reading 21%, grade F, #737 of 994 statewide, top 76%, 517 students, 62% FRL); Shawnee Middle School (math 11% / reading 22%, grade F, #287 of 330 statewide, top 88%, 675 students, 65% FRL); Northrop High School (math 25% / reading 62%, grade F, #191 of 369 statewide, top 52%, 2,136 students, 54% FRL) — zoned schools at 60% FRL track the district average.
- Market conditions: Rents rising fast (+7.6%/yr); 327 active listings in the ZIP; 3 comparable units currently listed for rent nearby; rentals leasing fast (median 14d on market — plan ~1-2 weeks tenant-placement turnaround); solid renter incomes; 1,861 units permitted in Allen County in 2024 (576 in 5+ unit buildings).
Forward outlook
- Local home prices are declining (-3.0%/yr); year-one equity from $2k of loan paydown is wiped out by about $7k of value loss. Plan a longer hold.
- Allen County population projected at +10% by 2050 — modest demand growth; plan on rents tracking national, not racing it.
Negotiation context
- Only 11 days on market — expect competitive offers; lowballing is unlikely to land.
- 5 sale attempts since 5y ago with the ask held roughly flat each time — persistent listings suggest the price (not the market) is what's stuck; bring a comps-based counter.
- Current owner paid $175k; 25% above their basis — modest negotiation headroom, anchor on the comps not their cost.
Questions for the listing agent
- Built in 1966 — when were the roof, HVAC, electrical panel, plumbing, and water heater last replaced?
- Is there a deadline driving the sale (1031 exchange, divorce, estate, relocation)? That informs how much negotiation room exists.
- Schools are D-rated, which usually means shorter tenancies and higher turnover. Who's the typical renter profile here, and what's been the actual vacancy rate?
- What's the average days-on-market for RENTAL listings here right now (not sales)? A rising rental-DOM trend means longer vacancies and softer asking-rent achievability than the comps imply.
- What's the recent tenant-quality profile in this submarket — average credit score on applications, eviction rate, late-payment / NSF rate, and stable-employment percentage? A property-management company in the area should have these aggregated.
- How much new for-sale + rental construction is in the pipeline within 1–3 miles? Heavy new supply typically softens prices + rents 12–24 months out; constrained supply supports both.
Investment metrics
- 1% rule
- 0.91% ✗
- Cap rate
- 7.06%
- Cash-on-cash
- 2.75%
- DSCR
- 1.12
- GRM
- 9.1
CMA / ARV
- ARV (on-the-fly)
- $278,052
- Comps found
- 5
Show comp detail 5 sales within ~0.75 mi
| Address | Dist | Beds/Ba | Sqft | Sold | Price | $/sf | Match |
|---|---|---|---|---|---|---|---|
| 1816 Wayside Dr | 0.21mi | 3/1.5 | 1,698 (-14%) | 1mo | $257,500 | $152 | 66 |
| 1823 Lima Valley Dr | 0.45mi | 3/2.0 | 1,760 (-11%) | 0mo | $235,000 | $134 | 59 |
| 1317 Ashley Ave | 0.62mi | 3/2.0 | 1,903 (-4%) | 22mo | $225,000 | $118 | 45 |
| 8109 Pepperwood Ct | 0.39mi | 4/2.0 (+1) | 1,833 (-7%) | 23mo | $258,000 | $141 | 44 |
| 1304 Garden Club Dr | 0.53mi | 3/3.5 | 2,218 (+12%) | 5mo | $320,000 | $144 | 43 |
Match score weights: distance 35% · size 25% · config 20% · recency 20%. Top-matched comps best support the ARV.
Projected returns pro-forma
-3.0% appreciation · 7.64% rent growth · sell at horizon
- IRR
- -7.1%
- Equity multiple
- 0.73×
- Total profit
- $-16,761
- Equity at exit
- $32,654
- IRR
- 7.4%
- Equity multiple
- 1.67×
- Total profit
- $41,050
- Equity at exit
- $18,935
Cash invested: $61,320 (down + closing). Projections, not guarantees.
Landlord ↔ Tenant lean methodology
- Overall (STATE)
- 90 Strongly Landlord-Friendly
- State Indiana
- 90 Strongly Landlord-Friendly · R+11
- County
- — inherits STATE
- City
- — inherits STATE
ZIP-level market 46818
- Rents YoY
- 7.6%
- Active inventory
- 327
- Price-to-rent
- 9.1×
Monthly cashflow live
- Estimated rent
- $2,001 medium interval (Pro) →
- Mortgage (P&I)
- −$1,148
- Tax from tax record
- −$200 /mo · $2,402/yr
- Insurance
- −$91
- HOA
- −$0
- Vacancy / Maint / Mgmt
- −$420
- Net cashflow
- $141
Break-even live
UW: 25.0% down · 7.5% · 30yr · 1.5% tax · 5.0% vac · 8.0% maint · 8.0% mgmt
Financing live
Cash to close
- Down payment
- $54,750
- Closing costs
- $6,570
- Reserves months
- —
- Total cash needed
- —
Loan-product check · same deal, 3 products live
Conventional
25% down · 7.5% · 30yr
- Down + closing
- —
- Monthly P&I
- —
- Monthly cashflow
- —
- DSCR
- —
- Eligible?
- —
Personal DTI + credit; lowest rate.
DSCR
20% down · 8.5% · 30yr
- Down + closing
- —
- Monthly P&I
- —
- Monthly cashflow
- —
- DSCR
- —
- Eligible?
- —
No personal income docs; deal must DSCR.
Hard money
10% down · 12.0% · 12mo
- Down + closing
- —
- Monthly P&I
- —
- Monthly cashflow
- —
- DSCR
- —
- Eligible?
- —
Short-term bridge; refi at stabilization.
Rent comps 3 comps
| Address | Beds | Baths | Sqft | Rent | $/sqft | DOM | Units | Dist |
|---|---|---|---|---|---|---|---|---|
| 3782 Thunderhawk Pass Fort Wayne, IN | 3.0 | 2.0 | 1464 | $2,095 | $1.43 | 13d | 5 | 1.04mi |
| 823 Woodland Springs Pl Fort Wayne, IN | 3.0 | 2.0 | 1371 | $1,875 | $1.37 | 43d | 1 | 1.18mi |
| 7211 Carrington Blvd Fort Wayne, IN | 3.0 | 2.0 | 1568 | $1,399 | $0.89 | 13d | 1 | 1.45mi |
Listing history 14 events
-
2026-05-23status Pending
-
2026-05-14historical Active Under Contract
-
2026-05-12$219,000 Active
-
2025-06-03status Pending
-
2025-05-30status Active
-
2025-05-21status Pending
-
2025-05-19$215,000 Active
-
2022-09-14soldstatus $175,000 Closed 422-char remark
Show marketing remark (422 chars)
LOOK AT THIS NICE 2000 ft² ~ Move in Ready ~ 4 bed/2 bath Tri-level home with huge fenced in backyard! Large lot with mature trees and patio in back. Big bedrooms. Nice Hardwood flooring. Lots of open space in the two spacious living areas. Basement recently finished. Laundry Room added. Close to shopping, dinning and easy access to I-69. Bring your family, bring your pets, Plenty of room!! Home WARRANTY included.
-
2022-08-20status Pending 422-char remark
Show marketing remark (422 chars)
LOOK AT THIS NICE 2000 ft² ~ Move in Ready ~ 4 bed/2 bath Tri-level home with huge fenced in backyard! Large lot with mature trees and patio in back. Big bedrooms. Nice Hardwood flooring. Lots of open space in the two spacious living areas. Basement recently finished. Laundry Room added. Close to shopping, dinning and easy access to I-69. Bring your family, bring your pets, Plenty of room!! Home WARRANTY included.
-
2022-08-08price $179,900 422-char remark
Show marketing remark (422 chars)
LOOK AT THIS NICE 2000 ft² ~ Move in Ready ~ 4 bed/2 bath Tri-level home with huge fenced in backyard! Large lot with mature trees and patio in back. Big bedrooms. Nice Hardwood flooring. Lots of open space in the two spacious living areas. Basement recently finished. Laundry Room added. Close to shopping, dinning and easy access to I-69. Bring your family, bring your pets, Plenty of room!! Home WARRANTY included.
-
2022-08-07$184,500 Active 422-char remark
Show marketing remark (422 chars)
LOOK AT THIS NICE 2000 ft² ~ Move in Ready ~ 4 bed/2 bath Tri-level home with huge fenced in backyard! Large lot with mature trees and patio in back. Big bedrooms. Nice Hardwood flooring. Lots of open space in the two spacious living areas. Basement recently finished. Laundry Room added. Close to shopping, dinning and easy access to I-69. Bring your family, bring your pets, Plenty of room!! Home WARRANTY included.
-
2022-08-02historical $184,500 422-char remark
Show marketing remark (422 chars)
LOOK AT THIS NICE 2000 ft² ~ Move in Ready ~ 4 bed/2 bath Tri-level home with huge fenced in backyard! Large lot with mature trees and patio in back. Big bedrooms. Nice Hardwood flooring. Lots of open space in the two spacious living areas. Basement recently finished. Laundry Room added. Close to shopping, dinning and easy access to I-69. Bring your family, bring your pets, Plenty of room!! Home WARRANTY included.
-
2021-09-29soldstatus $165,900
-
2021-08-01$165,900
ⓘ Source: listings_history table (triggers on properties + properties_extension) + one-shot
backfill from property_details.listing_events for pre-trigger history.
Tax reassessment forecast IN · Partial reset (capped growth)
- Current annual tax
- $2,402 · $200/mo
- Projected year-2 tax
- $2,402 · $200/mo
- Expected delta
- $0/yr ($0/mo · 0.0%)
ⓘ Screening estimate from a state-policy table — verify with the county assessor before closing.
Climate risk First Street
- Flood 1/10 Low FEMA zone X (unshaded) · 0% chance over 30 yrs
- Wildfire 1/10 Low
- Heat 3/10 Moderate 7 d/yr ≥100°F today · 17 d/yr by 30 yrs out
- Wind 2/10 Low
- Air quality 3/10 Moderate 2 unhealthy d/yr today · 3 by 30 yrs out
Nearby sold comps map
Loading sold comps map…
Walkable amenities ~0.75 mi
Loading nearby amenities…
Taxation est. · year 1
- Rental income
- $24,009
- − Mortgage interest
- −$12,267
- − Property taxes
- −$2,402
- − Insurance
- −$1,095
- − Repairs & maintenance
- −$1,921
- − Management
- −$1,921
- − Depreciation
- −$6,371
- Taxable loss
- −$1,967
- Est. tax savings @ 24.0%
- +$472
- After-tax cash flow
- $2,161/yr
For passive investors: Depreciation is non-cash, so a rental often shows a tax loss while cash-flowing — sheltering income. Rental losses are passive: they offset passive income freely, and up to $25,000/yr can offset ordinary (W-2) income if you actively participate and your MAGI is under $100k (phasing out to $0 by $150k); unused losses carry forward. On sale, claimed depreciation is recaptured at up to 25%, and gains may owe capital-gains tax (a 1031 exchange can defer both). Figures are a year-1 estimate at your 24.0% rate — not tax advice; consult a CPA.
Schools (NCES district)
- District
- Fort Wayne Community Schools
- NCES district ID
- 1803630
- Math proficiency
- 22% ▼ -11.00%
- Reading proficiency
- 29% ▼ -7.00%
- Median HH income
- $41,951
- Composite
- 21.68/100
- National rank
- #8275
- State rank
- #263 of 301 in IN
Livability — Fort Wayne
- Score
- 84/100
- State rank
- #6
- US rank
- #676
Category grades
Schools grade is shown separately in the Schools card above.
Census & demographics
- Census place
- Fort Wayne, IN
- County
- Allen County · 326,813 people
- City population
- 326,813
- Metro
- Fort Wayne, IN
- Population (ZIP)
- 21,954
- Household income
- $81,066
- Rent vs Own
- Severe rent burden
- 101.0
Population outlook (Allen County) Hauer SSP2
- Today (2025)
- 394,020 people
- By 2030
- 405,128 · +2.8%
- By 2040
- 423,476 · +7.5%
- By 2050
- 435,137 · +10.4%
- By 2075
- 450,293 · +14.3%
- By 2100
- 424,101 · +7.6%
Race, ethnicity, and origin ACS 2023
- Neighborhood character
- Predominantly White (79%)
- Race & ethnicity
- White 79% Two or more races 8% Hispanic / Latino 7% Black 4% Asian 3%
- Hispanic origin (detail)
- Mexican 6%
- Common ancestry
- Italian 4% Slovak 3% Romanian 2%
- Foreign-born
- 8% · Canada, Vietnam, Philippines
- Languages at home
- 90% English-only · Spanish 4% Other Asian/Pacific 1% Vietnamese 1%
Political lean MEDSL · Allen
- 2024 margin
- R (+12.5) · D 42.9% · R 55.4% · Other 1.7%
- 2008→2024 swing
- -8.1pp toward R · 2008: -4.3pp · 2024: -12.5pp
- All cycles
- 2024: R+12.5 2020: R+11.2 2016: R+19.6 2012: R+16.8 2008: R+4.3
Not yet ingested
- Civics
- —
Market trends
- HPI YoY
- ▼ -217.71%
- Current HPI
- 228.1539
- Rent YoY
- ▲ 7.64%
- Metro
- Fort Wayne, IN
- State GDP YoY
- ▲ 2.90%
- F500 in state
- 18
Industry mix (Fortune 500 HQ in IN)
| Industry | F500 HQs | Revenue |
|---|---|---|
| Industrial Machinery | 2 | $37B |
|
||
| Healthcare | 1 | $177B |
|
||
| Pharmaceuticals | 1 | $45B |
|
||
| Metals / Steel | 1 | $18B |
|
||
| Agriculture | 1 | $17B |
|
||
| Packaging | 1 | $12B |
|
||
Price history
+32.0% since first listed14 events — show timeline
- 2026-05-23 Pending — IRMLS
- 2026-05-14 Contingent — IRMLS
- 2026-05-12 Listed $219,000 IRMLS
- 2025-06-03 Pending — IRMLS
- 2025-05-30 Relisted — IRMLS
- 2025-05-21 Pending — IRMLS
- 2025-05-19 Listed $215,000 IRMLS
- 2022-09-14 Sold (MLS) $175,000 IRMLS
- 2022-08-20 Pending — IRMLS
- 2022-08-08 Price Changed $179,900 IRMLS
- 2022-08-07 Listed $184,500 IRMLS
- 2022-08-02 Coming Soon $184,500 IRMLS
- 2021-09-29 Sold (MLS) $165,900 IRMLS
- 2021-08-01 Listed $165,900 IRMLS
Property tax history
+14.3%/yrLatest (2024): $2,402 · +12.8% YoY. Source: county tax records.
Cash-flow waterfall
monthlySold comps — $/sqft
last 12 mo · ≤1 miLoading sold comps…