6628 Bitteroot Ln · Berkeley, MO
Flood risk 1/10 · Minimal
- FEMA flood zone
- X (unshaded)
- Chance of flooding over 30 yrs
- 0.0%
- Est. flood insurance / yr
- $507 – $1,088
Fire risk 1/10 · Minimal
- Est. fire insurance / yr
- $1,054 – $1,958
Heat risk 4/10 · Minor
- Hot days now (above 106°F)
- 7 days/yr
- Hot days in 30 yrs
- 21 days/yr
Wind risk 2/10 · Minimal
- Chance of severe wind over 30 yrs
- 1.0%
Air-quality risk 3/10 · Minor
- Unhealthy air days now
- 3 days/yr
- Unhealthy air days in 30 yrs
- 5 days/yr
Risk factors via First Street. Map © Google.
Why this score? — see what drove the D+ grade
The composite is a weighted blend of 9 inputs, each scored 0–100. Each bar is that input's sub-score; the figure is the points it added to the 100-point composite (weight × sub-score).
- Cash flow +21.5/30.0
- ARV discount +7.0/15.0
- DSCR +6.8/10.0
- 1% rule +4.7/10.0
- Rent growth +2.9/5.0
- Livability +2.7/5.0
- Condition / age +2.5/5.0
- Schools +1.2/10.0
- Appreciation +0.0/10.0
$148,000
🖨 Deal sheet 📄 Offer letter ✓ Due diligence
Listing remarks
INVESTORS - LOOKING FOR A FOUR BEDROOM HOME TO ADD TO YOUR PORTFOLIO?? THIS IS IT!! This OCCUPIED updated home features 4 bedrooms and 2 bathrooms within a total living space of 1,508 square feet. The living room offers ample space for relaxation and entertaining. There are two bathrooms one with a tub/shower combination and the other has a walk in shower for convenience. Each bedroom provides sufficient room for furniture and personal items. The property includes essential amenities such as heating and washer/dryer hookups. The exterior is designed for easy maintenance, providing a practical outdoor space. This home is suitable for those seeking a spacious layout in a functional setting.
Key facts
- 8,385 sq ft lot
- Parking
- Built 1954
Property features AI
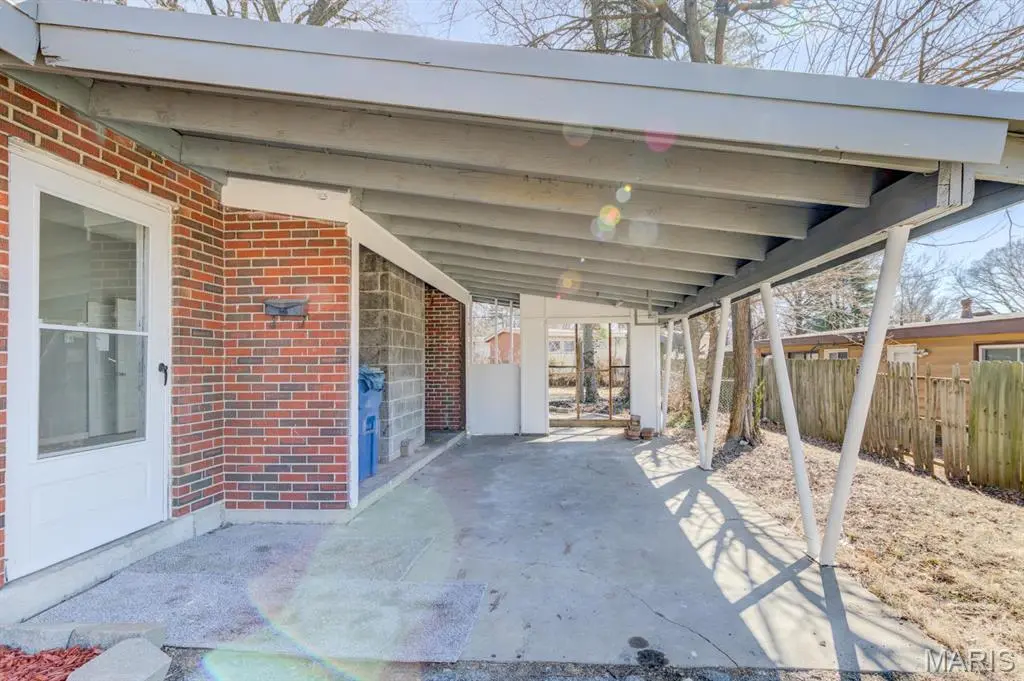
Exterior
- Parking: Carport with space for 1 vehicle
- Utilities: Public water; Public sewer; Electric service by Ameren
- Home design: Single-family residence; One level
- Construction: Brick construction
- Exterior features: Lot with other landscaping/features
Interior
- Bedrooms: Four bedrooms — all on the main level
- Bathrooms: Two full bathrooms — both on the main level
- Heating & cooling: Natural gas heating; Central air conditioning
- Interior features: Fireplace (1)
Neighborhood map
What this means for you Summary
Snapshot
- This is a 3-bed/1.0-bath single-family listed at $148k.
Deal economics
- At list price, monthly cash flow is $221 ($3k/yr) — positive.
- The deal already cash-flows at list — no discount required.
- To meet the 1% rule (rent ≥ 1% of price), the offer needs to be $144k (2.5% below list).
- Recommended offer: $144k (2.5% below list) — sets the bar for 1% rule.
- Cap rate 8.1% vs local median 10.1% in Berkeley — below-typical yield; the buyer is paying a premium for something (appreciation thesis, condition, location) that the cap rate doesn't capture.
Location & tenants
- Location reads 54/100 on livability (#774 in MO) — a working-class tenant base; expect higher turnover. Strengths: cost of living A+, housing A; Watch: health & safety C-, crime F, amenities F.
- Ferguson-Florissant R-II (suburban): math 7% / reading 20% proficiency, ranked #311 of 324 in MO (top 96%) — low school quality limits family demand, transient renter base, plan for 1-2y turnover; 70% free/reduced lunch — lower-income household profile, screen leases tightly.
- Zoned schools: Berkeley Elementary School (math 4% / reading 13%, grade F, #1,050 of 1,115 statewide, top 94%, 346 students, 99% FRL); Mccluer High (math 0% / reading 17%, grade F, #511 of 521 statewide, top 98%, 1,181 students, 100% FRL) — zoned schools average 99% FRL vs 70% district-wide (30 pts higher); higher-poverty schools than district average — tighter screening recommended.
- Market conditions: Rents rising (+1.6%/yr); 70 active listings in the ZIP; 19 comparable units currently listed for rent nearby; rentals at typical pace (median 24d on market — plan ~3-4 weeks tenant-placement turnaround); lower-income renter base — watch delinquency; 920 units permitted in St. Louis County in 2024 (250 in 5+ unit buildings).
- This rent runs 39% of the median local income ($45k/yr) — at the standard rent-burdened threshold; future hikes will face affordability resistance.
Forward outlook
- Local home prices are declining (-3.0%/yr); year-one equity from $1k of loan paydown is wiped out by about $4k of value loss. Plan a longer hold.
Negotiation context
- Only 10 days on market — expect competitive offers; lowballing is unlikely to land.
- Current owner paid $30k; list at $148k implies a 393% gain — meaningful room to come down on a strong offer.
Risks & watch-outs
- Watch-outs: built in 1954 — expect roof / HVAC / electrical / plumbing capex.
Questions for the listing agent
- Built in 1954 — when were the roof, HVAC, electrical panel, plumbing, and water heater last replaced?
- Is there a deadline driving the sale (1031 exchange, divorce, estate, relocation)? That informs how much negotiation room exists.
- Schools are F-rated, which usually means shorter tenancies and higher turnover. Who's the typical renter profile here, and what's been the actual vacancy rate?
- Crime grade is F in this area — have there been break-ins, vandalism, or insurance claims at this property in the last 3 years? What carrier currently insures it and at what premium?
- The area grade is low — what's the realistic commute time and amenity access for the typical tenant pool here? Any planned neighborhood developments (good or bad) we should know about?
- What's the average days-on-market for RENTAL listings here right now (not sales)? A rising rental-DOM trend means longer vacancies and softer asking-rent achievability than the comps imply.
- What's the recent tenant-quality profile in this submarket — average credit score on applications, eviction rate, late-payment / NSF rate, and stable-employment percentage? A property-management company in the area should have these aggregated.
- How much new for-sale + rental construction is in the pipeline within 1–3 miles? Heavy new supply typically softens prices + rents 12–24 months out; constrained supply supports both.
Investment metrics
- 1% rule
- 0.97% ✗
- Cap rate
- 8.08%
- Cash-on-cash
- 6.40%
- DSCR
- 1.28
- GRM
- 8.5
CMA / ARV
- ARV (on-the-fly)
- $146,276
- Comps found
- 12
Show comp detail 12 sales within ~0.75 mi
| Address | Dist | Beds/Ba | Sqft | Sold | Price | $/sf | Match |
|---|---|---|---|---|---|---|---|
| 6706 Alder Ave | 0.29mi | 3/2.0 | 1,428 (-5%) | 3mo | $155,500 | $109 | 71 |
| 6604 Graybirch Dr | 0.09mi | 3/2.0 | 1,288 (-15%) | 1mo | $124,900 | $97 | 67 |
| 8406 January Ave | 0.14mi | 3/2.0 | 1,288 (-15%) | 2mo | $160,000 | $124 | 64 |
| 8415 Buckthorn Dr | 0.18mi | 3/1.5 | 1,308 (-13%) | 4mo | $105,000 | $80 | 64 |
| 8443 Red Fir Dr | 0.14mi | 3/2.0 | 1,288 (-15%) | 2mo | $32,000 | $25 | 64 |
| 8418 Midwood Ave | 0.18mi | 3/2.0 | 1,288 (-15%) | 2mo | $125,000 | $97 | 62 |
| 225 Sadonia Ave | 0.65mi | 3/2.5 | 1,496 (-1%) | 4mo | $105,000 | $70 | 59 |
| 6904 Frostview Ln | 0.46mi | 3/2.0 | 1,386 (-8%) | 4mo | $185,000 | $133 | 58 |
| 6616 Dunwold Dr | 0.36mi | 3/2.0 | 1,348 (-11%) | 8mo | $155,000 | $115 | 55 |
| 7009 Laupher Ln | 0.60mi | 3/1.5 | 1,340 (-11%) | 3mo | $79,900 | $60 | 49 |
| 6136 Jefferson Ave | 0.68mi | 3/1.0 | 1,389 (-8%) | 8mo | $85,000 | $61 | 49 |
| 8616 Elwyn Dr | 0.60mi | 3/2.0 | 1,384 (-8%) | 8mo | $159,000 | $115 | 48 |
Match score weights: distance 35% · size 25% · config 20% · recency 20%. Top-matched comps best support the ARV.
Projected returns pro-forma
-3.0% appreciation · 1.61% rent growth · sell at horizon
- IRR
- -7.9%
- Equity multiple
- 0.71×
- Total profit
- $-11,943
- Equity at exit
- $22,067
- IRR
- -0.1%
- Equity multiple
- 0.99×
- Total profit
- $-393
- Equity at exit
- $12,796
Cash invested: $41,440 (down + closing). Projections, not guarantees.
Landlord ↔ Tenant lean methodology
- Overall (STATE)
- 81 Strongly Landlord-Friendly
- State Missouri
- 81 Strongly Landlord-Friendly · R+10
- County
- — inherits STATE
- City
- — inherits STATE
ZIP-level market 63134
- Rents YoY
- 1.6%
- Active inventory
- 70
- Price-to-rent
- 8.5×
Monthly cashflow live
- Estimated rent
- $1,442 high interval (Pro) →
- Mortgage (P&I)
- −$776
- Tax from tax record
- −$81 /mo · $970/yr
- Insurance
- −$62
- HOA
- −$0
- Vacancy / Maint / Mgmt
- −$303
- Net cashflow
- $221
Break-even live
UW: 25.0% down · 7.5% · 30yr · 1.5% tax · 5.0% vac · 8.0% maint · 8.0% mgmt
Financing live
Cash to close
- Down payment
- $37,000
- Closing costs
- $4,440
- Reserves months
- —
- Total cash needed
- —
Loan-product check · same deal, 3 products live
Conventional
25% down · 7.5% · 30yr
- Down + closing
- —
- Monthly P&I
- —
- Monthly cashflow
- —
- DSCR
- —
- Eligible?
- —
Personal DTI + credit; lowest rate.
DSCR
20% down · 8.5% · 30yr
- Down + closing
- —
- Monthly P&I
- —
- Monthly cashflow
- —
- DSCR
- —
- Eligible?
- —
No personal income docs; deal must DSCR.
Hard money
10% down · 12.0% · 12mo
- Down + closing
- —
- Monthly P&I
- —
- Monthly cashflow
- —
- DSCR
- —
- Eligible?
- —
Short-term bridge; refi at stabilization.
Rent comps 19 comps
| Address | Beds | Baths | Sqft | Rent | $/sqft | DOM | Units | Dist |
|---|---|---|---|---|---|---|---|---|
| 8418 Bayberry Dr Saint Louis, MO | 3.0 | 2.0 | 1288 | $1,350 | $1.05 | 21d | 1 | 0.06mi |
| 8437 January Ave Saint Louis, MO | 3.0 | 2.0 | 1288 | $1,350 | $1.05 | 43d | 1 | 0.17mi |
| 6452 Evergreen Blvd Saint Louis, MO | 3.0 | 2.0 | 1288 | $1,500 | $1.16 | 23d | 1 | 0.18mi |
| 8439 Alder Ave Saint Louis, MO | 3.0 | 1.5 | 1176 | $1,425 | $1.21 | 23d | 1 | 0.24mi |
| 8330 Woodhurst Dr Saint Louis, MO | 3.0 | 1.0 | 1120 | $1,000 | $0.89 | 7d | 1 | 0.25mi |
| 8412 Chalons Ct Saint Louis, MO | 3.0 | 1.0 | 1380 | $1,370 | $0.99 | 23d | 1 | 0.26mi |
| 6698 Amora Ave Berkeley, MO | 2.0–3.0 | 1.5 | 1625 | $1,500 | $0.92 | 43d | 1 | 0.42mi |
| 6867 Thurston Ave Saint Louis, MO | 3.0 | 2.0 | 1243 | $1,580 | $1.27 | 43d | 1 | 0.52mi |
| 260 Sadonia Ave Saint Louis, MO | 3.0 | 2.0 | 1088 | $1,623 | $1.49 | 20d | 1 | 0.58mi |
| 153 Bascom Dr Saint Louis, MO | 3.0 | 1.0 | 1076 | $1,195 | $1.11 | 19d | 1 | 0.70mi |
| 541 Hentschel Pl Saint Louis, MO | 2.0 | 1.0 | 1305 | $1,500 | $1.15 | 4d | 1 | 0.71mi |
| 1131 N Florissant Rd Saint Louis, MO | 3.0 | 1.0 | 1580 | $1,390 | $0.88 | 23d | 1 | 0.89mi |
| 11 Anistasia Dr Saint Louis, MO | 3.0 | 1.5 | 1120 | $1,345 | $1.20 | 23d | 1 | 0.96mi |
| 8507 Tally Ho Dr Hazelwood, MO | 2.0 | 1.5 | 1478 | $1,300 | $0.88 | 43d | 5 | 1.02mi |
| 5 Santa Cruz Dr Florissant, MO | 2.0 | 1.0 | 1410 | $1,411 | $1.00 | 16d | 1 | 1.18mi |
| 1455 S New Florissant Rd Florissant, MO | 4.0 | 1.0 | 1584 | $1,721 | $1.09 | 43d | 1 | 1.24mi |
| 1250 S New Florissant Rd Florissant, MO | 2.0 | 1.0 | 1150 | $1,500 | $1.30 | 14d | 1 | 1.35mi |
| 17 Valley Dr Florissant, MO | 2.0 | 2.0 | 1356 | $1,525 | $1.12 | 43d | 1 | 1.38mi |
| 324 Emmett Ave Saint Louis, MO | 3.0 | 2.0 | 1357 | $1,650 | $1.22 | 23d | 1 | 1.42mi |
Listing history 8 events
-
2026-06-18days on market $148,000 Active 10 DOM
-
2026-06-17days on market $148,000 Active 9 DOM
-
2026-06-16days on market $148,000 Active 8 DOM
-
2026-06-15days on market $148,000 Active 7 DOM
-
2026-06-13days on market $148,000 Active 5 DOM
-
2026-06-13days on market $148,000 Active 4 DOM
-
2026-06-09remarks 699-char remark
-
2026-06-09$148,000 Active 1 DOM
ⓘ Source: listings_history table (triggers on properties + properties_extension) + one-shot
backfill from property_details.listing_events for pre-trigger history.
Tax reassessment forecast MO · Resets to sale price
- Current annual tax
- $970 · $81/mo
- Projected year-2 tax
- $1,436 · $120/mo
- Expected delta
- +$465/yr (+$39/mo · 48.0%)
ⓘ Screening estimate from a state-policy table — verify with the county assessor before closing.
Climate risk First Street
- Flood 1/10 Low FEMA zone X (unshaded) · 0% chance over 30 yrs
- Wildfire 1/10 Low
- Heat 4/10 Moderate 7 d/yr ≥106°F today · 21 d/yr by 30 yrs out
- Wind 2/10 Low 100% chance of damaging wind over 30 yrs
- Air quality 3/10 Moderate 3 unhealthy d/yr today · 5 by 30 yrs out
Nearby sold comps map
Loading sold comps map…
Walkable amenities ~0.75 mi
Loading nearby amenities…
Taxation est. · year 1
- Rental income
- $17,310
- − Mortgage interest
- −$8,290
- − Property taxes
- −$970
- − Insurance
- −$740
- − Repairs & maintenance
- −$1,385
- − Management
- −$1,385
- − Depreciation
- −$4,305
- Taxable income
- $234
- Est. tax owed @ 24.0%
- −$56
- After-tax cash flow
- $2,595/yr
For passive investors: Depreciation is non-cash, so a rental often shows a tax loss while cash-flowing — sheltering income. Rental losses are passive: they offset passive income freely, and up to $25,000/yr can offset ordinary (W-2) income if you actively participate and your MAGI is under $100k (phasing out to $0 by $150k); unused losses carry forward. On sale, claimed depreciation is recaptured at up to 25%, and gains may owe capital-gains tax (a 1031 exchange can defer both). Figures are a year-1 estimate at your 24.0% rate — not tax advice; consult a CPA.
Schools (NCES district)
- District
- Ferguson-Florissant R-II
- NCES district ID
- 2912010
- Math proficiency
- 7% ▼ -9.00%
- Reading proficiency
- 20% ▼ -6.00%
- Median HH income
- $44,610
- Composite
- 11.96/100
- National rank
- #9666
- State rank
- #311 of 324 in MO
Livability — Berkeley
- Score
- 54/100
- State rank
- #774
- US rank
- #23800
Category grades
Schools grade is shown separately in the Schools card above.
Census & demographics
- Census place
- Berkeley, MO
- County
- Saint Louis County · 888,823 people
- City population
- 13,059
- Metro
- St. Louis, MO-IL
- Population (ZIP)
- 13,059
- Household income
- $44,680
- Rent vs Own
- Severe rent burden
- 655.0
Population outlook (St. Louis County) Hauer SSP2
- Today (2025)
- 1,025,227 people
- By 2030
- 1,028,023 · +0.3%
- By 2040
- 1,020,940 · -0.4%
- By 2050
- 1,007,280 · -1.8%
- By 2075
- 987,277 · -3.7%
- By 2100
- 921,984 · -10.1%
Race, ethnicity, and origin ACS 2023
- Neighborhood character
- Predominantly Black (66%)
- Race & ethnicity
- Black 66% White 17% Hispanic / Latino 13% Two or more races 7%
- Hispanic origin (detail)
- Mexican 8%
- Common ancestry
- Lithuanian 1%
- Foreign-born
- 6% · Canada
- Languages at home
- 86% English-only · Spanish 11%
Political lean MEDSL · St. Louis
- 2024 margin
- Strong D (+23.4) · D 60.8% · R 37.4% · Other 1.7%
- 2008→2024 swing
- +3.5pp toward D · 2008: 19.9pp · 2024: 23.4pp
- All cycles
- 2024: D+23.4 2020: D+24.0 2016: D+16.2 2012: D+13.7 2008: D+19.9
Not yet ingested
- Civics
- —
Market trends
- HPI YoY
- ▼ -164.02%
- Current HPI
- 226.9524
- Rent YoY
- ▲ 1.61%
- Metro
- St. Louis, MO-IL
- State GDP YoY
- ▲ 1.84%
- F500 in state
- 20
Industry mix (Fortune 500 HQ in MO)
| Industry | F500 HQs | Revenue |
|---|---|---|
| Healthcare | 1 | $163B |
|
||
| Insurance | 1 | $21B |
|
||
| Industrial Technology | 1 | $17B |
|
||
| Retail | 1 | $16B |
|
||
| Industrial Distribution | 1 | $10B |
|
||
| Utilities | 1 | $9B |
|
||
Price history
+393.3% since first listed5 events — show timeline
- 2026-06-08 Listed $148,000 MARIS as Distributed by MLS Grid
- 2005-01-12 Sold (Public Records) $30,000 Public Records
- 1994-11-18 Sold (Public Records) — Public Records
- 1992-03-02 Sold (Public Records) — Public Records
- 1991-06-01 Sold (Public Records) — Public Records
Property tax history
+1.5%/yrLatest (2022): $970 · +0.7% YoY. Source: county tax records.
Cash-flow waterfall
monthlySold comps — $/sqft
last 12 mo · ≤1 miLoading sold comps…