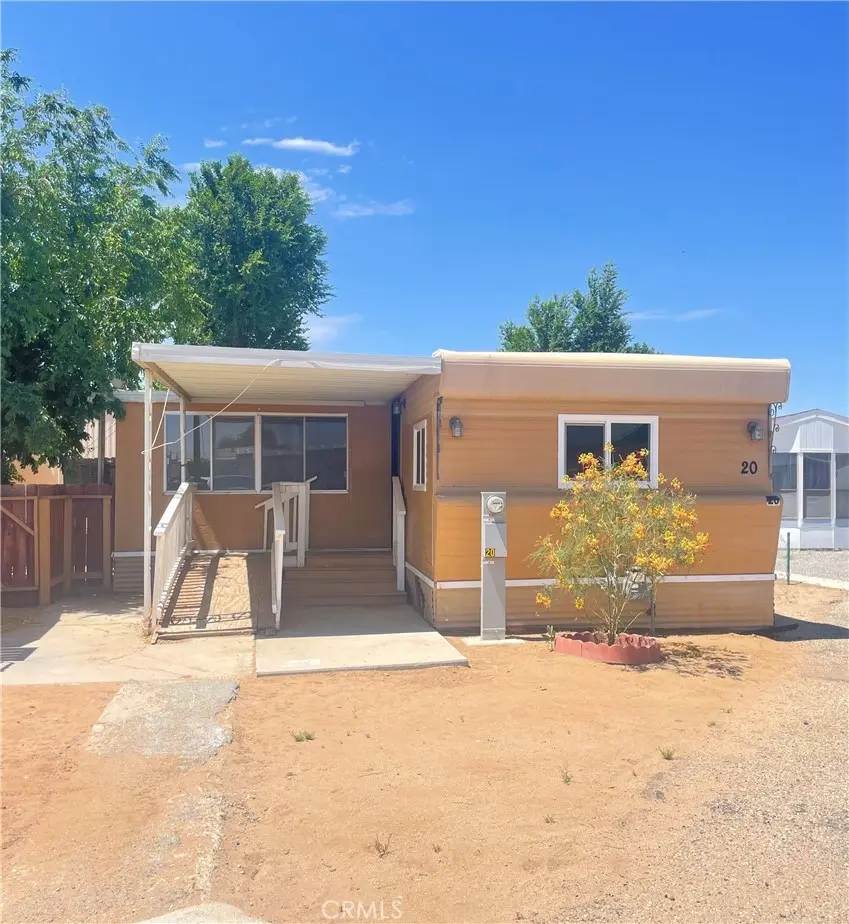
17971 Jonathan St #20 · Adelanto, CA
Flood risk 3/10 · Minor
- FEMA flood zone
- X (shaded)
- Chance of flooding over 30 yrs
- 0.2%
- Est. flood insurance / yr
- $507 – $1,088
Fire risk 4/10 · Minor
- Est. fire insurance / yr
- $659 – $1,223
Heat risk 7/10 · Major
- Hot days now (above 99°F)
- 4 days/yr
- Hot days in 30 yrs
- 10 days/yr
Wind risk 1/10 · Minimal
- Chance of severe wind over 30 yrs
- —
Air-quality risk 8/10 · Major
- Unhealthy air days now
- 16 days/yr
- Unhealthy air days in 30 yrs
- 20 days/yr
Risk factors via First Street. Map © Google.
Why this score? — see what drove the A grade
The composite is a weighted blend of 9 inputs, each scored 0–100. Each bar is that input's sub-score; the figure is the points it added to the 100-point composite (weight × sub-score).
- Cash flow +30.0/30.0
- ARV discount +15.0/15.0
- 1% rule +10.0/10.0
- DSCR +10.0/10.0
- Appreciation +10.0/10.0
- Condition / age +4.0/5.0
- Rent growth +3.7/5.0
- Livability +2.4/5.0
- Schools +2.2/10.0
$34,999
🖨 Deal sheet (PDF) 📄 Offer letter ✓ Due diligence
Listing remarks
This beautifully upgraded home is move-in ready and offers exceptional value! Step inside to find a fresh, modern interior featuring brand new in 2026 luxury vinyl wide plank flooring throughout and fresh new paint. The bright, open layout includes 2 bedrooms plus additional living space. The kitchen has been nicely updated with a new stainless steel refrigerator, a 5-burner stove, a matching range hood, and countertops. Additional recent upgrades include brand new windows and blinds . This beautiful home is located in an all-age park, located directly next to Adelanto Elementary School. The community is also near local parks, shopping, and dining.
Key facts
- Matching range hood
- 5-burner stove
- New windows
Tags
Property features AI
Finance
- Other: Manager approval required
- HOA & community: Land lease of $550 per month (park-managed); Park: Adelanto homes; Community park on site
Exterior
- Parking: On-site parking; Unpaved driveway; Uncovered parking
- Utilities: Public/district water; Septic tank sewer
- Home design: Single-story mobile home (12' x 60'); Mobile home remains on property; Total of 1 story
- Construction: Mobile construction
- Exterior features: No pool; Irregular lot shape
Interior
- Kitchen: Gas range
- Flooring: Laminate flooring
- Bathrooms: 1 full bathroom
- Heating & cooling: Floor furnace heating
- Interior features: Corian counters; One level; Entry on main level
- Laundry & utility: Indoor laundry with washer hookup
Neighborhood map
What this means for you Summary
Snapshot
- This is a 2-bed/1.0-bath manufactured listed at $35k. Condition is rated good.
Deal economics
- At list price, monthly cash flow is $906 ($11k/yr) — positive.
- The deal already cash-flows at list — no discount required.
- Meets the 1% rule at list price ($1k rent vs $35k).
- Recommended offer: $34k (3.0% below list) — sets the bar for market timing.
- Cap rate 37.4% vs local median 4.2% in Adelanto — top-decile yield for the area; either an underpriced asset or a hidden risk that comps aren't pricing in. Stress-test before assuming the spread holds.
Location & tenants
- Location reads 47/100 on livability (#1,250 in CA) — a working-class tenant base; expect higher turnover. Strengths: housing A+; Watch: crime D, schools F, amenities F.
- Victor Valley Union High (urban): math 25% / reading 25% proficiency, ranked #407 of 517 in CA (top 79%) — low school quality limits family demand, transient renter base, plan for 1-2y turnover; 72% free/reduced lunch — lower-income household profile, screen leases tightly.
- Market conditions: Rents rising fast (+4.7%/yr); 631 active listings in the ZIP; 11 comparable units currently listed for rent nearby; rentals leasing fast (median 6d on market — plan ~1-2 weeks tenant-placement turnaround); 5,458 units permitted in San Bernardino County in 2024 (1,500 in 5+ unit buildings).
Forward outlook
- In year one you build about $4k of equity ($242 loan paydown + $4k appreciation (10.0% local appreciation)).
- San Bernardino County population projected at +15% by 2050 — modest demand growth; plan on rents tracking national, not racing it.
- At projected returns (10.0% appreciation + 4.7% rent growth), your $10k cash investment doubles in ~1 year — after that, you're playing with house money.
- By year 8, paydown + projected appreciation supports a ~$33k cash-out refi (75% LTV) — recoverable capital for the next deal without selling this one.
Negotiation context
- It's been on market 39 days — a 3% lower offer ($34k) is reasonable based on typical stale-listing flexibility.
Risks & watch-outs
- Climate carrying-cost: extreme-heat days projected 4→10/yr by 2055 (HVAC capex compounding) — expect insurance premiums to compound above CPI over the hold.
Questions for the listing agent
- It's been on market 39 days. Have you received any prior offers? Is the seller open to a 3% concession, seller financing, or rate buy-down credit?
- Built in 1965 — when were the roof, HVAC, electrical panel, plumbing, and water heater last replaced?
- Is there a deadline driving the sale (1031 exchange, divorce, estate, relocation)? That informs how much negotiation room exists.
- Schools are F-rated, which usually means shorter tenancies and higher turnover. Who's the typical renter profile here, and what's been the actual vacancy rate?
- Crime grade is D in this area — have there been break-ins, vandalism, or insurance claims at this property in the last 3 years? What carrier currently insures it and at what premium?
- What's the average days-on-market for RENTAL listings here right now (not sales)? A rising rental-DOM trend means longer vacancies and softer asking-rent achievability than the comps imply.
- What's the recent tenant-quality profile in this submarket — average credit score on applications, eviction rate, late-payment / NSF rate, and stable-employment percentage? A property-management company in the area should have these aggregated.
- How much new for-sale + rental construction is in the pipeline within 1–3 miles? Heavy new supply typically softens prices + rents 12–24 months out; constrained supply supports both.
Investment metrics
- 1% rule
- 4.15% ✓
- Cap rate
- 37.35%
- Cash-on-cash
- 110.93%
- DSCR
- 5.94
- GRM
- 2.0
CMA / ARV
- ARV (on-the-fly)
- $59,040
- Comps found
- 1
Show comp detail 1 sale within ~0.75 mi
| Address | Dist | Beds/Ba | Sqft | Sold | Price | $/sf | Match |
|---|---|---|---|---|---|---|---|
| 11423 Chamberlaine Way #61 | 0.72mi | 2/1.0 | 760 (+6%) | 17mo | $62,500 | $82 | 43 |
Match score weights: distance 35% · size 25% · config 20% · recency 20%. Top-matched comps best support the ARV.
Projected returns pro-forma
10.0% appreciation · 4.68% rent growth · sell at horizon
- IRR
- —
- Equity multiple
- 9.09×
- Total profit
- $79,276
- Equity at exit
- $31,530
- IRR
- —
- Equity multiple
- 20.75×
- Total profit
- $193,552
- Equity at exit
- $67,995
Cash invested: $9,800 (down + closing). Projections, not guarantees.
Landlord ↔ Tenant lean methodology
- Overall (STATE)
- 18 Strongly Tenant-Friendly
- State California
- 18 Strongly Tenant-Friendly · D+13
- County
- — inherits STATE
- City
- — inherits STATE
ZIP-level market 92301
- Home prices YoY
- 10.0%
- Rents YoY
- 4.7%
- Active inventory
- 631
- Price-to-rent
- 2.0×
Monthly cashflow live
- Estimated rent
- $1,453 high interval (Pro) →
- Mortgage (P&I)
- −$184
- Tax est. 1.5%
- −$44 /mo · $525/yr
- Insurance
- −$15
- HOA
- −$0
- Vacancy / Maint / Mgmt
- −$305
- Net cashflow
- $906
Break-even live
Sensitivity live
| Price | -10% $930 | -5% $918 | +0% $906 | +5% $894 | +10% $882 |
|---|---|---|---|---|---|
| Rent | -10% $791 | -5% $848 | +0% $906 | +5% $963 | +10% $1,021 |
| Rate | -1.0pp $924 | -0.5pp $915 | base $906 | +0.5pp $897 | +1.0pp $888 |
UW: 25.0% down · 7.5% · 30yr · 1.5% tax · 5.0% vac · 8.0% maint · 8.0% mgmt
Financing live
Cash to close
- Down payment
- $8,750
- Closing costs
- $1,050
- Reserves months
- —
- Total cash needed
- —
Loan-product check · same deal, 3 products live
Conventional
25% down · 7.5% · 30yr
- Down + closing
- —
- Monthly P&I
- —
- Monthly cashflow
- —
- DSCR
- —
- Eligible?
- —
Personal DTI + credit; lowest rate.
DSCR
20% down · 8.5% · 30yr
- Down + closing
- —
- Monthly P&I
- —
- Monthly cashflow
- —
- DSCR
- —
- Eligible?
- —
No personal income docs; deal must DSCR.
Hard money
10% down · 12.0% · 12mo
- Down + closing
- —
- Monthly P&I
- —
- Monthly cashflow
- —
- DSCR
- —
- Eligible?
- —
Short-term bridge; refi at stabilization.
Rent comps 11 comps
| Address | Beds | Baths | Sqft | Rent | $/sqft | DOM | Units | Dist |
|---|---|---|---|---|---|---|---|---|
| 18335 Montezuma St Unit 13 Adelanto, CA | 1.0 | 1.0 | 550 | $1,345 | $2.45 | 0d | 1 | 0.52mi |
| 18335 Montezuma St Unit 55-18 Adelanto, CA | 2.0 | 1.0 | 650 | $1,645 | $2.53 | 0d | 1 | 0.53mi |
| 18335 Montezuma St Unit 55-4 Adelanto, CA | 1.0 | 1.0 | 550 | $1,345 | $2.45 | 25d | 1 | 0.53mi |
| 11800 White Ave Unit 8 Adelanto, CA | 1.0 | 1.0 | 535 | $1,100 | $2.06 | 0d | 1 | 0.57mi |
| 18488 Montezuma St Unit 19 Adelanto, CA | 1.0 | 1.0 | 590 | $1,195 | $2.03 | 16d | 1 | 0.66mi |
| 11951 Chamberlaine Way Adelanto, CA | 1.0 | 1.0 | 560 | $1,295 | $2.31 | 0d | 1 | 0.67mi |
| 11951 Chamberlaine Way Unit 12 Adelanto, CA | 1.0 | 1.0 | 560 | $1,395 | $2.49 | 20d | 1 | 0.67mi |
| 11210 Chamberlaine Way Unit B7 Adelanto, CA | 1.0 | 1.0 | 625 | $1,269 | $2.03 | 25d | 1 | 0.94mi |
| 11210 Chamberlaine Way Unit B1 Adelanto, CA | 1.0 | 1.0 | 650 | $1,399 | $2.15 | 11d | 1 | 0.94mi |
| 11200 Vintage Rd Adelanto, CA | 1.0 | 1.0 | 700 | $1,249 | $1.78 | 5d | 1 | 1.16mi |
| 11200 Vintage Rd Unit 02 Adelanto, CA | 1.0 | 1.0 | 700 | $1,349 | $1.93 | 0d | 1 | 1.16mi |
Listing history 16 events
-
2026-06-21days on market $34,999 Active 39 DOM
-
2026-06-18days on market $34,999 Active 36 DOM
-
2026-06-17days on market $34,999 Active 35 DOM
-
2026-06-16days on market $34,999 Active 34 DOM
-
2026-06-15days on market $34,999 Active 33 DOM
-
2026-06-13remarks 656-char remark
-
2026-06-13days on market $34,999 Active 31 DOM
-
2026-06-09days on market $34,999 Active 27 DOM
-
2026-06-08days on market $34,999 Active 26 DOM
-
2026-06-07days on market $34,999 Active 25 DOM
-
2026-06-04days on market $34,999 Active 22 DOM
-
2026-06-03days on market $34,999 Active 21 DOM
-
2026-06-02days on market $34,999 Active 20 DOM
-
2026-06-01days on market $34,999 Active 19 DOM
-
2026-05-31days on market $34,999 Active 18 DOM
-
2026-05-13$34,999 Active
ⓘ Source: listings_history table (triggers on properties + properties_extension) + one-shot
backfill from property_details.listing_events for pre-trigger history.
Climate risk First Street
- Flood 3/10 Moderate FEMA zone X (shaded) · 20% chance over 30 yrs
- Wildfire 4/10 Moderate
- Heat 7/10 Severe 4 d/yr ≥99°F today · 10 d/yr by 30 yrs out
- Wind 1/10 Low
- Air quality 8/10 Severe 16 unhealthy d/yr today · 20 by 30 yrs out
Nearby sold comps map
Loading sold comps map…
Walkable amenities ~0.75 mi
Loading nearby amenities…
Taxation est. · year 1
- Rental income
- $17,434
- − Mortgage interest
- −$1,960
- − Property taxes
- −$525
- − Insurance
- −$175
- − Repairs & maintenance
- −$1,395
- − Management
- −$1,395
- − Depreciation
- −$1,018
- Taxable income
- $10,966
- Est. tax owed @ 24.0%
- −$2,632
- After-tax cash flow
- $8,239/yr
For passive investors: Depreciation is non-cash, so a rental often shows a tax loss while cash-flowing — sheltering income. Rental losses are passive: they offset passive income freely, and up to $25,000/yr can offset ordinary (W-2) income if you actively participate and your MAGI is under $100k (phasing out to $0 by $150k); unused losses carry forward. On sale, claimed depreciation is recaptured at up to 25%, and gains may owe capital-gains tax (a 1031 exchange can defer both). Figures are a year-1 estimate at your 24.0% rate — not tax advice; consult a CPA.
Condition & rehab AI · 8 photos
This move-in ready manufactured home is in good condition with recent upgrades, offering exceptional value for both resale and rental.
Value-add opportunities
- Both Painting exterior siding — Enhances curb appeal and protects siding
- Both Landscaping improvements — Enhances curb appeal and adds value
- Both Add a small front porch — Improves curb appeal and adds functionality
Renovation cost estimate screening
Value-add ROI direction
- Both Painting exterior siding — Enhances curb appeal and protects siding ↑
- Both Landscaping improvements — Enhances curb appeal and adds value ↑
- Both Add a small front porch — Improves curb appeal and adds functionality ↑
ⓘ Cost ranges are severity-bucket heuristics (US national rule-of-thumb). Get contractor quotes + a written scope before underwriting a rehab budget.
Schools (NCES district)
- District
- Victor Valley Union High
- NCES district ID
- 0636972
- Math proficiency
- 25% ▲ 6.00%
- Reading proficiency
- 25% ▼ -12.00%
- Median HH income
- $45,112
- Composite
- 21.6/100
- National rank
- #8296
- State rank
- #407 of 517 in CA
Livability — Adelanto
- Score
- 47/100
- State rank
- #1250
- US rank
- #26338
Category grades
Schools grade is shown separately in the Schools card above.
Census & demographics
- Census place
- Adelanto, CA
- County
- San Bernardino County · 2,030,291 people
- City population
- 38,577
- Metro
- Riverside-San Bernardino-Ontario, CA
- Population (ZIP)
- 38,577
- Household income
- $68,676
- Rent vs Own
- Severe rent burden
- 1345.0
Population outlook (San Bernardino County) Hauer SSP2
- Today (2025)
- 2,300,329 people
- By 2030
- 2,378,907 · +3.4%
- By 2040
- 2,523,137 · +9.7%
- By 2050
- 2,642,388 · +14.9%
- By 2075
- 2,880,769 · +25.2%
- By 2100
- 2,909,436 · +26.5%
Race, ethnicity, and origin ACS 2023
- Neighborhood character
- Predominantly Hispanic (69%)
- Race & ethnicity
- Hispanic / Latino 69% Two or more races 34% Black 15% White 9% Asian 2% Native American 1%
- Hispanic origin (detail)
- Mexican 58%
- Foreign-born
- 18% · Canada
- Languages at home
- 52% English-only · Spanish 46%
Political lean MEDSL · San Bernardino
- 2024 margin
- Toss-up / Even · D 47.5% · R 49.7% · Other 2.8%
- 2008→2024 swing
- -8.5pp toward R · 2008: 6.3pp · 2024: -2.1pp
- All cycles
- 2024: R+2.1 2020: D+10.7 2016: D+9.8 2012: D+5.4 2008: D+6.3
Not yet ingested
- Civics
- —
Market trends
- HPI YoY
- ▲ 41.09%
- Current HPI
- 453.6071
- Rent YoY
- ▲ 4.68%
- Metro
- Riverside-San Bernardino-Ontario, CA
- State GDP YoY
- ▲ 3.21%
- F500 in state
- 116
Industry mix (Fortune 500 HQ in CA)
| Industry | F500 HQs | Revenue |
|---|---|---|
| Technology | 27 | $1,492B |
|
||
| Financial Services | 3 | $174B |
|
||
| Retail | 3 | $44B |
|
||
| Insurance | 3 | $26B |
|
||
| Media / Entertainment | 2 | $115B |
|
||
| Pharmaceuticals / Biotech | 2 | $62B |
|
||
Price history
1 event — show timeline
- 2026-05-13 Listed $34,999 CRMLS
Cash-flow waterfall
monthlySold comps — $/sqft
last 12 mo · ≤1 miLoading sold comps…