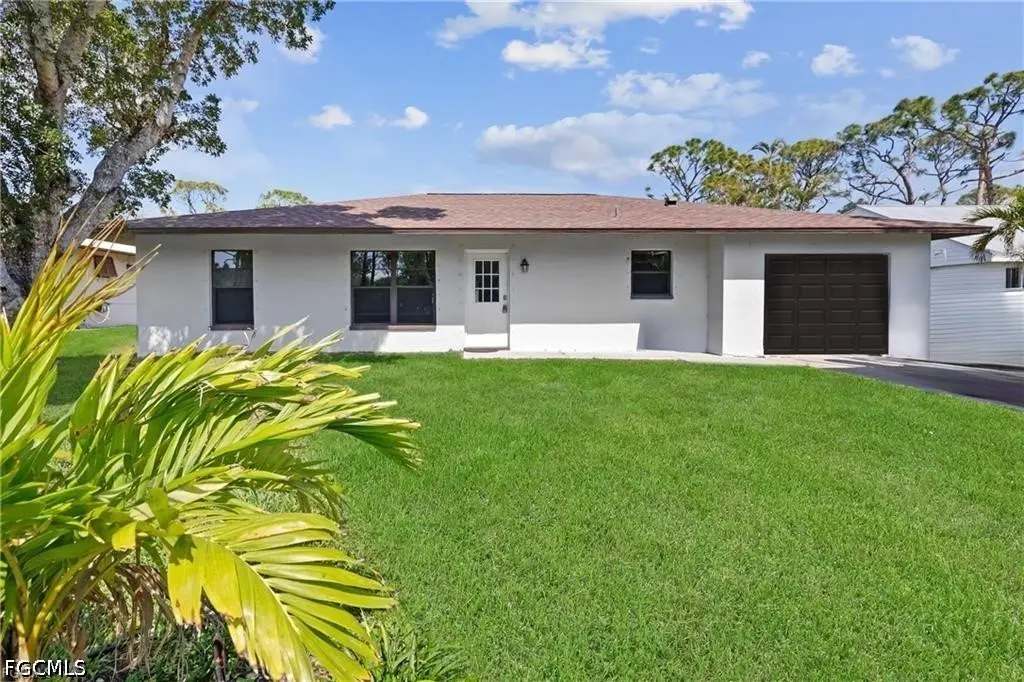
3680 Gasparilla St · St. James City, FL
Flood risk 9/10 · Severe
- FEMA flood zone
- AE
- Chance of flooding over 30 yrs
- 0.99%
- Est. flood insurance / yr
- $1,737 – $8,500
Fire risk 3/10 · Minor
- Est. fire insurance / yr
- $947 – $1,759
Heat risk 10/10 · Severe
- Hot days now (above 107°F)
- 7 days/yr
- Hot days in 30 yrs
- 26 days/yr
Wind risk 10/10 · Severe
- Chance of severe wind over 30 yrs
- 99.0%
Air-quality risk 2/10 · Minimal
- Unhealthy air days now
- 1 days/yr
- Unhealthy air days in 30 yrs
- 2 days/yr
Risk factors via First Street. Map © Google.
Why this score? — see what drove the C+ grade
The composite is a weighted blend of 9 inputs, each scored 0–100. Each bar is that input's sub-score; the figure is the points it added to the 100-point composite (weight × sub-score).
- Cash flow +23.0/30.0
- ARV discount +15.0/15.0
- DSCR +7.4/10.0
- 1% rule +5.8/10.0
- Schools +4.1/10.0
- Rent growth +2.5/5.0
- Livability +2.5/5.0
- Condition / age +2.5/5.0
- Appreciation +0.0/10.0
$259,500
🖨 Deal sheet (PDF) 📄 Offer letter ✓ Due diligence
Listing remarks
Fully Renovated Home in the Heart of St. James City – Embrace the Island Lifestyle Welcome to 3680 Gasparilla Drive, where life slows down and the island lifestyle takes over. Located in the laid-back community of St. James City, this fully renovated 3 bedroom, 2 bathroom home offers the perfect opportunity to enjoy everything Southwest Florida living is known for—boating, fishing, waterfront dining, and endless sunshine. This home has been extensively updated with a new roof (2023) and 2024 improvements, including A/C, flooring, remodeled kitchen and bathrooms, new appliances, and fresh exterior paint—giving buyers peace of mind and a move-in ready experience. Inside,
Key facts
- Modernized kitchen
- Updated finishes
- Fully renovated home
Tags
Property features AI
Finance
- Other: Zoning: RS-1
- Financial info: Pets allowed
- HOA & community: Non-gated community; No association fee
Exterior
- Parking: Attached garage with garage door opener (1 covered space, 1 garage space)
- Security: Smoke detector(s)
- Utilities: Cable available; High-speed internet available; Public water (assessment paid); Public sewer (assessment paid)
- Home design: Single-story home; Entry level: 1; Faces south; Resale property
- Construction: Block, concrete and stucco construction; Shingle roof
- Exterior features: Lanai; Porch (screened); Room for pool; Storage; Oversized lot; Public maintained paved road; Lot exposures to the north
Interior
- Kitchen: Dishwasher; Electric cooktop; Range; Microwave; Refrigerator; Freezer
- Bedrooms: Guest quarters
- Flooring: Tile
- Bathrooms: 2 full bathrooms
- Heating & cooling: Central heating (electric); Central air conditioning; Ceiling fans
- Interior features: Open living/dining area; Separate shower (shower only); Walk-in closet(s); Split bedroom floor plan; Unfurnished
- Laundry & utility: Washer hookup; Dryer hookup; Laundry in garage
Neighborhood map
What this means for you Summary
Snapshot
- This is a 3-bed/2.0-bath single-family listed at $260k.
Deal economics
- At list price, monthly cash flow is $33 ($398/yr) — positive.
- The deal already cash-flows at list — no discount required.
- Meets the 1% rule at list price ($3k rent vs $260k).
- Recommended offer: $252k (3.0% below list) — sets the bar for market timing.
- Cap rate 8.4% vs local median 4.9% in St. James City — top-decile yield for the area; either an underpriced asset or a hidden risk that comps aren't pricing in. Stress-test before assuming the spread holds.
Location & tenants
- Location reads: area grade C — affects rentability + tenant quality, not the cash-flow math above.
- Lee (suburban): math 47% / reading 50% proficiency, ranked #42 of 73 in FL (top 58%) — families likely to look elsewhere, expect single-tenant / working-renter base with shorter leases.
- Zoned schools: Pine Island Elementary School (math 57% / reading 57%, grade C+, #781 of 2,144 statewide, top 38%, 236 students, 45% FRL); Challenger Middle School (math 59% / reading 56%, grade B, #157 of 571 statewide, top 28%, 1,124 students, 50% FRL); Ida S. Baker High School (math 44% / reading 47%, grade D-, #223 of 667 statewide, top 34%, 1,933 students, 39% FRL).
- Market conditions: 289 active listings in the ZIP; 1 comparable units currently listed for rent nearby; 15,411 units permitted in Lee County in 2024 (4,686 in 5+ unit buildings).
Forward outlook
- Local home prices are declining (-3.0%/yr); year-one equity from $2k of loan paydown is wiped out by about $8k of value loss. Plan a longer hold.
- Lee County population projected at +44% by 2050 — long-run rental-demand tailwind backs the buy-and-hold thesis.
Negotiation context
- It's been on market 33 days — a 3% lower offer ($252k) is reasonable based on typical stale-listing flexibility.
- 5 sale attempts since 11y ago; this cycle's ask has dropped $15k (5%) from the opening price — seller is motivated, your offer sets the floor, not the list.
- Current owner paid $220k; 18% above their basis — modest negotiation headroom, anchor on the comps not their cost.
Risks & watch-outs
- Watch-outs: flood insurance adds $427/mo.
- Climate carrying-cost: in FEMA flood zone AE (mandatory federal flood insurance); severe wind risk, 99% chance of damaging wind over 30y; extreme-heat days projected 7→26/yr by 2055 (HVAC capex compounding) — expect insurance premiums to compound above CPI over the hold.
Questions for the listing agent
- It's been on market 33 days. Have you received any prior offers? Is the seller open to a 3% concession, seller financing, or rate buy-down credit?
- What's the actual annual flood-insurance premium (NFIP or private), and is the property in a SFHA with mandatory coverage?
- Is there a deadline driving the sale (1031 exchange, divorce, estate, relocation)? That informs how much negotiation room exists.
- What's the average days-on-market for RENTAL listings here right now (not sales)? A rising rental-DOM trend means longer vacancies and softer asking-rent achievability than the comps imply.
- What's the recent tenant-quality profile in this submarket — average credit score on applications, eviction rate, late-payment / NSF rate, and stable-employment percentage? A property-management company in the area should have these aggregated.
- How much new for-sale + rental construction is in the pipeline within 1–3 miles? Heavy new supply typically softens prices + rents 12–24 months out; constrained supply supports both.
Investment metrics
- 1% rule
- 1.08% ✓
- Cap rate
- 8.42%
- Cash-on-cash
- 7.59%
- DSCR
- 1.34
- GRM
- 7.7
CMA / ARV
- ARV (on-the-fly)
- $488,499
- Comps found
- 4
Show comp detail 4 sales within ~0.75 mi
| Address | Dist | Beds/Ba | Sqft | Sold | Price | $/sf | Match |
|---|---|---|---|---|---|---|---|
| 3461 Manatee Dr | 0.34mi | 3/2.0 | 1,522 (+6%) | 3mo | $594,500 | $391 | 72 |
| 3471 Papaya St | 0.41mi | 3/2.0 | 1,444 (+0%) | 11mo | $75,000 | $52 | 71 |
| 3471 Manatee Dr | 0.31mi | 3/2.0 | 1,532 (+6%) | 9mo | $520,000 | $339 | 67 |
| 3455 Papaya St | 0.41mi | 2/1.0 (-1) | 1,249 (-13%) | 22mo | $112,500 | $90 | 31 |
Match score weights: distance 35% · size 25% · config 20% · recency 20%. Top-matched comps best support the ARV.
Projected returns pro-forma
-3.0% appreciation · 3.0% rent growth · sell at horizon
- IRR
- -15.3%
- Equity multiple
- 0.45×
- Total profit
- $-39,658
- Equity at exit
- $38,692
- IRR
- -6.6%
- Equity multiple
- 0.58×
- Total profit
- $-30,669
- Equity at exit
- $22,437
Cash invested: $72,660 (down + closing). Projections, not guarantees.
Landlord ↔ Tenant lean methodology
- Overall (STATE)
- 87 Strongly Landlord-Friendly
- State Florida
- 87 Strongly Landlord-Friendly · R+3
- County
- — inherits STATE
- City
- — inherits STATE
ZIP-level market 33956
- Home prices YoY
- -16.3%
- Active inventory
- 289
- Price-to-rent
- 7.7×
Monthly cashflow live
- Estimated rent
- $2,806 medium interval (Pro) →
- Mortgage (P&I)
- −$1,361
- Tax from tax record
- −$288 /mo · $3,457/yr
- Insurance
- −$108
- Flood insurance flood zone
- −$427 /mo · $5,118/yr
- HOA
- −$0
- Vacancy / Maint / Mgmt
- −$589
- Net cashflow
- $33
Break-even live
Sensitivity live
| Price | -10% $180 | -5% $107 | +0% $33 | +5% $-40 | +10% $-114 |
|---|---|---|---|---|---|
| Rent | -10% $-189 | -5% $-78 | +0% $33 | +5% $144 | +10% $255 |
| Rate | -1.0pp $164 | -0.5pp $99 | base $33 | +0.5pp $-34 | +1.0pp $-103 |
UW: 25.0% down · 7.5% · 30yr · 1.5% tax · 5.0% vac · 8.0% maint · 8.0% mgmt
Financing live
Cash to close
- Down payment
- $64,875
- Closing costs
- $7,785
- Reserves months
- —
- Total cash needed
- —
Loan-product check · same deal, 3 products live
Conventional
25% down · 7.5% · 30yr
- Down + closing
- —
- Monthly P&I
- —
- Monthly cashflow
- —
- DSCR
- —
- Eligible?
- —
Personal DTI + credit; lowest rate.
DSCR
20% down · 8.5% · 30yr
- Down + closing
- —
- Monthly P&I
- —
- Monthly cashflow
- —
- DSCR
- —
- Eligible?
- —
No personal income docs; deal must DSCR.
Hard money
10% down · 12.0% · 12mo
- Down + closing
- —
- Monthly P&I
- —
- Monthly cashflow
- —
- DSCR
- —
- Eligible?
- —
Short-term bridge; refi at stabilization.
Rent comps 1 comps
| Address | Beds | Baths | Sqft | Rent | $/sqft | DOM | Units | Dist |
|---|---|---|---|---|---|---|---|---|
| 5946 Stringfellow Rd Saint James City, FL | 2.0 | 2.0 | 1249 | $2,806 | $2.25 | 15d | 1 | 0.45mi |
Listing history 22 events
-
2026-05-03status Pending
-
2026-04-20price $259,500
-
2026-03-30$274,500 Active
-
2025-02-21price $299,999
-
2024-08-01historical $2,200
-
2024-07-10price $2,200
-
2024-07-01$2,400
-
2024-06-02historical
-
2024-05-14price $315,000
-
2024-03-05price $389,900
-
2023-12-09$394,900 Active
-
2023-07-07soldstatus $220,000
-
2023-07-06soldstatus $220,000 Closed
-
2023-06-22status Pending
-
2023-05-23price $249,900
-
2023-05-21$24,990 Active
-
2015-09-25price $165,000
-
2015-09-21soldstatus $165,000
-
2015-09-18price $169,900
-
2015-09-18soldstatus $165,000 Sold
-
2015-08-04status Pending
-
2015-07-29$169,900 Active
ⓘ Source: listings_history table (triggers on properties + properties_extension) + one-shot
backfill from property_details.listing_events for pre-trigger history.
Tax reassessment forecast FL · Resets to sale price
- Current annual tax
- $3,457 · $288/mo
- Projected year-2 tax
- $3,457 · $288/mo
- Expected delta
- $0/yr ($0/mo · 0.0%)
ⓘ Screening estimate from a state-policy table — verify with the county assessor before closing.
Climate risk First Street
- Flood 9/10 Extreme FEMA zone AE · 99% chance over 30 yrs
- Wildfire 3/10 Moderate
- Heat 10/10 Extreme 7 d/yr ≥107°F today · 26 d/yr by 30 yrs out
- Wind 10/10 Extreme 99% chance of damaging wind over 30 yrs
- Air quality 2/10 Low 1 unhealthy d/yr today · 2 by 30 yrs out
Nearby sold comps map
Loading sold comps map…
Walkable amenities ~0.75 mi
Loading nearby amenities…
Taxation est. · year 1
- Rental income
- $33,672
- − Mortgage interest
- −$14,536
- − Property taxes
- −$3,457
- − Insurance
- −$6,416
- − Repairs & maintenance
- −$2,694
- − Management
- −$2,694
- − Depreciation
- −$7,549
- Taxable loss
- −$3,674
- Est. tax savings @ 24.0%
- +$882
- After-tax cash flow
- $1,279/yr
For passive investors: Depreciation is non-cash, so a rental often shows a tax loss while cash-flowing — sheltering income. Rental losses are passive: they offset passive income freely, and up to $25,000/yr can offset ordinary (W-2) income if you actively participate and your MAGI is under $100k (phasing out to $0 by $150k); unused losses carry forward. On sale, claimed depreciation is recaptured at up to 25%, and gains may owe capital-gains tax (a 1031 exchange can defer both). Figures are a year-1 estimate at your 24.0% rate — not tax advice; consult a CPA.
Schools (NCES district)
- District
- Lee
- NCES district ID
- 1201080
- Math proficiency
- 47% ▼ -11.00%
- Reading proficiency
- 50% ▼ -4.00%
- Median HH income
- $49,518
- Composite
- 41.49/100
- National rank
- #3458
- State rank
- #42 of 73 in FL
Livability — St. James City
No livability data for this city. (Only ~50 U.S. cities are tracked.)
Census & demographics
- Census place
- St. James City, FL
- Population (ZIP)
- 3,846
Population outlook (Lee County) Hauer SSP2
- Today (2025)
- 871,946 people
- By 2030
- 955,468 · +9.6%
- By 2040
- 1,113,587 · +27.7%
- By 2050
- 1,256,891 · +44.1%
- By 2075
- 1,560,270 · +78.9%
- By 2100
- 1,726,848 · +98.0%
Race, ethnicity, and origin ACS 2023
- Neighborhood character
- Predominantly White (94%)
- Race & ethnicity
- White 94% Two or more races 3% Pacific Islander 2% Hispanic / Latino 1%
- Common ancestry
- Romanian 6% Slovak 4% Iranian 3%
- Foreign-born
- 5% · Canada
- Languages at home
- 95% English-only · French/Haitian/Cajun 2% German/W. Germanic 2% Russian/Polish/Slavic 1%
Political lean MEDSL · Lee
- 2024 margin
- Strong R (+28.4) · D 35.5% · R 63.9%
- 2008→2024 swing
- -18.0pp toward R · 2008: -10.4pp · 2024: -28.4pp
- All cycles
- 2024: R+28.4 2020: R+19.2 2016: R+20.4 2012: R+16.6 2008: R+10.4
Not yet ingested
- Civics
- —
Market trends
- HPI YoY
- ▼ -58.47%
- Current HPI
- 300.1416
- Rent YoY
- —
- Metro
- —
- State GDP YoY
- ▲ 3.28%
- F500 in state
- 36
Industry mix (Fortune 500 HQ in FL)
| Industry | F500 HQs | Revenue |
|---|---|---|
| Industrial Technology | 2 | $29B |
|
||
| Insurance | 2 | $17B |
|
||
| Retail | 1 | $60B |
|
||
| Technology Distribution | 1 | $58B |
|
||
| Homebuilding | 1 | $35B |
|
||
| Technology Manufacturing | 1 | $35B |
|
||
Price history
+52.7% since first listed22 events — show timeline
- 2026-05-03 Pending — FORTMLS
- 2026-04-20 Price Changed $259,500 FORTMLS
- 2026-03-30 Listed $274,500 FORTMLS
- 2025-02-21 Price Changed $299,999 FORTMLS
- 2024-08-01 Rental Removed $2,200 Avail
- 2024-07-10 Price Changed $2,200 Avail
- 2024-07-01 Listed for Rent $2,400 Avail
- 2024-06-02 Listing Removed — FORTMLS
- 2024-05-14 Price Changed $315,000 FORTMLS
- 2024-03-05 Price Changed $389,900 FORTMLS
- 2023-12-09 Listed $394,900 FORTMLS
- 2023-07-07 Sold (Public Records) $220,000 Public Records
- 2023-07-06 Sold (MLS) $220,000 FORTMLS
- 2023-06-22 Pending — FORTMLS
- 2023-05-23 Price Changed $249,900 FORTMLS
- 2023-05-21 Listed $24,990 FORTMLS
- 2015-09-25 Price Changed $165,000 FORTMLS
- 2015-09-21 Sold (Public Records) $165,000 Public Records
- 2015-09-18 Sold (MLS) $165,000 FORTMLS
- 2015-09-18 Price Changed $169,900 FORTMLS
- 2015-08-04 Pending — FORTMLS
- 2015-07-29 Listed $169,900 FORTMLS
Property tax history
+5.6%/yrLatest (2025): $3,457 · +6.4% YoY. Source: county tax records.
Cash-flow waterfall
monthlySold comps — $/sqft
last 12 mo · ≤1 miLoading sold comps…