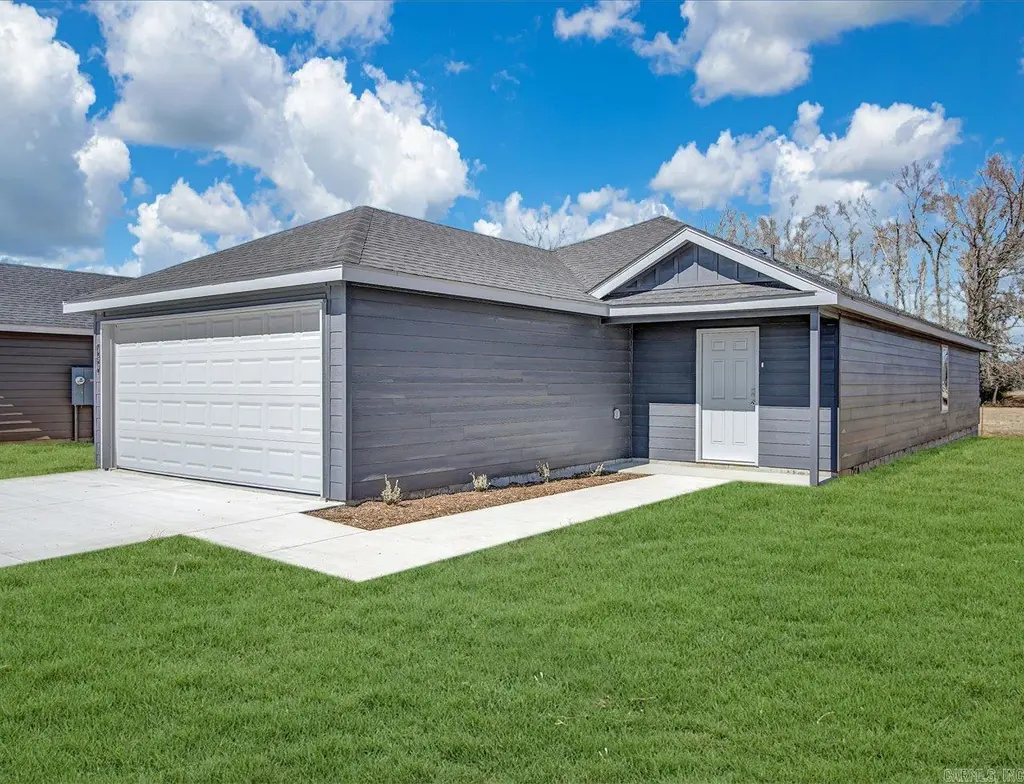
290 Moonlight Graham Blvd · Ward, AR
Flood risk 1/10 · Minimal
- FEMA flood zone
- X (unshaded)
- Chance of flooding over 30 yrs
- 0.0%
- Est. flood insurance / yr
- $507 – $1,088
Fire risk 5/10 · Moderate
- Est. fire insurance / yr
- $1,499 – $2,785
Heat risk 6/10 · Moderate
- Hot days now (above 109°F)
- 7 days/yr
- Hot days in 30 yrs
- 19 days/yr
Wind risk 3/10 · Minor
- Chance of severe wind over 30 yrs
- 8.0%
Air-quality risk 2/10 · Minimal
- Unhealthy air days now
- 1 days/yr
- Unhealthy air days in 30 yrs
- 1 days/yr
Risk factors via First Street. Map © Google.
Why this score? — see what drove the D- grade
The composite is a weighted blend of 9 inputs, each scored 0–100. Each bar is that input's sub-score; the figure is the points it added to the 100-point composite (weight × sub-score).
- Appreciation +7.7/10.0
- Cash flow +7.0/30.0
- ARV discount +6.6/15.0
- Schools +4.0/10.0
- Livability +3.5/5.0
- Rent growth +2.5/5.0
- Condition / age +2.5/5.0
- 1% rule +2.1/10.0
- DSCR +1.2/10.0
$215,000
🖨 Deal sheet 📄 Offer letter ✓ Due diligence
Listing remarks
Exquisite Elkins plan in Moonlight Meadows, located in Ward, AR! These new construction homes feature modern finishes for comfortable living! Homes will have LVP flooring and carpet. In the kitchen and bathrooms, you’ll find beautiful granite countertops. Each home will feature Hardie® siding per plan. These homes come with a programmable thermostat! 10-year limited Homebuyer’s Warranty! Photos may be stock photos, representative of plan only and may vary as built. Annual taxes is an estimate. Taxes are TBD. HOA fees $300! $75 HOA transfer fee. Special Improvement Tax of $495 annually.
Key facts
- Hardie siding
- Lvp flooring
- Granite countertops
Tags
Property features AI
Finance
- Financial info: Financing available: VA, FHA, Conventional, or Cash; Annual special improvement tax: $495
- HOA & community: Annual association fee of $300
Exterior
- Parking: Attached garage for 2 cars
- Utilities: Public water; Public sewer; Electric service
- Home design: New construction; Single-family property
- Construction: Slab foundation; Built by D.R. Horton
- Exterior features: Hardie board exterior; Architectural shingle roof; Paved road access; Lot in subdivision
Interior
- Kitchen: Microwave; Electric range; Dishwasher
- Flooring: Carpet; Luxury vinyl
- Bathrooms: 2 full bathrooms
- Heating & cooling: Central electric heating; Central electric cooling; Programmable thermostat
- Interior features: Washer connection; Electric dryer connection; Smoke detectors; Granite slab kitchen counters
- Laundry & utility: Washer connection; Electric dryer connection
Neighborhood map
What this means for you Summary
Snapshot
- This is a 4-bed/2.0-bath single-family listed at $215k.
Deal economics
- At list price, monthly cash flow is $-311 ($-4k/yr) — negative.
- To cash-flow at today's rent, offer at most $170k (21.0% below list).
- To meet the 1% rule (rent ≥ 1% of price), the offer needs to be $152k (29.4% below list).
- Recommended offer: $152k (29.4% below list) — sets the bar for 1% rule.
Location & tenants
- Location reads 69/100 on livability (#66 in AR) — a middle-class / working-renter tenant base. Strengths: cost of living A+, housing A+, crime B; Watch: amenities F, commute F.
- Cabot School District (suburban): math 48% / reading 43% proficiency, ranked #29 of 238 in AR (top 12%) — families likely to look elsewhere, expect single-tenant / working-renter base with shorter leases.
- Zoned schools: Ward Central Elementary (math 57% / reading 42%, grade D, #93 of 454 statewide, top 23%, 494 students, 62% FRL); Cabot High School (math 29% / reading 45%, grade F, #64 of 292 statewide, top 26%, 2,198 students, 36% FRL) — zoned schools average 49% FRL vs 30% district-wide (19 pts higher); higher-poverty schools than district average — tighter screening recommended.
- Market conditions: 147 active listings in the ZIP; 11 comparable units currently listed for rent nearby; rentals at typical pace (median 23d on market — plan ~3-4 weeks tenant-placement turnaround); 185 units permitted in Lonoke County in 2024 (0 in 5+ unit buildings).
Forward outlook
- In year one you build about $13k of equity ($1k loan paydown + $12k appreciation (5.3% local appreciation)).
- Lonoke County population projected at +12% by 2050 — modest demand growth; plan on rents tracking national, not racing it.
- By year 3, paydown + projected appreciation supports a ~$32k cash-out refi (75% LTV) — recoverable capital for the next deal without selling this one.
Negotiation context
- It's been on market 29 days — a 2% lower offer ($212k) is reasonable based on typical stale-listing flexibility.
Risks & watch-outs
- Climate carrying-cost: moderate wildfire risk; extreme-heat days projected 7→19/yr by 2055 (HVAC capex compounding) — expect insurance premiums to compound above CPI over the hold.
Questions for the listing agent
- What do current leases actually rent for vs. the listed asking? Can we see a recent rent roll and the last 12 months of T-12 income?
- What does the HOA fee cover, when was the last increase, and are there any pending special assessments or reserve-fund shortfalls?
- Is there a deadline driving the sale (1031 exchange, divorce, estate, relocation)? That informs how much negotiation room exists.
- The area grade is low — what's the realistic commute time and amenity access for the typical tenant pool here? Any planned neighborhood developments (good or bad) we should know about?
- What's the average days-on-market for RENTAL listings here right now (not sales)? A rising rental-DOM trend means longer vacancies and softer asking-rent achievability than the comps imply.
- What's the recent tenant-quality profile in this submarket — average credit score on applications, eviction rate, late-payment / NSF rate, and stable-employment percentage? A property-management company in the area should have these aggregated.
- How much new for-sale + rental construction is in the pipeline within 1–3 miles? Heavy new supply typically softens prices + rents 12–24 months out; constrained supply supports both.
Investment metrics
- 1% rule
- 0.71% ✗
- Cap rate
- 4.55%
- Cash-on-cash
- -6.21%
- DSCR
- 0.72
- GRM
- 11.8
CMA / ARV
- ARV (on-the-fly)
- $210,938
- Comps found
- 12
Show comp detail 12 sales within ~0.75 mi
| Address | Dist | Beds/Ba | Sqft | Sold | Price | $/sf | Match |
|---|---|---|---|---|---|---|---|
| 420 Moonlight Graham Blvd | 0.13mi | 4/2.0 | 1,586 (0%) | 1mo | $215,000 | $136 | 93 |
| 450 Moonlight Graham Blvd | 0.16mi | 4/2.0 | 1,586 (0%) | 3mo | $200,000 | $126 | 90 |
| 490 Moonlight Graham Blvd | 0.19mi | 4/2.0 | 1,586 (0%) | 2mo | $204,000 | $129 | 89 |
| 341 Moonlight Graham Blvd | 0.34mi | 4/2.0 | 1,586 (0%) | 1mo | $193,000 | $122 | 83 |
| 391 Moonlight Graham Blvd | 0.34mi | 4/2.0 | 1,586 (0%) | 1mo | $193,000 | $122 | 83 |
| 460 Moonlight Graham Blvd | 0.34mi | 3/2.5 (-1) | 1,489 (-6%) | 1mo | $200,000 | $134 | 67 |
| 3 Moonlight Cv | 0.22mi | 3/2.0 (-1) | 1,485 (-6%) | 9mo | $197,900 | $133 | 67 |
| 7 Sunshine Ln | 0.34mi | 4/2.0 | 1,449 (-9%) | 4mo | $192,000 | $133 | 66 |
| 500 Moonlight Graham Blvd | 0.34mi | 3/2.5 (-1) | 1,489 (-6%) | 4mo | $211,000 | $142 | 64 |
| 31 Crosswind Cv | 0.28mi | 3/2.0 (-1) | 1,767 (+11%) | 3mo | $230,000 | $130 | 61 |
| 480 Moonlight Graham Blvd | 0.31mi | 3/2.0 (-1) | 1,435 (-10%) | 5mo | $196,000 | $137 | 61 |
| 19 Libra Ln | 0.65mi | 4/2.0 | 1,773 (+12%) | 7mo | $309,000 | $174 | 44 |
Match score weights: distance 35% · size 25% · config 20% · recency 20%. Top-matched comps best support the ARV.
Projected returns pro-forma
5.35% appreciation · 3.0% rent growth · sell at horizon
- IRR
- 8.6%
- Equity multiple
- 1.57×
- Total profit
- $34,134
- Equity at exit
- $126,495
- IRR
- 10.3%
- Equity multiple
- 2.97×
- Total profit
- $118,490
- Equity at exit
- $222,264
Cash invested: $60,200 (down + closing). Projections, not guarantees.
Landlord ↔ Tenant lean methodology
- Overall (STATE)
- 92 Strongly Landlord-Friendly
- State Arkansas
- 92 Strongly Landlord-Friendly · R+14
- County
- — inherits STATE
- City
- — inherits STATE
ZIP-level market 72176
- Home prices YoY
- 2.6%
- Active inventory
- 147
- Price-to-rent
- 11.8×
Monthly cashflow live
- Estimated rent
- $1,518 high interval (Pro) →
- Mortgage (P&I)
- −$1,127
- Tax est. 1.5%
- −$269 /mo · $3,225/yr
- Insurance
- −$90
- HOA
- −$25
- Vacancy / Maint / Mgmt
- −$319
- Net cashflow
- $-311
Break-even live
UW: 25.0% down · 7.5% · 30yr · 1.5% tax · 5.0% vac · 8.0% maint · 8.0% mgmt
Financing live
Cash to close
- Down payment
- $53,750
- Closing costs
- $6,450
- Reserves months
- —
- Total cash needed
- —
Loan-product check · same deal, 3 products live
Conventional
25% down · 7.5% · 30yr
- Down + closing
- —
- Monthly P&I
- —
- Monthly cashflow
- —
- DSCR
- —
- Eligible?
- —
Personal DTI + credit; lowest rate.
DSCR
20% down · 8.5% · 30yr
- Down + closing
- —
- Monthly P&I
- —
- Monthly cashflow
- —
- DSCR
- —
- Eligible?
- —
No personal income docs; deal must DSCR.
Hard money
10% down · 12.0% · 12mo
- Down + closing
- —
- Monthly P&I
- —
- Monthly cashflow
- —
- DSCR
- —
- Eligible?
- —
Short-term bridge; refi at stabilization.
Rent comps 11 comps
| Address | Beds | Baths | Sqft | Rent | $/sqft | DOM | Units | Dist |
|---|---|---|---|---|---|---|---|---|
| 12 Gold Meadows Loop Ward, AR | 3.0 | 2.0 | 1484 | $1,300 | $0.88 | 23d | 1 | 0.16mi |
| 21 Windsor Park Dr Ward, AR | 3.0 | 2.0 | 1442 | $1,500 | $1.04 | 23d | 1 | 0.43mi |
| 21 Weatherwood Ward, AR | 3.0 | 2.0 | 1156 | $1,300 | $1.12 | 23d | 1 | 0.57mi |
| 29 Green Apple Ward, AR | 3.0 | 2.0 | 1200 | $1,450 | $1.21 | 18d | 1 | 0.66mi |
| 23 Green Apple Ward, AR | 3.0 | 2.0 | 1212 | $1,450 | $1.20 | 23d | 1 | 0.68mi |
| 65 Birchwood Dr Ward, AR | 3.0 | 2.0 | 1302 | $1,650 | $1.27 | 21d | 1 | 0.96mi |
| 21 Kasidyann Ct Ward, AR | 4.0 | 2.0 | 1415 | $1,795 | $1.27 | 23d | 1 | 1.04mi |
| 561 Brewer St Ward, AR | 3.0 | 2.0 | 1050 | $1,450 | $1.38 | 44d | 1 | 1.17mi |
| 33 Langford St Ward, AR | 3.0 | 2.0 | 1175 | $1,300 | $1.11 | 23d | 1 | 1.37mi |
| 14 Stephens St Ward, AR | 3.0 | 2.0 | 1128 | $1,395 | $1.24 | 43d | 1 | 1.39mi |
| 39 Bud Grimes Rd Ward, AR | 3.0 | 2.0 | 1308 | $1,550 | $1.19 | 18d | 1 | 1.48mi |
HOA detail
- Monthly dues
- $25 · $300/yr
Listing history 16 events
-
2026-06-18days on market $215,000 Active 29 DOM
-
2026-06-17days on market $215,000 Active 28 DOM
-
2026-06-16days on market $215,000 Active 27 DOM
-
2026-06-15days on market $215,000 Active 26 DOM
-
2026-06-14days on market $215,000 Active 24 DOM
-
2026-06-10days on market $215,000 Active 21 DOM
-
2026-06-09days on market $215,000 Active 20 DOM
-
2026-06-08days on market $215,000 Active 19 DOM
-
2026-06-07days on market $215,000 Active 18 DOM
-
2026-06-05days on market $215,000 Active 15 DOM
-
2026-06-03days on market $215,000 Active 14 DOM
-
2026-06-02days on market $215,000 Active 13 DOM
-
2026-06-01days on market $215,000 Active 12 DOM
-
2026-05-31days on market $215,000 Active 11 DOM
-
2026-05-31days on market $215,000 Active 10 DOM
-
2026-05-20$215,000 New Listing
ⓘ Source: listings_history table (triggers on properties + properties_extension) + one-shot
backfill from property_details.listing_events for pre-trigger history.
Climate risk First Street
- Flood 1/10 Low FEMA zone X (unshaded) · 0% chance over 30 yrs
- Wildfire 5/10 Major
- Heat 6/10 Major 7 d/yr ≥109°F today · 19 d/yr by 30 yrs out
- Wind 3/10 Moderate 8% chance of damaging wind over 30 yrs
- Air quality 2/10 Low 1 unhealthy d/yr today · 1 by 30 yrs out
Nearby sold comps map
Loading sold comps map…
Walkable amenities ~0.75 mi
Loading nearby amenities…
Taxation est. · year 1
- Rental income
- $18,218
- − Mortgage interest
- −$12,043
- − Property taxes
- −$3,225
- − Insurance
- −$1,075
- − Repairs & maintenance
- −$1,457
- − Management
- −$1,457
- − HOA
- −$300
- − Depreciation
- −$6,255
- Taxable loss
- −$7,595
- Est. tax savings @ 24.0%
- +$1,823
- After-tax cash flow
- $-1,915/yr
For passive investors: Depreciation is non-cash, so a rental often shows a tax loss while cash-flowing — sheltering income. Rental losses are passive: they offset passive income freely, and up to $25,000/yr can offset ordinary (W-2) income if you actively participate and your MAGI is under $100k (phasing out to $0 by $150k); unused losses carry forward. On sale, claimed depreciation is recaptured at up to 25%, and gains may owe capital-gains tax (a 1031 exchange can defer both). Figures are a year-1 estimate at your 24.0% rate — not tax advice; consult a CPA.
Schools (NCES district)
- District
- Cabot School District
- NCES district ID
- 0503750
- Math proficiency
- 48% ▼ -14.00%
- Reading proficiency
- 43% ▼ -10.00%
- Median HH income
- $55,993
- Composite
- 39.66/100
- National rank
- #3912
- State rank
- #29 of 238 in AR
Livability — Ward
- Score
- 69/100
- State rank
- #66
- US rank
- #8464
Category grades
Schools grade is shown separately in the Schools card above.
Census & demographics
- County
- Lonoke County · 46,130 people
- City population
- 8,678
- Metro
- Little Rock-North Little Rock-Conway, AR
- Population (ZIP)
- 8,678
- Household income
- $68,840
- Rent vs Own
- Severe rent burden
- 90.0
Population outlook (Lonoke County) Hauer SSP2
- Today (2025)
- 78,072 people
- By 2030
- 80,673 · +3.3%
- By 2040
- 84,977 · +8.8%
- By 2050
- 87,778 · +12.4%
- By 2075
- 91,398 · +17.1%
- By 2100
- 87,858 · +12.5%
Race, ethnicity, and origin ACS 2023
- Neighborhood character
- Predominantly White (85%)
- Race & ethnicity
- White 85% Two or more races 7% Hispanic / Latino 6% Black 2% Asian 1%
- Hispanic origin (detail)
- Mexican 2%
- Common ancestry
- Russian 2% Iranian 1% Slovak 1%
- Foreign-born
- 2% · Canada
- Languages at home
- 95% English-only · Spanish 3% Tagalog/Filipino 1% German/W. Germanic 1%
Political lean MEDSL · Lonoke
- 2024 margin
- Solid R (+53.7) · D 22.2% · R 75.8% · Other 2.0%
- 2008→2024 swing
- -6.2pp toward R · 2008: -47.5pp · 2024: -53.7pp
- All cycles
- 2024: R+53.7 2020: R+52.8 2016: R+53.3 2012: R+50.9 2008: R+47.5
Not yet ingested
- Civics
- —
Market trends
- HPI YoY
- ▲ 5.35%
- Current HPI
- 208.9387
- Rent YoY
- —
- Metro
- Little Rock-North Little Rock-Conway, AR
- State GDP YoY
- ▲ 3.80%
- F500 in state
- 10
Industry mix (Fortune 500 HQ in AR)
| Industry | F500 HQs | Revenue |
|---|---|---|
| Retail | 1 | $681B |
|
||
| Food / Agriculture | 1 | $53B |
|
||
| Retail / Energy | 1 | $22B |
|
||
| Transportation / Logistics | 1 | $12B |
|
||
| Energy | 1 | $4B |
|
||
Price history
1 event — show timeline
- 2026-05-20 Listed $215,000 CARMLS
Cash-flow waterfall
monthlySold comps — $/sqft
last 12 mo · ≤1 miLoading sold comps…