 🏗️ New Construction
Silver Springs Plan · Leesburg, FL
Flood risk 1/10 · Minimal
- FEMA flood zone
- X (unshaded)
- Chance of flooding over 30 yrs
- 0.0%
- Est. flood insurance / yr
- $507 – $1,088
Fire risk 3/10 · Minor
- Est. fire insurance / yr
- $947 – $1,759
Heat risk 8/10 · Major
- Hot days now (above 108°F)
- 7 days/yr
- Hot days in 30 yrs
- 22 days/yr
Wind risk 9/10 · Severe
- Chance of severe wind over 30 yrs
- 99.0%
Air-quality risk 2/10 · Minimal
- Unhealthy air days now
- 1 days/yr
- Unhealthy air days in 30 yrs
- 1 days/yr
Risk factors via First Street. Map © Google.
Why this score? — see what drove the C- grade
The composite is a weighted blend of 9 inputs, each scored 0–100. Each bar is that input's sub-score; the figure is the points it added to the 100-point composite (weight × sub-score).
- Cash flow +18.9/30.0
- ARV discount +7.5/15.0
- DSCR +5.9/10.0
- 1% rule +5.0/10.0
- Schools +4.2/10.0
- Condition / age +4.0/5.0
- Livability +3.1/5.0
- Rent growth +2.3/5.0
- Appreciation +0.0/10.0
$169,900
🖨 Deal sheet (PDF) 📄 Offer letter ✓ Due diligence
Listing remarks
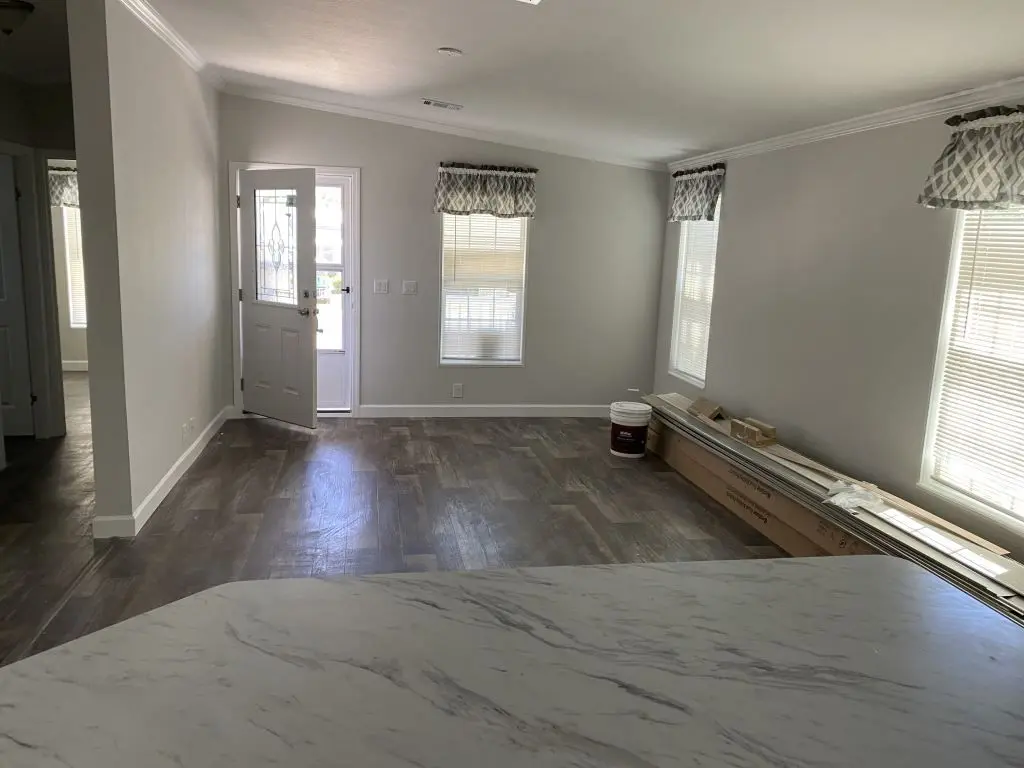
55+ age qualified community. COMING SOON! Currently under construction. Welcome to Coachwood Colony, a 55+ age-qualified active and vibrant community, where your dream home is coming to life. We are excited to offer a brand new, 2026 3 bed, 2 bath home for sale, featuring approximately 1355 sq ft of thoughtfully designed living space. Located in Leesburg, this soon-to-be-completed property will offer the perfect blend of modern design and timeless comfort. Construction is underway, and soon you'll be able to step inside and experience an open-concept floor plan and plenty of natural light. The gorgeous kitchen will be beautifully designed with custom cabinetry, ideal for both everyday livin
Key facts
- Listed 58 days
Property features AI
Finance
- Financial info: List price $169,900
Exterior
- Home design: Single-family home (Plan: Silver Springs)
- Exterior features: Living area approximately 1,355 (living area provided)
Interior
- Bedrooms: 3 bedrooms
- Bathrooms: 2 full bathrooms
- Interior features: Plan: Silver Springs (new construction plan)
Neighborhood map
What this means for you Summary
Snapshot
- This is a 3-bed/2.0-bath manufactured listed at $170k. Condition is rated good.
Deal economics
- At list price, monthly cash flow is $173 ($2k/yr) — positive.
- The deal already cash-flows at list — no discount required.
- Meets the 1% rule at list price ($2k rent vs $170k).
- Recommended offer: $165k (3.0% below list) — sets the bar for market timing.
- Cap rate 7.5% vs local median 4.4% in Leesburg — top-decile yield for the area; either an underpriced asset or a hidden risk that comps aren't pricing in. Stress-test before assuming the spread holds.
Location & tenants
- Location reads 62/100 on livability (#751 in FL) — a middle-class / working-renter tenant base. Strengths: cost of living A+, housing A+; Watch: crime D, amenities F, commute F.
- Lake (suburban): math 49% / reading 50% proficiency, ranked #37 of 73 in FL (top 51%) — families likely to look elsewhere, expect single-tenant / working-renter base with shorter leases.
- Zoned schools: Leesburg Elementary School (math 31% / reading 32%, grade F, #1,841 of 2,144 statewide, top 86%, 822 students, 71% FRL); Oak Park Middle School (math 32% / reading 36%, grade F, #426 of 571 statewide, top 75%, 575 students, 70% FRL); Leesburg High School (math 24% / reading 32%, grade F, #464 of 667 statewide, top 70%, 1,641 students, 58% FRL) — zoned schools average 66% FRL vs 49% district-wide (17 pts higher); higher-poverty schools than district average — tighter screening recommended.
- Zoned-school proficiency averages 31% at this address vs 50% district-wide (-18 pts) — the specific schools serving this property underperform the Lake average; the district grade overstates school quality for this exact location.
- Market conditions: Rents soft (-0.9%/yr); 798 active listings in the ZIP; 21 comparable units currently listed for rent nearby; rentals leasing fast (median 7d on market — plan ~1-2 weeks tenant-placement turnaround); 4,799 units permitted in Lake County in 2024 (814 in 5+ unit buildings).
- This rent runs 35% of the median local income ($58k/yr) — at the standard rent-burdened threshold; future hikes will face affordability resistance.
Forward outlook
- Local home prices are declining (-3.0%/yr); year-one equity from $1k of loan paydown is wiped out by about $5k of value loss. Plan a longer hold.
- Lake County population projected at +37% by 2050 — long-run rental-demand tailwind backs the buy-and-hold thesis.
Negotiation context
- It's been on market 58 days — a 3% lower offer ($165k) is reasonable based on typical stale-listing flexibility.
Risks & watch-outs
- Climate carrying-cost: severe wind risk, 99% chance of damaging wind over 30y; extreme-heat days projected 7→22/yr by 2055 (HVAC capex compounding) — expect insurance premiums to compound above CPI over the hold.
Questions for the listing agent
- It's been on market 58 days. Have you received any prior offers? Is the seller open to a 3% concession, seller financing, or rate buy-down credit?
- Is there a deadline driving the sale (1031 exchange, divorce, estate, relocation)? That informs how much negotiation room exists.
- Schools are D-rated, which usually means shorter tenancies and higher turnover. Who's the typical renter profile here, and what's been the actual vacancy rate?
- Crime grade is D in this area — have there been break-ins, vandalism, or insurance claims at this property in the last 3 years? What carrier currently insures it and at what premium?
- What's the average days-on-market for RENTAL listings here right now (not sales)? A rising rental-DOM trend means longer vacancies and softer asking-rent achievability than the comps imply.
- What's the recent tenant-quality profile in this submarket — average credit score on applications, eviction rate, late-payment / NSF rate, and stable-employment percentage? A property-management company in the area should have these aggregated.
- How much new for-sale + rental construction is in the pipeline within 1–3 miles? Heavy new supply typically softens prices + rents 12–24 months out; constrained supply supports both.
Investment metrics
- 1% rule
- 1.00% ✓
- Cap rate
- 7.51%
- Cash-on-cash
- 4.36%
- DSCR
- 1.19
- GRM
- 8.3
CMA / ARV
No comps found within radius.
Projected returns pro-forma
-3.0% appreciation · 0.0% rent growth · sell at horizon
- IRR
- -12.9%
- Equity multiple
- 0.55×
- Total profit
- $-21,493
- Equity at exit
- $25,333
- IRR
- -9.4%
- Equity multiple
- 0.50×
- Total profit
- $-23,747
- Equity at exit
- $14,690
Cash invested: $47,572 (down + closing). Projections, not guarantees.
Landlord ↔ Tenant lean methodology
- Overall (STATE)
- 87 Strongly Landlord-Friendly
- State Florida
- 87 Strongly Landlord-Friendly · R+3
- County
- — inherits STATE
- City
- — inherits STATE
ZIP-level market 34748
- Home prices YoY
- -25.3%
- Rents YoY
- -0.9%
- Active inventory
- 798
- Price-to-rent
- 8.3×
Monthly cashflow live
- Estimated rent
- $1,705 high interval (Pro) →
- Mortgage (P&I)
- −$891
- Tax est. 1.5%
- −$212 /mo · $2,548/yr
- Insurance
- −$71
- HOA
- −$0
- Vacancy / Maint / Mgmt
- −$358
- Net cashflow
- $173
Break-even live
Sensitivity live
| Price | -10% $290 | -5% $232 | +0% $173 | +5% $114 | +10% $55 |
|---|---|---|---|---|---|
| Rent | -10% $38 | -5% $105 | +0% $173 | +5% $240 | +10% $308 |
| Rate | -1.0pp $258 | -0.5pp $216 | base $173 | +0.5pp $129 | +1.0pp $84 |
UW: 25.0% down · 7.5% · 30yr · 1.5% tax · 5.0% vac · 8.0% maint · 8.0% mgmt
Financing live
Cash to close
- Down payment
- $42,475
- Closing costs
- $5,097
- Reserves months
- —
- Total cash needed
- —
Loan-product check · same deal, 3 products live
Conventional
25% down · 7.5% · 30yr
- Down + closing
- —
- Monthly P&I
- —
- Monthly cashflow
- —
- DSCR
- —
- Eligible?
- —
Personal DTI + credit; lowest rate.
DSCR
20% down · 8.5% · 30yr
- Down + closing
- —
- Monthly P&I
- —
- Monthly cashflow
- —
- DSCR
- —
- Eligible?
- —
No personal income docs; deal must DSCR.
Hard money
10% down · 12.0% · 12mo
- Down + closing
- —
- Monthly P&I
- —
- Monthly cashflow
- —
- DSCR
- —
- Eligible?
- —
Short-term bridge; refi at stabilization.
Rent comps 21 comps
| Address | Beds | Baths | Sqft | Rent | $/sqft | DOM | Units | Dist |
|---|---|---|---|---|---|---|---|---|
| 2602 Houston Pl Leesburg, FL | 2.0 | 2.0 | 960 | $1,895 | $1.97 | 6d | 1 | 0.18mi |
| 513 Old Colony Rd Leesburg, FL | 3.0 | 2.0 | 1198 | $1,699 | $1.42 | 6d | 1 | 0.39mi |
| 502 Old Colony Rd Leesburg, FL | 3.0 | 2.0 | 1456 | $1,299 | $0.89 | 25d | 1 | 0.43mi |
| 1004 Royal Oak Blvd Unit 1004 Leesburg, FL | 2.0 | 2.5 | 1244 | $1,550 | $1.25 | 5d | 1 | 0.43mi |
| 822 S Lone Oak Dr Unit B Leesburg, FL | 2.0 | 1.0 | 900 | $1,195 | $1.33 | 25d | 1 | 0.44mi |
| 824 S Lone Oak Dr Unit A Leesburg, FL | 2.0 | 1.0 | 900 | $1,195 | $1.33 | 0d | 1 | 0.44mi |
| 2920 Pecan Ave Leesburg, FL | 2.0 | 2.5 | 1288 | $1,700 | $1.32 | 25d | 1 | 0.45mi |
| 2940 Peach St Leesburg, FL | 2.0 | 2.5 | 1288 | $1,750 | $1.36 | 19d | 1 | 0.49mi |
| 1125 Apple Ter Unit 1125 Leesburg, FL | 3.0 | 2.0 | 1450 | $1,695 | $1.17 | 0d | 1 | 0.51mi |
| 3019 Walnut Ct Leesburg, FL | 3.0 | 2.0 | 1854 | $1,799 | $0.97 | 4d | 1 | 0.58mi |
| 3019 Walnut Ct Leesburg, FL | 3.0 | 2.0 | 1854 | $1,799 | $0.97 | 0d | 1 | 0.58mi |
| 3029 Walnut Ct Leesburg, FL | 3.0 | 2.0 | 1854 | $1,799 | $0.97 | 6d | 1 | 0.59mi |
| 3029 Walnut Ct Leesburg, FL | 3.0 | 2.0 | 1854 | $1,799 | $0.97 | 4d | 1 | 0.59mi |
| 210 N Lone Oak Dr Unit 1 Leesburg, FL | 2.0 | 1.0 | 912 | $1,250 | $1.37 | 16d | 1 | 0.93mi |
| 1321 Cambridge Dr Leesburg, FL | 4.0 | 2.0 | 912 | $1,800 | $1.97 | 19d | 1 | 0.94mi |
| 1604 Woodlyn Dr Leesburg, FL | 3.0 | 1.5 | 1088 | $1,500 | $1.38 | 25d | 1 | 0.94mi |
| 1317 Cambridge Dr Leesburg, FL | 3.0 | 1.5 | 1240 | $1,600 | $1.29 | 25d | 1 | 0.95mi |
| 200 S Moss St Leesburg, FL | 3.0 | 2.0 | 968 | $1,500 | $1.55 | 25d | 1 | 1.02mi |
| 1220 W Dixie Ave Leesburg, FL | 3.0 | 2.0 | 1304 | $1,600 | $1.23 | 6d | 1 | 1.28mi |
| 1401 Floradel Ave Leesburg, FL | 2.0 | 1.0 | 1190 | $1,495 | $1.26 | 5d | 1 | 1.38mi |
| 1403 Old Harbor Blvd Leesburg, FL | 1.0–4.0 | 1.0–3.0 | 1079 | $1,532 | $1.42 | 0d | 8 | 1.40mi |
Listing history 14 events
-
2026-06-21days on market $169,900 Active 58 DOM
-
2026-06-18days on market $169,900 Active 55 DOM
-
2026-06-17days on market $169,900 Active 54 DOM
-
2026-06-16days on market $169,900 Active 53 DOM
-
2026-06-15days on market $169,900 Active 52 DOM
-
2026-06-13days on market $169,900 Active 50 DOM
-
2026-06-09days on market $169,900 Active 46 DOM
-
2026-06-08days on market $169,900 Active 45 DOM
-
2026-06-07days on market $169,900 Active 44 DOM
-
2026-06-04days on market $169,900 Active 41 DOM
-
2026-06-03days on market $169,900 Active 40 DOM
-
2026-06-02days on market $169,900 Active 39 DOM
-
2026-06-02days on market $169,900 Active 38 DOM
-
2026-05-31days on market $169,900 Active 37 DOM
ⓘ Source: listings_history table (triggers on properties + properties_extension) + one-shot
backfill from property_details.listing_events for pre-trigger history.
Climate risk First Street
- Flood 1/10 Low FEMA zone X (unshaded) · 0% chance over 30 yrs
- Wildfire 3/10 Moderate
- Heat 8/10 Severe 7 d/yr ≥108°F today · 22 d/yr by 30 yrs out
- Wind 9/10 Extreme 99% chance of damaging wind over 30 yrs
- Air quality 2/10 Low 1 unhealthy d/yr today · 1 by 30 yrs out
Nearby sold comps map
Loading sold comps map…
Walkable amenities ~0.75 mi
Loading nearby amenities…
Taxation est. · year 1
- Rental income
- $20,461
- − Mortgage interest
- −$9,517
- − Property taxes
- −$2,548
- − Insurance
- −$850
- − Repairs & maintenance
- −$1,637
- − Management
- −$1,637
- − Depreciation
- −$4,943
- Taxable loss
- −$671
- Est. tax savings @ 24.0%
- +$161
- After-tax cash flow
- $2,235/yr
For passive investors: Depreciation is non-cash, so a rental often shows a tax loss while cash-flowing — sheltering income. Rental losses are passive: they offset passive income freely, and up to $25,000/yr can offset ordinary (W-2) income if you actively participate and your MAGI is under $100k (phasing out to $0 by $150k); unused losses carry forward. On sale, claimed depreciation is recaptured at up to 25%, and gains may owe capital-gains tax (a 1031 exchange can defer both). Figures are a year-1 estimate at your 24.0% rate — not tax advice; consult a CPA.
Condition & rehab AI · 12 photos
This home is nearly move-in ready with a good condition score and a cosmetic rehab level. It offers a good investment opportunity with potential for increased value through exterior painting and landscaping.
Value-add opportunities
- Both Painting exterior — Enhances curb appeal and resale value
- Both Landscaping — Improves curb appeal and rental value
- Both Add smart home features — Enhances home's appeal and rental value
Renovation cost estimate screening
Value-add ROI direction
- Both Painting exterior — Enhances curb appeal and resale value ↑
- Both Landscaping — Improves curb appeal and rental value ↑
- Both Add smart home features — Enhances home's appeal and rental value ↑
ⓘ Cost ranges are severity-bucket heuristics (US national rule-of-thumb). Get contractor quotes + a written scope before underwriting a rehab budget.
Schools (NCES district)
- District
- Lake
- NCES district ID
- 1201050
- Math proficiency
- 49% ▼ -7.00%
- Reading proficiency
- 50% ▼ -4.00%
- Median HH income
- $46,632
- Composite
- 42.05/100
- National rank
- #3327
- State rank
- #37 of 73 in FL
Livability — Leesburg
- Score
- 62/100
- State rank
- #751
- US rank
- #16429
Category grades
Schools grade is shown separately in the Schools card above.
Census & demographics
- Census place
- Leesburg, FL
- County
- Lake County · 364,602 people
- City population
- 70,232
- Metro
- Orlando-Kissimmee-Sanford, FL
- Population (ZIP)
- 48,095
- Household income
- $58,192
- Rent vs Own
- Severe rent burden
- 1745.0
Population outlook (Lake County) Hauer SSP2
- Today (2025)
- 386,640 people
- By 2030
- 417,107 · +7.9%
- By 2040
- 476,676 · +23.3%
- By 2050
- 531,296 · +37.4%
- By 2075
- 648,303 · +67.7%
- By 2100
- 698,530 · +80.7%
Race, ethnicity, and origin ACS 2023
- Neighborhood character
- Majority White (64%)
- Race & ethnicity
- White 64% Black 16% Hispanic / Latino 15% Two or more races 9% Asian 1%
- Hispanic origin (detail)
- Mexican 4% Puerto Rican 5% Cuban 3%
- Common ancestry
- Romanian 3% Lithuanian 3% Slovak 2%
- Foreign-born
- 9% · Canada, Vietnam, Jamaica
- Languages at home
- 88% English-only · Spanish 10% French/Haitian/Cajun 1%
Political lean MEDSL · Lake
- 2024 margin
- Strong R (+24.7) · D 37.3% · R 62.0%
- 2008→2024 swing
- -11.2pp toward R · 2008: -13.5pp · 2024: -24.7pp
- All cycles
- 2024: R+24.7 2020: R+20.0 2016: R+23.1 2012: R+17.1 2008: R+13.5
Not yet ingested
- Civics
- —
Market trends
- HPI YoY
- ▼ -88.97%
- Current HPI
- 262.1766
- Rent YoY
- ▼ -0.95%
- Metro
- Orlando-Kissimmee-Sanford, FL
- State GDP YoY
- ▲ 3.28%
- F500 in state
- 36
Industry mix (Fortune 500 HQ in FL)
| Industry | F500 HQs | Revenue |
|---|---|---|
| Industrial Technology | 2 | $29B |
|
||
| Insurance | 2 | $17B |
|
||
| Retail | 1 | $60B |
|
||
| Technology Distribution | 1 | $58B |
|
||
| Homebuilding | 1 | $35B |
|
||
| Technology Manufacturing | 1 | $35B |
|
||
Cash-flow waterfall
monthlySold comps — $/sqft
last 12 mo · ≤1 miLoading sold comps…