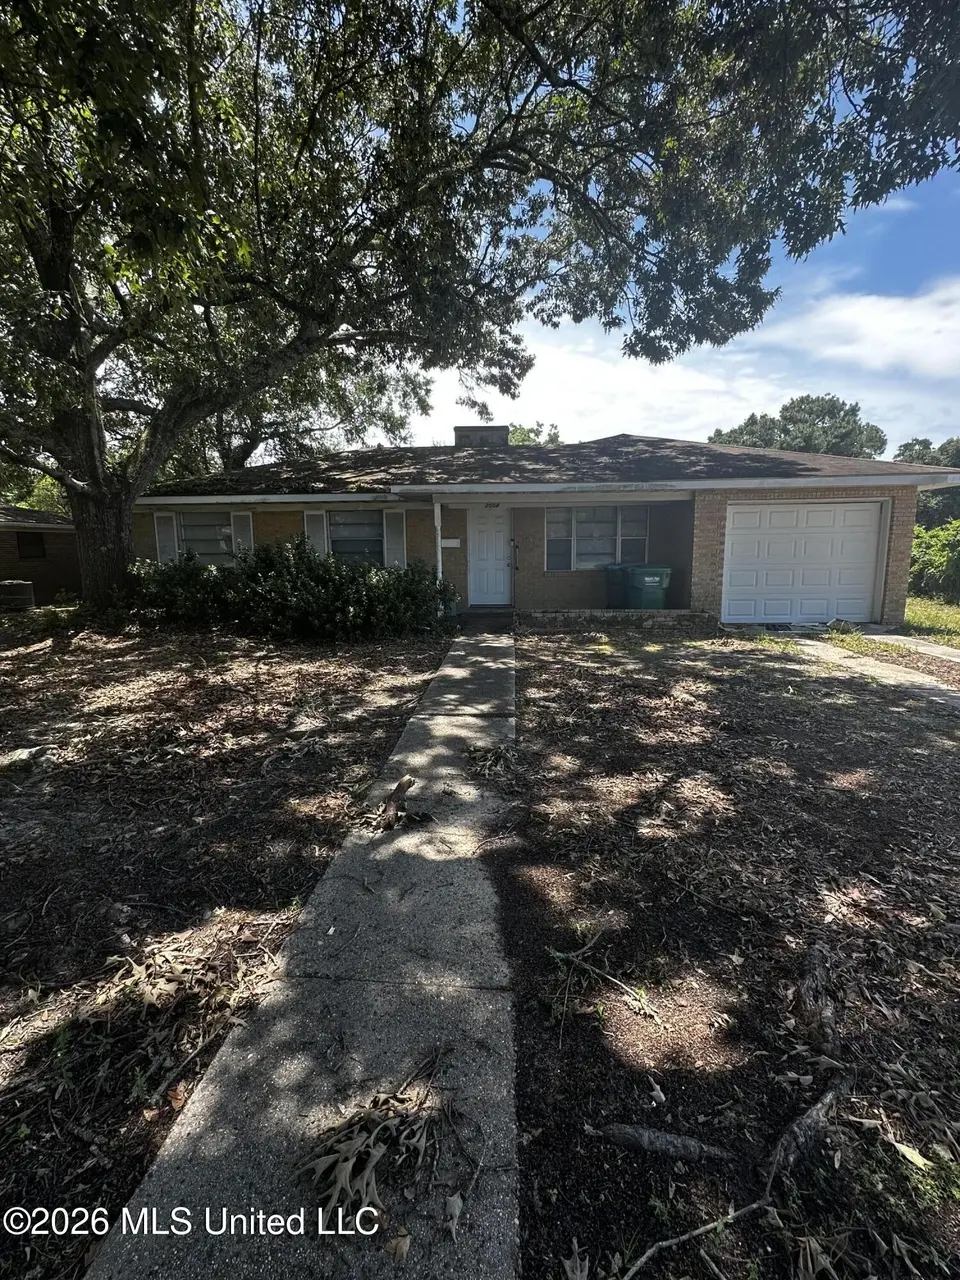
2004 Collins Blvd · Gulfport, MS
Flood risk 1/10 · Minimal
- FEMA flood zone
- X (unshaded)
- Chance of flooding over 30 yrs
- 0.0%
- Est. flood insurance / yr
- $507 – $1,088
Fire risk 1/10 · Minimal
- Est. fire insurance / yr
- $1,241 – $2,305
Heat risk 10/10 · Severe
- Hot days now (above 106°F)
- 7 days/yr
- Hot days in 30 yrs
- 23 days/yr
Wind risk 9/10 · Severe
- Chance of severe wind over 30 yrs
- 99.0%
Air-quality risk 3/10 · Minor
- Unhealthy air days now
- 2 days/yr
- Unhealthy air days in 30 yrs
- 3 days/yr
Risk factors via First Street. Map © Google.
Why this score? — see what drove the B grade
The composite is a weighted blend of 9 inputs, each scored 0–100. Each bar is that input's sub-score; the figure is the points it added to the 100-point composite (weight × sub-score).
- Cash flow +30.0/30.0
- 1% rule +10.0/10.0
- DSCR +10.0/10.0
- ARV discount +7.5/15.0
- Livability +3.7/5.0
- Rent growth +3.6/5.0
- Schools +3.4/10.0
- Condition / age +2.5/5.0
- Appreciation +0.0/10.0
$115,000
🖨 Deal sheet 📄 Offer letter ✓ Due diligence
Listing remarks MLS
Brick Three Bedroom, 1.5 Bath Home close to the Sunny Gulf Coast Beach, Casinos, Shopping, Anniston Elementary School. Large Fenced Back Yd with Shade Trees. Single Carport. Open Floor Plan. Living Rm, Dining Area, Kitchen, & Den with Fireplace. This is a Fannie Mae Homepath property. Come See It!
Key facts
- Desirable location
- Gulf coast beaches
- Investment property
Tags
Property features AI
Finance
- Other: Lot approximately 0.25 acre (about 10,890 sq ft) with dimensions ~75 x 149
Exterior
- Parking: Detached 1-car garage; 1-car carport; Driveway
- Utilities: Public water; Public sewer; Cable available; Electricity connected; Sewer connected
- Home design: Single family residence (house); One level; Fixer condition; Living area reported as 1,656 (per appraiser)
- Construction: Brick construction; Slab foundation; Year built reported from public records
- Exterior features: Asphalt shingle roof; Other exterior features
Interior
- Kitchen: Oven; Refrigerator; Additional kitchen details noted as 'See Remarks'
- Bathrooms: 1 full bathroom; 1 half bathroom (1.5 total)
- Heating & cooling: Central heating; Central air conditioning; Window unit(s); Additional heating/cooling details noted as 'See Remarks'
- Interior features: Oven; Refrigerator; Fireplace in den; Additional interior features noted as 'See Remarks'
Neighborhood map
What this means for you Summary
Snapshot
- This is a 3-bed/1.0-bath single-family listed at $115k.
Deal economics
- At list price, monthly cash flow is $822 ($10k/yr) — positive.
- The deal already cash-flows at list — no discount required.
- Meets the 1% rule at list price ($2k rent vs $115k).
- Cap rate 14.9% vs local median 4.9% in Gulfport — top-decile yield for the area; either an underpriced asset or a hidden risk that comps aren't pricing in. Stress-test before assuming the spread holds.
Location & tenants
- Location reads 73/100 on livability (#15 in MS) — a middle-class / working-renter tenant base. Strengths: cost of living A+, housing A+, health & safety A+; Watch: schools D, amenities F, commute F.
- Gulfport School District (urban): math 41% / reading 42% proficiency, ranked #37 of 130 in MS (top 28%) — families likely to look elsewhere, expect single-tenant / working-renter base with shorter leases; 67% free/reduced lunch — lower-income household profile, screen leases tightly.
- Market conditions: Rents rising fast (+4.3%/yr); 301 active listings in the ZIP; 22 comparable units currently listed for rent nearby; rentals lingering (median 44d on market — plan ~5-8 weeks vacancy on turnover, expect pricing pressure); 59% of comp listings sitting > 30 days — soft ceiling on asking rent; 2,194 units permitted in Harrison County in 2024 (0 in 5+ unit buildings).
- At $2,071/mo this rent would consume 45% of the median local household income ($55k/yr) (locally 1059% of renters already pay >50% of income on rent) — very limited rent-growth headroom before tenants either downsize or default.
Forward outlook
- Local home prices are declining (-3.0%/yr); year-one equity from $795 of loan paydown is wiped out by about $3k of value loss. Plan a longer hold.
- Harrison County population projected at +27% by 2050 — long-run rental-demand tailwind backs the buy-and-hold thesis.
- At projected returns (-3.0% appreciation + 4.3% rent growth), your $32k cash investment doubles in ~4 years — after that, you're playing with house money.
Negotiation context
- Only 6 days on market — expect competitive offers; lowballing is unlikely to land.
- 3 sale attempts since 14y ago with the ask held roughly flat each time — persistent listings suggest the price (not the market) is what's stuck; bring a comps-based counter.
- Current owner paid $47k; list at $115k implies a 145% gain — meaningful room to come down on a strong offer.
Risks & watch-outs
- Watch-outs: built in 1959 — expect roof / HVAC / electrical / plumbing capex.
- Climate carrying-cost: severe wind risk, 99% chance of damaging wind over 30y; extreme-heat days projected 7→23/yr by 2055 (HVAC capex compounding) — expect insurance premiums to compound above CPI over the hold.
Questions for the listing agent
- Built in 1959 — when were the roof, HVAC, electrical panel, plumbing, and water heater last replaced?
- Is there a deadline driving the sale (1031 exchange, divorce, estate, relocation)? That informs how much negotiation room exists.
- Schools are D-rated, which usually means shorter tenancies and higher turnover. Who's the typical renter profile here, and what's been the actual vacancy rate?
- What's the average days-on-market for RENTAL listings here right now (not sales)? A rising rental-DOM trend means longer vacancies and softer asking-rent achievability than the comps imply.
- What's the recent tenant-quality profile in this submarket — average credit score on applications, eviction rate, late-payment / NSF rate, and stable-employment percentage? A property-management company in the area should have these aggregated.
- How much new for-sale + rental construction is in the pipeline within 1–3 miles? Heavy new supply typically softens prices + rents 12–24 months out; constrained supply supports both.
Investment metrics
- 1% rule
- 1.80% ✓
- Cap rate
- 14.88%
- Cash-on-cash
- 30.65%
- DSCR
- 2.36
- GRM
- 4.6
CMA / ARV
- ARV (on-the-fly)
- $232,965
- Comps found
- 12
Show comp detail 12 sales within ~0.75 mi
| Address | Dist | Beds/Ba | Sqft | Sold | Price | $/sf | Match |
|---|---|---|---|---|---|---|---|
| 1311 Redfish Dr | 0.25mi | 3/2.0 | 1,561 (+4%) | 1mo | $291,620 | $187 | 77 |
| 1057 Flounder Way | 0.25mi | 3/2.0 | 1,561 (+4%) | 3mo | $293,695 | $188 | 75 |
| 2305 Anniston Oaks Dr | 0.32mi | 3/2.0 | 1,489 (-1%) | 6mo | $224,999 | $151 | 75 |
| 1085 Township Rd | 0.23mi | 3/2.5 | 1,425 (-5%) | 1mo | $350,000 | $246 | 74 |
| 1304 Redfish Dr | 0.23mi | 3/2.0 | 1,561 (+4%) | 7mo | $290,560 | $186 | 72 |
| 494 Northeast Ave | 0.18mi | 3/2.0 | 1,367 (-9%) | 7mo | $170,000 | $124 | 67 |
| 1300 Redfish Dr | 0.24mi | 3/2.0 | 1,656 (+10%) | 6mo | $293,871 | $177 | 63 |
| 2106 Boardman Blvd | 0.55mi | 3/1.5 | 1,428 (-5%) | 6mo | $177,500 | $124 | 59 |
| 492 Weaver Ave | 0.23mi | 3/2.0 | 1,285 (-14%) | 4mo | $199,000 | $155 | 58 |
| 1419 Georgia Pl | 0.13mi | 4/2.5 (+1) | 1,297 (-14%) | 9mo | $179,000 | $138 | 53 |
| 2407 Collins Blvd | 0.57mi | 3/2.0 | 1,410 (-6%) | 10mo | $175,000 | $124 | 51 |
| 2207 Gregory Blvd | 0.74mi | 3/2.0 | 1,643 (+9%) | 8mo | $209,000 | $127 | 39 |
Match score weights: distance 35% · size 25% · config 20% · recency 20%. Top-matched comps best support the ARV.
Projected returns pro-forma
-3.0% appreciation · 4.26% rent growth · sell at horizon
- IRR
- 26.8%
- Equity multiple
- 2.13×
- Total profit
- $36,451
- Equity at exit
- $17,147
- IRR
- 35.2%
- Equity multiple
- 4.43×
- Total profit
- $110,561
- Equity at exit
- $9,943
Cash invested: $32,200 (down + closing). Projections, not guarantees.
Landlord ↔ Tenant lean methodology
- Overall (STATE)
- 90 Strongly Landlord-Friendly
- State Mississippi
- 90 Strongly Landlord-Friendly · R+11
- County
- — inherits STATE
- City
- — inherits STATE
ZIP-level market 39507
- Home prices YoY
- -27.1%
- Rents YoY
- 4.3%
- Active inventory
- 301
- Price-to-rent
- 4.6×
Monthly cashflow live
- Estimated rent
- $2,071 high interval (Pro) →
- Mortgage (P&I)
- −$603
- Tax from tax record
- −$163 /mo · $1,950/yr
- Insurance
- −$48
- HOA
- −$0
- Vacancy / Maint / Mgmt
- −$435
- Net cashflow
- $822
Break-even live
UW: 25.0% down · 7.5% · 30yr · 1.5% tax · 5.0% vac · 8.0% maint · 8.0% mgmt
Financing live
Cash to close
- Down payment
- $28,750
- Closing costs
- $3,450
- Reserves months
- —
- Total cash needed
- —
Loan-product check · same deal, 3 products live
Conventional
25% down · 7.5% · 30yr
- Down + closing
- —
- Monthly P&I
- —
- Monthly cashflow
- —
- DSCR
- —
- Eligible?
- —
Personal DTI + credit; lowest rate.
DSCR
20% down · 8.5% · 30yr
- Down + closing
- —
- Monthly P&I
- —
- Monthly cashflow
- —
- DSCR
- —
- Eligible?
- —
No personal income docs; deal must DSCR.
Hard money
10% down · 12.0% · 12mo
- Down + closing
- —
- Monthly P&I
- —
- Monthly cashflow
- —
- DSCR
- —
- Eligible?
- —
Short-term bridge; refi at stabilization.
Rent comps 22 comps
| Address | Beds | Baths | Sqft | Rent | $/sqft | DOM | Units | Dist |
|---|---|---|---|---|---|---|---|---|
| 1276 Century Oaks Dr Gulfport, MS | 3.0 | 3.0 | 1283 | $2,100 | $1.64 | 44d | 1 | 0.19mi |
| 1270 Century Oaks Dr Gulfport, MS | 3.0 | 3.0 | 1158 | $1,950 | $1.68 | 44d | 1 | 0.21mi |
| 1229 Century Oaks Dr Gulfport, MS | 3.0 | 3.0 | 1200 | $2,600 | $2.17 | 21d | 1 | 0.23mi |
| 1100 Century Oaks Dr Unit A Gulfport, MS | 3.0 | 3.0 | 1156 | $2,200 | $1.90 | 44d | 1 | 0.25mi |
| 1215 Ocean View Dr Gulfport, MS | 3.0 | 2.0 | 1710 | $2,895 | $1.69 | 21d | 1 | 0.26mi |
| 1131 Century Oaks Dr Gulfport, MS | 3.0 | 3.0 | 1156 | $1,800 | $1.56 | 44d | 1 | 0.26mi |
| 1101 Century Oaks Dr Gulfport, MS | 3.0 | 3.0 | 1330 | $1,700 | $1.28 | 44d | 1 | 0.27mi |
| 153 Markham Dr Gulfport, MS | 3.0 | 2.0 | 1650 | $3,000 | $1.82 | 44d | 1 | 0.59mi |
| 477 Tegarden Rd Unit D Gulfport, MS | 3.0 | 2.0 | 1300 | $1,300 | $1.00 | 14d | 1 | 0.64mi |
| 1525 E Pass Rd Gulfport, MS | 1.0–3.0 | 1.0–2.0 | 1070 | $1,519 | $1.42 | 21d | 1 | 0.76mi |
| 954 Old Towne St Gulfport, MS | 3.0 | 2.0 | 1533 | $1,900 | $1.24 | 14d | 1 | 0.96mi |
| 1114 Washington Ave Gulfport, MS | 3.0 | 2.0 | 1200 | $1,350 | $1.12 | 21d | 1 | 1.06mi |
| 2420 Demaret Dr Gulfport, MS | 4.0 | 2.0 | 1600 | $1,800 | $1.12 | 44d | 1 | 1.14mi |
| 1339 Foxwood Pl Gulfport, MS | 3.0 | 2.0 | 1100 | $1,375 | $1.25 | 44d | 1 | 1.28mi |
| 980 Courthouse Rd Unit 1605 Gulfport, MS | 2.0 | 2.0 | 1227 | $1,355 | $1.10 | 21d | 1 | 1.33mi |
| 2228 Beach Dr #506 Gulfport, MS | 2.0 | 2.0 | 1164 | $2,995 | $2.57 | 44d | 1 | 1.35mi |
| 2228 Beach Dr Gulfport, MS | 2.0 | 2.0 | 1279 | $2,895 | $2.26 | 21d | 1 | 1.35mi |
| 2610 Demaret Dr Gulfport, MS | 4.0 | 1.5 | 1700 | $1,995 | $1.17 | 44d | 1 | 1.35mi |
| 2230 Beach Dr Gulfport, MS | 3.0 | 3.0 | 1852 | $3,195 | $1.73 | 44d | 1 | 1.35mi |
| 2252 Beach Dr Gulfport, MS | 3.0 | 2.0 | 1691 | $2,800 | $1.66 | 44d | 1 | 1.36mi |
| 1400 Mill Rd Gulfport, MS | 2.0 | 2.5 | 1290 | $2,550 | $1.98 | 44d | 1 | 1.42mi |
| 3503 Hancock Ave Gulfport, MS | 2.0 | 2.5 | 1100 | $1,100 | $1.00 | 21d | 1 | 1.47mi |
Listing history 6 events
-
2026-06-09status $115,000 Pending 6 DOM
-
2026-06-08days on market $115,000 Active 6 DOM
-
2026-06-07days on market $115,000 Active 5 DOM
-
2026-06-05days on market $115,000 Active 2 DOM
-
2026-06-03remarks 593-char remark
-
2026-06-03$115,000 Active 1 DOM
ⓘ Source: listings_history table (triggers on properties + properties_extension) + one-shot
backfill from property_details.listing_events for pre-trigger history.
Tax reassessment forecast MS · Resets to sale price
- Current annual tax
- $1,950 · $163/mo
- Projected year-2 tax
- $1,950 · $163/mo
- Expected delta
- $0/yr ($0/mo · 0.0%)
ⓘ Screening estimate from a state-policy table — verify with the county assessor before closing.
Climate risk First Street
- Flood 1/10 Low FEMA zone X (unshaded) · 0% chance over 30 yrs
- Wildfire 1/10 Low
- Heat 10/10 Extreme 7 d/yr ≥106°F today · 23 d/yr by 30 yrs out
- Wind 9/10 Extreme 99% chance of damaging wind over 30 yrs
- Air quality 3/10 Moderate 2 unhealthy d/yr today · 3 by 30 yrs out
Nearby sold comps map
Loading sold comps map…
Walkable amenities ~0.75 mi
Loading nearby amenities…
Taxation est. · year 1
- Rental income
- $24,851
- − Mortgage interest
- −$6,442
- − Property taxes
- −$1,950
- − Insurance
- −$575
- − Repairs & maintenance
- −$1,988
- − Management
- −$1,988
- − Depreciation
- −$3,345
- Taxable income
- $8,562
- Est. tax owed @ 24.0%
- −$2,055
- After-tax cash flow
- $7,815/yr
For passive investors: Depreciation is non-cash, so a rental often shows a tax loss while cash-flowing — sheltering income. Rental losses are passive: they offset passive income freely, and up to $25,000/yr can offset ordinary (W-2) income if you actively participate and your MAGI is under $100k (phasing out to $0 by $150k); unused losses carry forward. On sale, claimed depreciation is recaptured at up to 25%, and gains may owe capital-gains tax (a 1031 exchange can defer both). Figures are a year-1 estimate at your 24.0% rate — not tax advice; consult a CPA.
Schools (NCES district)
- District
- Gulfport School District
- NCES district ID
- 2801710
- Math proficiency
- 41% ▼ -15.00%
- Reading proficiency
- 42% ▼ -6.00%
- Median HH income
- $35,712
- Composite
- 34.38/100
- National rank
- #5213
- State rank
- #37 of 130 in MS
Livability — Gulfport
- Score
- 73/100
- State rank
- #15
- US rank
- #5010
Category grades
Schools grade is shown separately in the Schools card above.
Census & demographics
- Census place
- Gulfport, MS
- County
- Harrison County · 178,171 people
- City population
- 96,188
- Metro
- Gulfport-Biloxi, MS
- Population (ZIP)
- 18,564
- Household income
- $54,657
- Rent vs Own
- Severe rent burden
- 1059.0
Population outlook (Harrison County) Hauer SSP2
- Today (2025)
- 228,444 people
- By 2030
- 241,942 · +5.9%
- By 2040
- 267,531 · +17.1%
- By 2050
- 291,062 · +27.4%
- By 2075
- 346,711 · +51.8%
- By 2100
- 378,165 · +65.5%
Race, ethnicity, and origin ACS 2023
- Neighborhood character
- Majority White (65%)
- Race & ethnicity
- White 65% Black 24% Hispanic / Latino 6% Two or more races 5% Asian 1%
- Hispanic origin (detail)
- Mexican 2% Cuban 1%
- Common ancestry
- Slovak 4% Lithuanian 4% Romanian 2%
- Foreign-born
- 4% · Canada
- Languages at home
- 94% English-only · Spanish 2% French/Haitian/Cajun 2% Other Indo-European 1%
Political lean MEDSL · Harrison
- 2024 margin
- Strong R (+28.9) · D 35.0% · R 63.9% · Other 1.1%
- 2008→2024 swing
- -2.9pp toward R · 2008: -26.0pp · 2024: -28.9pp
- All cycles
- 2024: R+28.9 2020: R+25.2 2016: R+30.7 2012: R+26.6 2008: R+26.0
Not yet ingested
- Civics
- —
Market trends
- HPI YoY
- ▼ -67.48%
- Current HPI
- 181.6606
- Rent YoY
- ▲ 4.26%
- Metro
- Gulfport-Biloxi, MS
- State GDP YoY
- —
- F500 in state
- 0
Price history
+105.7% since first listed7 events — show timeline
- 2026-06-02 Listed $115,000 MLSU
- 2021-09-15 Listing Removed — MLSU
- 2015-01-15 Sold (Public Records) $47,000 Public Records
- 2015-01-12 Sold (MLS) — MLSU
- 2014-11-16 Listed $54,900 MLSU
- 2012-03-27 Listed $55,900 MLSU
- 2004-06-11 Sold (Public Records) — Public Records
Property tax history
+2.2%/yrLatest (2025): $1,950 · +32.9% YoY. Source: county tax records.
Cash-flow waterfall
monthlySold comps — $/sqft
last 12 mo · ≤1 miLoading sold comps…