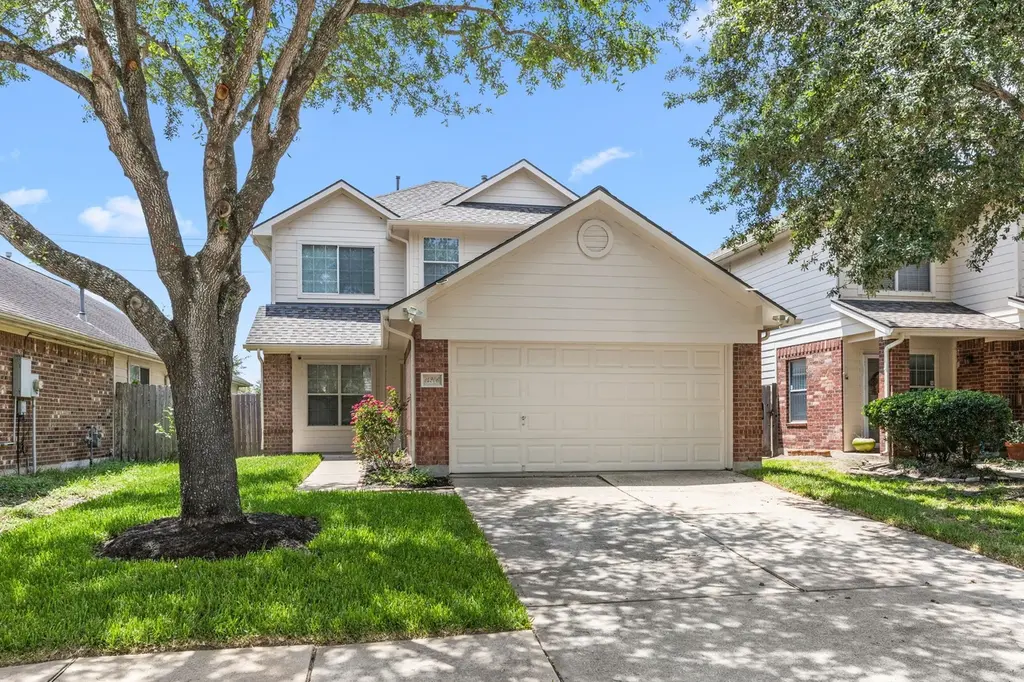
14206 Bonham Oaks Ln · Pearland, TX
Flood risk 2/10 · Minimal
- FEMA flood zone
- X (unshaded)
- Chance of flooding over 30 yrs
- 0.07%
- Est. flood insurance / yr
- $507 – $1,088
Fire risk 3/10 · Minor
- Est. fire insurance / yr
- $1,222 – $2,270
Heat risk 10/10 · Severe
- Hot days now (above 109°F)
- 7 days/yr
- Hot days in 30 yrs
- 25 days/yr
Wind risk 9/10 · Severe
- Chance of severe wind over 30 yrs
- 99.0%
Air-quality risk 2/10 · Minimal
- Unhealthy air days now
- 2 days/yr
- Unhealthy air days in 30 yrs
- 2 days/yr
Risk factors via First Street. Map © Google.
Why this score? — see what drove the D grade
The composite is a weighted blend of 9 inputs, each scored 0–100. Each bar is that input's sub-score; the figure is the points it added to the 100-point composite (weight × sub-score).
- ARV discount +12.2/15.0
- Cash flow +11.9/30.0
- 1% rule +4.5/10.0
- Livability +4.0/5.0
- DSCR +3.5/10.0
- Schools +2.7/10.0
- Condition / age +2.5/5.0
- Rent growth +2.4/5.0
- Appreciation +0.0/10.0
$245,000
🖨 Deal sheet (PDF) 📄 Offer letter ✓ Due diligence
Listing remarks
This desirable 4 bedroom house in the Brunswick Meadows neighborhood is ready for you to move in! The roof was recently replaced, along with a freshly painted exterior and interior. The yard has a sprinkler system, helping to ensure a nice lawn year round. The separate space upstairs allows for a second media room, game room, or whatever you could imagine to create two separate spaces for socializing. The house is a short walk from the neighborhood park. It is also close enough to Beltway 8 and 288 for easy access anywhere in the city, though far enough away for a quiet night at home. Come see your new home today!
Key facts
- Sprinkler system
- 4,691 sq ft lot
- 2 garage spots
Tags
Property features AI
Finance
- Other: Seller disclosure available
- HOA & community: Member of Brunswick Mdws (managed by Beacon Res Mgmt); Annual association fee of $394
Exterior
- Parking: Attached garage with 2 parking spaces
- Utilities: Public water; Public sewer
- Home design: Residential property; Built in 2005; Single-family design; Slab foundation; Living area approximately 1,898
- Construction: Cement siding; Composition roof
- Exterior features: Located in a subdivision
Interior
- Kitchen: Kitchen located on the first floor
- Bedrooms: Primary bedroom on the first floor (approx. 13' x 12'); Three additional bedrooms on the second floor (approx. 12' x 12'; 10.5' x 11.5'; 10.5' x 11')
- Bathrooms: 2 full bathrooms; 1 half bathroom
- Heating & cooling: Central gas heating; Central electric air conditioning
- Interior features: Kitchen open to family room; Primary bathroom; Pantry; 8 total rooms
Neighborhood map
What this means for you Summary
Snapshot
- This is a 4-bed/2.5-bath single-family listed at $245k.
Deal economics
- At list price, monthly cash flow is $-64 ($-768/yr) — negative.
- To cash-flow at today's rent, offer at most $234k (4.6% below list).
- To meet the 1% rule (rent ≥ 1% of price), the offer needs to be $233k (4.9% below list).
- Recommended offer: $233k (4.9% below list) — sets the bar for 1% rule.
- Cap rate 6.0% vs local median 3.0% in Pearland — top-decile yield for the area; either an underpriced asset or a hidden risk that comps aren't pricing in. Stress-test before assuming the spread holds.
Location & tenants
- Location reads 81/100 on livability (#32 in TX, #1,539 nationally) — a professional / high-income tenant draw. Strengths: employment A+, housing A+, crime A; Watch: amenities D-, commute F.
- Houston ISD (urban): math 27% / reading 35% proficiency, ranked #593 of 826 in TX (top 72%) — families likely to look elsewhere, expect single-tenant / working-renter base with shorter leases; 71% free/reduced lunch — lower-income household profile, screen leases tightly.
- Zoned schools: Law El (math 22% / reading 32%, grade F, #2,791 of 4,322 statewide, top 68%, 514 students, 91% FRL); Thomas Middle (math 3% / reading 13%, grade F, #1,654 of 1,662 statewide, top 100%, 526 students, 98% FRL); Worthing H S (math 22% / reading 21%, grade F, #1,377 of 1,632 statewide, top 85%, 827 students, 96% FRL) — zoned schools average 95% FRL vs 71% district-wide (24 pts higher); higher-poverty schools than district average — tighter screening recommended.
- Zoned-school proficiency averages 19% at this address vs 31% district-wide (-12 pts) — the specific schools serving this property underperform the Houston ISD average; the district grade overstates school quality for this exact location.
- Market conditions: Rents soft (-0.2%/yr); 284 active listings in the ZIP; 11 comparable units currently listed for rent nearby; rentals leasing fast (median 10d on market — plan ~1-2 weeks tenant-placement turnaround); solid renter incomes; 29,883 units permitted in Harris County in 2024 (8,621 in 5+ unit buildings).
- This rent runs 36% of the median local income ($79k/yr) — at the standard rent-burdened threshold; future hikes will face affordability resistance.
Forward outlook
- Local home prices are declining (-3.0%/yr); year-one equity from $2k of loan paydown is wiped out by about $7k of value loss. Plan a longer hold.
- Harris County population projected at +47% by 2050 — long-run rental-demand tailwind backs the buy-and-hold thesis.
Negotiation context
- It's been on market 20 days — a 2% lower offer ($241k) is reasonable based on typical stale-listing flexibility.
- 2 sale attempts since 19y ago with the ask held roughly flat each time — persistent listings suggest the price (not the market) is what's stuck; bring a comps-based counter.
Risks & watch-outs
- Climate carrying-cost: severe wind risk, 99% chance of damaging wind over 30y; extreme-heat days projected 7→25/yr by 2055 (HVAC capex compounding) — expect insurance premiums to compound above CPI over the hold.
Questions for the listing agent
- What do current leases actually rent for vs. the listed asking? Can we see a recent rent roll and the last 12 months of T-12 income?
- What does the HOA fee cover, when was the last increase, and are there any pending special assessments or reserve-fund shortfalls?
- Is there a deadline driving the sale (1031 exchange, divorce, estate, relocation)? That informs how much negotiation room exists.
- Schools are A-rated — typically a magnet for longer-tenancy family renters. What's the average tenant stay here, and is there a school-zone premium baked into asking?
- The area grade is low — what's the realistic commute time and amenity access for the typical tenant pool here? Any planned neighborhood developments (good or bad) we should know about?
- What's the average days-on-market for RENTAL listings here right now (not sales)? A rising rental-DOM trend means longer vacancies and softer asking-rent achievability than the comps imply.
- What's the recent tenant-quality profile in this submarket — average credit score on applications, eviction rate, late-payment / NSF rate, and stable-employment percentage? A property-management company in the area should have these aggregated.
- How much new for-sale + rental construction is in the pipeline within 1–3 miles? Heavy new supply typically softens prices + rents 12–24 months out; constrained supply supports both.
Investment metrics
- 1% rule
- 0.95% ✗
- Cap rate
- 5.98%
- Cash-on-cash
- -1.12%
- DSCR
- 0.95
- GRM
- 8.8
CMA / ARV
- ARV (on-the-fly)
- $273,312
- Comps found
- 12
Show comp detail 12 sales within ~0.75 mi
| Address | Dist | Beds/Ba | Sqft | Sold | Price | $/sf | Match |
|---|---|---|---|---|---|---|---|
| 14311 Brunswick Point Ln | 0.48mi | 4/2.5 | 1,830 (-4%) | 1mo | $269,000 | $147 | 71 |
| 3211 Norville Ln | 0.45mi | 3/2.0 (-1) | 1,828 (-4%) | 3mo | $260,000 | $142 | 64 |
| 14018 Merganser Dr | 0.25mi | 3/2.5 (-1) | 2,140 (+13%) | 1mo | $300,000 | $140 | 61 |
| 3123 Kainer Meadows Ln | 0.40mi | 4/2.5 | 2,135 (+12%) | 3mo | $276,000 | $129 | 58 |
| 14135 Concord Meadow Ln | 0.58mi | 3/2.0 (-1) | 1,941 (+2%) | 6mo | $265,900 | $137 | 57 |
| 13914 Winthorpe Ct | 0.36mi | 3/2.5 (-1) | 2,140 (+13%) | 1mo | $289,990 | $136 | 56 |
| 13438 Sun Cay Dr | 0.72mi | 4/2.5 | 1,802 (-5%) | 3mo | $349,881 | $194 | 55 |
| 2746 Trinity Glen Ln | 0.47mi | 3/2.0 (-1) | 1,728 (-9%) | 2mo | $248,700 | $144 | 54 |
| 3526 Canvasback Ln | 0.35mi | 3/2.5 (-1) | 2,138 (+13%) | 5mo | $275,000 | $129 | 54 |
| 13935 Kenswick Key Ln | 0.39mi | 3/2.0 (-1) | 1,670 (-12%) | 3mo | $287,500 | $172 | 53 |
| 4114 Brunswick Crossing Ln | 0.69mi | 3/2.0 (-1) | 1,959 (+3%) | 5mo | $320,000 | $163 | 51 |
| 13435 Sun Cay Dr | 0.72mi | 3/2.5 (-1) | 1,727 (-9%) | 2mo | $335,781 | $194 | 45 |
Match score weights: distance 35% · size 25% · config 20% · recency 20%. Top-matched comps best support the ARV.
Projected returns pro-forma
-3.0% appreciation · 0.0% rent growth · sell at horizon
- IRR
- -21.9%
- Equity multiple
- 0.26×
- Total profit
- $-50,442
- Equity at exit
- $36,530
- IRR
- -27.3%
- Equity multiple
- -0.09×
- Total profit
- $-74,899
- Equity at exit
- $21,183
Cash invested: $68,600 (down + closing). Projections, not guarantees.
Landlord ↔ Tenant lean methodology
- Overall (STATE)
- 87 Strongly Landlord-Friendly
- State Texas
- 87 Strongly Landlord-Friendly · R+5
- County
- — inherits STATE
- City
- — inherits STATE
ZIP-level market 77047
- Home prices YoY
- -10.1%
- Rents YoY
- -0.2%
- Active inventory
- 284
- Price-to-rent
- 8.8×
Monthly cashflow live
- Estimated rent
- $2,331 high interval (Pro) →
- Mortgage (P&I)
- −$1,285
- Tax from tax record
- −$486 /mo · $5,826/yr
- Insurance
- −$102
- HOA
- −$33
- Vacancy / Maint / Mgmt
- −$489
- Net cashflow
- $-64
Break-even live
Sensitivity live
| Price | -10% $75 | -5% $5 | +0% $-64 | +5% $-133 | +10% $-203 |
|---|---|---|---|---|---|
| Rent | -10% $-248 | -5% $-156 | +0% $-64 | +5% $28 | +10% $120 |
| Rate | -1.0pp $59 | -0.5pp $-2 | base $-64 | +0.5pp $-127 | +1.0pp $-192 |
UW: 25.0% down · 7.5% · 30yr · 1.5% tax · 5.0% vac · 8.0% maint · 8.0% mgmt
Financing live
Cash to close
- Down payment
- $61,250
- Closing costs
- $7,350
- Reserves months
- —
- Total cash needed
- —
Loan-product check · same deal, 3 products live
Conventional
25% down · 7.5% · 30yr
- Down + closing
- —
- Monthly P&I
- —
- Monthly cashflow
- —
- DSCR
- —
- Eligible?
- —
Personal DTI + credit; lowest rate.
DSCR
20% down · 8.5% · 30yr
- Down + closing
- —
- Monthly P&I
- —
- Monthly cashflow
- —
- DSCR
- —
- Eligible?
- —
No personal income docs; deal must DSCR.
Hard money
10% down · 12.0% · 12mo
- Down + closing
- —
- Monthly P&I
- —
- Monthly cashflow
- —
- DSCR
- —
- Eligible?
- —
Short-term bridge; refi at stabilization.
Rent comps 11 comps
| Address | Beds | Baths | Sqft | Rent | $/sqft | DOM | Units | Dist |
|---|---|---|---|---|---|---|---|---|
| 3403 Orchid Trace Ln Houston, TX | 3.0 | 2.5 | 1602 | $1,920 | $1.20 | 4d | 1 | 0.22mi |
| 3110 Kainer Meadows Ln Houston, TX | 3.0 | 2.0 | 1469 | $1,900 | $1.29 | 9d | 1 | 0.41mi |
| 13802 Greyfield Ln Houston, TX | 4.0 | 2.5 | 2350 | $2,400 | $1.02 | 1d | 1 | 0.57mi |
| 13426 Sombrero Cay Dr Houston, TX | 4.0 | 3.0 | 2108 | $2,300 | $1.09 | 45d | 1 | 0.76mi |
| 4111 Oakview Creek Ln Houston, TX | 4.0 | 2.5 | 1885 | $2,150 | $1.14 | 45d | 1 | 0.99mi |
| 3918 Almeda-Genoa Rd Houston, TX | 1.0–3.0 | 1.0–2.0 | 1038 | $2,220 | $2.14 | 0d | 26 | 1.02mi |
| 4023 Almond Lake Dr Houston, TX | 3.0 | 2.0 | 1414 | $1,980 | $1.40 | 45d | 1 | 1.06mi |
| 2920 Stamford Hill Ln Houston, TX | 3.0 | 2.0 | 1690 | $2,200 | $1.30 | 45d | 1 | 1.14mi |
| 3020 Gunnersbury Dr Houston, TX | 4.0 | 2.0 | 1670 | $1,499 | $0.90 | 16d | 1 | 1.18mi |
| 2706 Skyview Downs Dr Houston, TX | 4.0 | 2.5 | 2464 | $2,200 | $0.89 | 4d | 1 | 1.30mi |
| 3013 Maughan Heights Trl Houston, TX | 4.0 | 2.5 | 2386 | $5,000 | $2.10 | 0d | 1 | 1.43mi |
HOA detail
- Monthly dues
- $33 · $396/yr
Listing history 13 events
-
2026-06-21days on market $245,000 Active 20 DOM
-
2026-06-18days on market $245,000 Active 17 DOM
-
2026-06-17days on market $245,000 Active 16 DOM
-
2026-06-16days on market $245,000 Active 15 DOM
-
2026-06-15days on market $245,000 Active 14 DOM
-
2026-06-13days on market $245,000 Active 12 DOM
-
2026-06-09days on market $245,000 Active 8 DOM
-
2026-06-08days on market $245,000 Active 7 DOM
-
2026-06-07days on market $245,000 Active 6 DOM
-
2026-06-04days on market $245,000 Active 3 DOM
-
2026-06-03days on market $245,000 Active 2 DOM
-
2026-06-02remarks 621-char remark
-
2026-06-02$245,000 Active 1 DOM
ⓘ Source: listings_history table (triggers on properties + properties_extension) + one-shot
backfill from property_details.listing_events for pre-trigger history.
Tax reassessment forecast TX · Resets to sale price
- Current annual tax
- $5,826 · $486/mo
- Projected year-2 tax
- $5,826 · $486/mo
- Expected delta
- $0/yr ($0/mo · 0.0%)
ⓘ Screening estimate from a state-policy table — verify with the county assessor before closing.
Climate risk First Street
- Flood 2/10 Low FEMA zone X (unshaded) · 7% chance over 30 yrs
- Wildfire 3/10 Moderate
- Heat 10/10 Extreme 7 d/yr ≥109°F today · 25 d/yr by 30 yrs out
- Wind 9/10 Extreme 99% chance of damaging wind over 30 yrs
- Air quality 2/10 Low 2 unhealthy d/yr today · 2 by 30 yrs out
Nearby sold comps map
Loading sold comps map…
Walkable amenities ~0.75 mi
Loading nearby amenities…
Taxation est. · year 1
- Rental income
- $27,971
- − Mortgage interest
- −$13,724
- − Property taxes
- −$5,826
- − Insurance
- −$1,225
- − Repairs & maintenance
- −$2,238
- − Management
- −$2,238
- − HOA
- −$396
- − Depreciation
- −$7,127
- Taxable loss
- −$4,803
- Est. tax savings @ 24.0%
- +$1,153
- After-tax cash flow
- $385/yr
For passive investors: Depreciation is non-cash, so a rental often shows a tax loss while cash-flowing — sheltering income. Rental losses are passive: they offset passive income freely, and up to $25,000/yr can offset ordinary (W-2) income if you actively participate and your MAGI is under $100k (phasing out to $0 by $150k); unused losses carry forward. On sale, claimed depreciation is recaptured at up to 25%, and gains may owe capital-gains tax (a 1031 exchange can defer both). Figures are a year-1 estimate at your 24.0% rate — not tax advice; consult a CPA.
Schools (NCES district)
- District
- Houston ISD
- NCES district ID
- 4823640
- Math proficiency
- 27% ▼ -18.00%
- Reading proficiency
- 35% ▼ -6.00%
- Median HH income
- $46,054
- Composite
- 26.63/100
- National rank
- #7173
- State rank
- #593 of 826 in TX
Livability — Pearland
- Score
- 81/100
- State rank
- #32
- US rank
- #1539
Category grades
Schools grade is shown separately in the Schools card above.
Census & demographics
- County
- Harris County · 4,702,590 people
- City population
- 142,397
- Metro
- Houston-The Woodlands-Sugar Land, TX
- Population (ZIP)
- 34,987
- Household income
- $78,538
- Rent vs Own
- Severe rent burden
- 1109.0
Population outlook (Harris County) Hauer SSP2
- Today (2025)
- 5,571,493 people
- By 2030
- 6,089,821 · +9.3%
- By 2040
- 7,142,806 · +28.2%
- By 2050
- 8,185,864 · +46.9%
- By 2075
- 10,574,329 · +89.8%
- By 2100
- 12,109,958 · +117.4%
Race, ethnicity, and origin ACS 2023
- Neighborhood character
- Diverse neighborhood (Simpson 0.58)
- Race & ethnicity
- Black 57% Hispanic / Latino 29% Two or more races 15% White 6% Asian 3% Pacific Islander 1%
- Hispanic origin (detail)
- Mexican 24% Puerto Rican 1%
- Common ancestry
- Lithuanian 1%
- Foreign-born
- 15% · Canada, Vietnam
- Languages at home
- 70% English-only · Spanish 23% Vietnamese 1% Other Indo-European 1%
Political lean MEDSL · Harris
- 2024 margin
- Lean D (+5.5) · D 52.0% · R 46.4% · Other 1.6%
- 2008→2024 swing
- +3.9pp toward D · 2008: 1.6pp · 2024: 5.5pp
- All cycles
- 2024: D+5.5 2020: D+13.3 2016: D+12.4 2012: D+0.1 2008: D+1.6
Not yet ingested
- Civics
- —
Market trends
- HPI YoY
- ▼ -26.76%
- Current HPI
- 239.2287
- Rent YoY
- ▼ -0.21%
- Metro
- Houston-The Woodlands-Sugar Land, TX
- State GDP YoY
- ▲ 3.95%
- F500 in state
- 110
Industry mix (Fortune 500 HQ in TX)
| Industry | F500 HQs | Revenue |
|---|---|---|
| Energy | 16 | $1,198B |
|
||
| Technology | 5 | $198B |
|
||
| Engineering / Construction | 4 | $72B |
|
||
| Energy Services | 3 | $60B |
|
||
| Utilities | 3 | $41B |
|
||
| Healthcare | 2 | $330B |
|
||
Price history
+129.0% since first listed4 events — show timeline
- 2026-06-01 Listed $245,000 HARMLS
- 2021-05-05 Sold (Public Records) — Public Records
- 2007-10-03 Listing Removed — HARMLS
- 2007-09-07 Listed $107,000 HARMLS
Property tax history
+6.4%/yrLatest (2025): $5,826 · +0.6% YoY. Source: county tax records.
Cash-flow waterfall
monthlySold comps — $/sqft
last 12 mo · ≤1 miLoading sold comps…