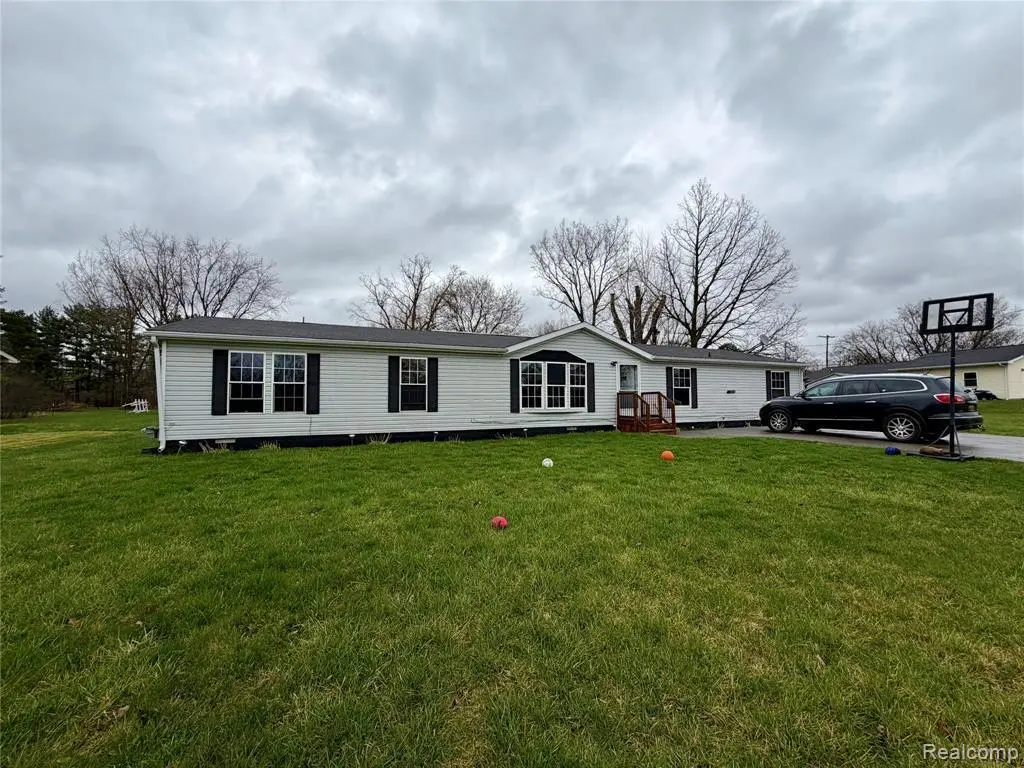
3498 Mackin Rd · Flint, MI
Flood risk 1/10 · Minimal
- FEMA flood zone
- X (unshaded)
- Chance of flooding over 30 yrs
- 0.0%
- Est. flood insurance / yr
- $473 – $860
Fire risk 1/10 · Minimal
- Est. fire insurance / yr
- $784 – $1,456
Heat risk 2/10 · Minimal
- Hot days now (above 96°F)
- 7 days/yr
- Hot days in 30 yrs
- 15 days/yr
Wind risk 2/10 · Minimal
- Chance of severe wind over 30 yrs
- —
Air-quality risk 3/10 · Minor
- Unhealthy air days now
- 3 days/yr
- Unhealthy air days in 30 yrs
- 4 days/yr
Risk factors via First Street. Map © Google.
Why this score? — see what drove the B- grade
The composite is a weighted blend of 9 inputs, each scored 0–100. Each bar is that input's sub-score; the figure is the points it added to the 100-point composite (weight × sub-score).
- Cash flow +30.0/30.0
- DSCR +10.0/10.0
- 1% rule +9.6/10.0
- ARV discount +6.4/15.0
- Livability +3.7/5.0
- Rent growth +2.5/5.0
- Condition / age +2.5/5.0
- Schools +1.7/10.0
- Appreciation +0.0/10.0
$123,500
🖨 Deal sheet 📄 Offer letter ✓ Due diligence
Listing remarks MLS
Welcome to 3498 Mackin in Flint! This 4-bedroom, 2-bath ranch was remodeled in 2022 and offers a functional single-level layout with plenty of space to spread out. Whether you're looking for your next home or a smart addition to your portfolio, this property is priced to sell with a motivated seller ready to move. Convenient location close to everyday amenities and main roads. Schedule your showing today - opportunities like this don't last long. BATVAI
Key facts
- Remodeled in 2022
- Convenient location
- 0.76 acre lot
Tags
Neighborhood map
What this means for you Summary
Snapshot
- This is a 4-bed/2.0-bath single-family listed at $124k.
Deal economics
- At list price, monthly cash flow is $515 ($6k/yr) — positive.
- The deal already cash-flows at list — no discount required.
- Meets the 1% rule at list price ($2k rent vs $124k).
Location & tenants
- Location reads 74/100 on livability (#196 in MI, #4,946 nationally) — a middle-class / working-renter tenant base. Strengths: commute A+, cost of living A+, housing A+; Watch: schools F, crime F, employment F.
- Carman-Ainsworth Community Schools (suburban): math 12% / reading 28% proficiency, ranked #468 of 540 in MI (top 87%) — low school quality limits family demand, transient renter base, plan for 1-2y turnover; 64% free/reduced lunch — lower-income household profile, screen leases tightly.
- Market conditions: 131 active listings in the ZIP; 1 comparable units currently listed for rent nearby; 419 units permitted in Genesee County in 2024 (68 in 5+ unit buildings).
Forward outlook
- Local home prices are declining (-3.0%/yr); year-one equity from $854 of loan paydown is wiped out by about $4k of value loss. Plan a longer hold.
- Genesee County population projected at -27% by 2050 — secular population decline; favor cash flow + early exit over multi-decade hold.
- At projected returns (-3.0% appreciation + 3.0% rent growth), your $35k cash investment doubles in ~7 years — after that, you're playing with house money.
Negotiation context
- Only 6 days on market — expect competitive offers; lowballing is unlikely to land.
- 9 sale attempts since 27y ago with the ask held roughly flat each time — persistent listings suggest the price (not the market) is what's stuck; bring a comps-based counter.
- Current owner paid $6k; list at $124k implies a 1958% gain — meaningful room to come down on a strong offer.
Questions for the listing agent
- Built in 1976 — when were the roof, HVAC, electrical panel, plumbing, and water heater last replaced?
- Is there a deadline driving the sale (1031 exchange, divorce, estate, relocation)? That informs how much negotiation room exists.
- Schools are F-rated, which usually means shorter tenancies and higher turnover. Who's the typical renter profile here, and what's been the actual vacancy rate?
- Crime grade is F in this area — have there been break-ins, vandalism, or insurance claims at this property in the last 3 years? What carrier currently insures it and at what premium?
- What's the average days-on-market for RENTAL listings here right now (not sales)? A rising rental-DOM trend means longer vacancies and softer asking-rent achievability than the comps imply.
- What's the recent tenant-quality profile in this submarket — average credit score on applications, eviction rate, late-payment / NSF rate, and stable-employment percentage? A property-management company in the area should have these aggregated.
- How much new for-sale + rental construction is in the pipeline within 1–3 miles? Heavy new supply typically softens prices + rents 12–24 months out; constrained supply supports both.
Investment metrics
- 1% rule
- 1.46% ✓
- Cap rate
- 11.30%
- Cash-on-cash
- 17.87%
- DSCR
- 1.80
- GRM
- 5.7
CMA / ARV
- ARV (on-the-fly)
- $120,536
- Comps found
- 5
Show comp detail 5 sales within ~0.75 mi
| Address | Dist | Beds/Ba | Sqft | Sold | Price | $/sf | Match |
|---|---|---|---|---|---|---|---|
| 3498 Mackin Rd | 0.00mi | 4/2.0 | 1,976 (0%) | 1mo | $120,000 | $61 | 99 |
| 2040 Lavelle Rd | 0.28mi | 5/2.0 (+1) | 1,687 (-15%) | 24mo | $41,000 | $24 | 38 |
| 3235 Prospect St | 0.68mi | 3/2.5 (-1) | 1,764 (-11%) | 18mo | $111,000 | $63 | 28 |
| 1719 Seneca St | 0.74mi | 3/1.0 (-1) | 1,864 (-6%) | 23mo | $75,000 | $40 | 28 |
| 1417 Eldorado Dr | 0.59mi | 3/1.5 (-1) | 1,700 (-14%) | 22mo | $110,000 | $65 | 24 |
Match score weights: distance 35% · size 25% · config 20% · recency 20%. Top-matched comps best support the ARV.
Projected returns pro-forma
-3.0% appreciation · 3.0% rent growth · sell at horizon
- IRR
- 9.4%
- Equity multiple
- 1.37×
- Total profit
- $12,851
- Equity at exit
- $18,414
- IRR
- 18.6%
- Equity multiple
- 2.55×
- Total profit
- $53,673
- Equity at exit
- $10,678
Cash invested: $34,580 (down + closing). Projections, not guarantees.
Landlord ↔ Tenant lean methodology
- Overall (STATE)
- 62 Landlord-Friendly
- State Michigan
- 62 Landlord-Friendly · EVEN
- County
- — inherits STATE
- City
- — inherits STATE
ZIP-level market 48504
- Active inventory
- 131
- Price-to-rent
- 5.7×
Monthly cashflow live
- Estimated rent
- $1,800 medium interval (Pro) →
- Mortgage (P&I)
- −$648
- Tax from tax record
- −$208 /mo · $2,494/yr
- Insurance
- −$51
- HOA
- −$0
- Vacancy / Maint / Mgmt
- −$378
- Net cashflow
- $515
Break-even live
UW: 25.0% down · 7.5% · 30yr · 1.5% tax · 5.0% vac · 8.0% maint · 8.0% mgmt
Financing live
Cash to close
- Down payment
- $30,875
- Closing costs
- $3,705
- Reserves months
- —
- Total cash needed
- —
Loan-product check · same deal, 3 products live
Conventional
25% down · 7.5% · 30yr
- Down + closing
- —
- Monthly P&I
- —
- Monthly cashflow
- —
- DSCR
- —
- Eligible?
- —
Personal DTI + credit; lowest rate.
DSCR
20% down · 8.5% · 30yr
- Down + closing
- —
- Monthly P&I
- —
- Monthly cashflow
- —
- DSCR
- —
- Eligible?
- —
No personal income docs; deal must DSCR.
Hard money
10% down · 12.0% · 12mo
- Down + closing
- —
- Monthly P&I
- —
- Monthly cashflow
- —
- DSCR
- —
- Eligible?
- —
Short-term bridge; refi at stabilization.
Rent comps 1 comps
| Address | Beds | Baths | Sqft | Rent | $/sqft | DOM | Units | Dist |
|---|---|---|---|---|---|---|---|---|
| 1510 Forest Hill Ave Flint, MI | 4.0 | 2.0 | 2441 | $1,800 | $0.74 | 21d | 1 | 1.39mi |
Listing history 21 events
-
2026-04-22status Pending 457-char remark
Show marketing remark (457 chars)
Welcome to 3498 Mackin in Flint! This 4-bedroom, 2-bath ranch was remodeled in 2022 and offers a functional single-level layout with plenty of space to spread out. Whether you're looking for your next home or a smart addition to your portfolio, this property is priced to sell with a motivated seller ready to move. Convenient location close to everyday amenities and main roads. Schedule your showing today - opportunities like this don't last long. BATVAI
-
2026-04-22status Pending
Show marketing remark (457 chars)
Welcome to 3498 Mackin in Flint! This 4-bedroom, 2-bath ranch was remodeled in 2022 and offers a functional single-level layout with plenty of space to spread out. Whether you're looking for your next home or a smart addition to your portfolio, this property is priced to sell with a motivated seller ready to move. Convenient location close to everyday amenities and main roads. Schedule your showing today - opportunities like this don't last long. BATVAI
-
2026-04-16$123,500 Active
Show marketing remark (457 chars)
Welcome to 3498 Mackin in Flint! This 4-bedroom, 2-bath ranch was remodeled in 2022 and offers a functional single-level layout with plenty of space to spread out. Whether you're looking for your next home or a smart addition to your portfolio, this property is priced to sell with a motivated seller ready to move. Convenient location close to everyday amenities and main roads. Schedule your showing today - opportunities like this don't last long. BATVAI
-
2026-04-16$123,500 Active 457-char remark
Show marketing remark (457 chars)
Welcome to 3498 Mackin in Flint! This 4-bedroom, 2-bath ranch was remodeled in 2022 and offers a functional single-level layout with plenty of space to spread out. Whether you're looking for your next home or a smart addition to your portfolio, this property is priced to sell with a motivated seller ready to move. Convenient location close to everyday amenities and main roads. Schedule your showing today - opportunities like this don't last long. BATVAI
-
2022-04-15historical
-
2022-02-22status Pending
-
2022-02-22status Pending
-
2022-02-21historical
-
2022-02-19$115,000 Active
-
2022-02-19$115,000 Active
-
2010-02-17soldstatus $6,000
-
2009-07-06$11,900
-
2009-02-12historical
-
2009-02-12historical
-
2008-04-25$13,900
-
2008-04-25$13,900
-
2000-12-15soldstatus $9,000
-
2000-05-23historical
-
1999-12-30$8,900
-
1999-08-19historical
-
1999-02-23$16,000
ⓘ Source: listings_history table (triggers on properties + properties_extension) + one-shot
backfill from property_details.listing_events for pre-trigger history.
Tax reassessment forecast MI · Partial reset (capped growth)
- Current annual tax
- $2,494 · $208/mo
- Projected year-2 tax
- $2,494 · $208/mo
- Expected delta
- $0/yr ($0/mo · 0.0%)
ⓘ Screening estimate from a state-policy table — verify with the county assessor before closing.
Climate risk First Street
- Flood 1/10 Low FEMA zone X (unshaded) · 0% chance over 30 yrs
- Wildfire 1/10 Low
- Heat 2/10 Low 7 d/yr ≥96°F today · 15 d/yr by 30 yrs out
- Wind 2/10 Low
- Air quality 3/10 Moderate 3 unhealthy d/yr today · 4 by 30 yrs out
Nearby sold comps map
Loading sold comps map…
Walkable amenities ~0.75 mi
Loading nearby amenities…
Taxation est. · year 1
- Rental income
- $21,600
- − Mortgage interest
- −$6,918
- − Property taxes
- −$2,494
- − Insurance
- −$618
- − Repairs & maintenance
- −$1,728
- − Management
- −$1,728
- − Depreciation
- −$3,593
- Taxable income
- $4,522
- Est. tax owed @ 24.0%
- −$1,085
- After-tax cash flow
- $5,095/yr
For passive investors: Depreciation is non-cash, so a rental often shows a tax loss while cash-flowing — sheltering income. Rental losses are passive: they offset passive income freely, and up to $25,000/yr can offset ordinary (W-2) income if you actively participate and your MAGI is under $100k (phasing out to $0 by $150k); unused losses carry forward. On sale, claimed depreciation is recaptured at up to 25%, and gains may owe capital-gains tax (a 1031 exchange can defer both). Figures are a year-1 estimate at your 24.0% rate — not tax advice; consult a CPA.
Schools (NCES district)
- District
- Carman-Ainsworth Community Schools
- NCES district ID
- 2607890
- Math proficiency
- 12% ▼ -14.00%
- Reading proficiency
- 28% ▼ -8.00%
- Median HH income
- $39,394
- Composite
- 16.84/100
- National rank
- #9149
- State rank
- #468 of 540 in MI
Livability — Flint
- Score
- 74/100
- State rank
- #196
- US rank
- #4946
Category grades
Schools grade is shown separately in the Schools card above.
Census & demographics
- City population
- 93,814
- Population (ZIP)
- 23,873
Population outlook (Genesee County) Hauer SSP2
- Today (2025)
- 381,312 people
- By 2030
- 362,731 · -4.9%
- By 2040
- 321,550 · -15.7%
- By 2050
- 279,212 · -26.8%
- By 2075
- 193,336 · -49.3%
- By 2100
- 128,118 · -66.4%
Race, ethnicity, and origin ACS 2023
- Neighborhood character
- Predominantly Black (66%)
- Race & ethnicity
- Black 66% White 24% Two or more races 6% Hispanic / Latino 5% Asian 1%
- Common ancestry
- Romanian 2% Lithuanian 1% Italian 1%
- Foreign-born
- 3% · Canada, China
- Languages at home
- 96% English-only · Spanish 2%
Political lean MEDSL · Genesee
- 2024 margin
- Toss-up / Even · D 51.4% · R 47.2% · Other 1.4%
- 2008→2024 swing
- -28.3pp toward R · 2008: 32.5pp · 2024: 4.2pp
- All cycles
- 2024: D+4.2 2020: D+9.3 2016: D+9.5 2012: D+28.2 2008: D+32.5
Not yet ingested
- Civics
- —
Market trends
- HPI YoY
- ▼ -101.67%
- Current HPI
- 94.3111
- Rent YoY
- —
- Metro
- —
- State GDP YoY
- ▲ 1.37%
- F500 in state
- 28
Industry mix (Fortune 500 HQ in MI)
| Industry | F500 HQs | Revenue |
|---|---|---|
| Automotive Parts | 3 | $48B |
|
||
| Automotive | 2 | $372B |
|
||
| Chemicals | 1 | $45B |
|
||
| Automotive Retail | 1 | $29B |
|
||
| Healthcare / Medical Devices | 1 | $23B |
|
||
| Automotive Technology | 1 | $20B |
|
||
Price history
+671.9% since first listed21 events — show timeline
- 2026-04-22 Pending — MiRealSource-MiMLS
- 2026-04-22 Pending — REALCOMP
- 2026-04-16 Listed $123,500 REALCOMP
- 2026-04-16 Listed $123,500 MiRealSource-MiMLS
- 2022-04-15 Listing Removed — REALCOMP
- 2022-02-22 Pending — MiRealSource-MiMLS
- 2022-02-22 Pending — REALCOMP
- 2022-02-21 Listing Removed — MiRealSource-MiMLS
- 2022-02-19 Listed $115,000 MiRealSource-MiMLS
- 2022-02-19 Listed $115,000 REALCOMP
- 2010-02-17 Sold (MLS) $6,000 REALCOMP
- 2009-07-06 Listed $11,900 REALCOMP
- 2009-02-12 Listing Removed — REALCOMP
- 2009-02-12 Listing Removed — MiRealSource-MiMLS
- 2008-04-25 Listed $13,900 REALCOMP
- 2008-04-25 Listed $13,900 MiRealSource-MiMLS
- 2000-12-15 Sold (Public Records) $9,000 Public Records
- 2000-05-23 Listing Removed — MiRealSource-MiMLS
- 1999-12-30 Listed $8,900 MiRealSource-MiMLS
- 1999-08-19 Listing Removed — MiRealSource-MiMLS
- 1999-02-23 Listed $16,000 MiRealSource-MiMLS
Property tax history
+3.5%/yrLatest (2025): $2,494 · +3.3% YoY. Source: county tax records.
Cash-flow waterfall
monthlySold comps — $/sqft
last 12 mo · ≤1 miLoading sold comps…