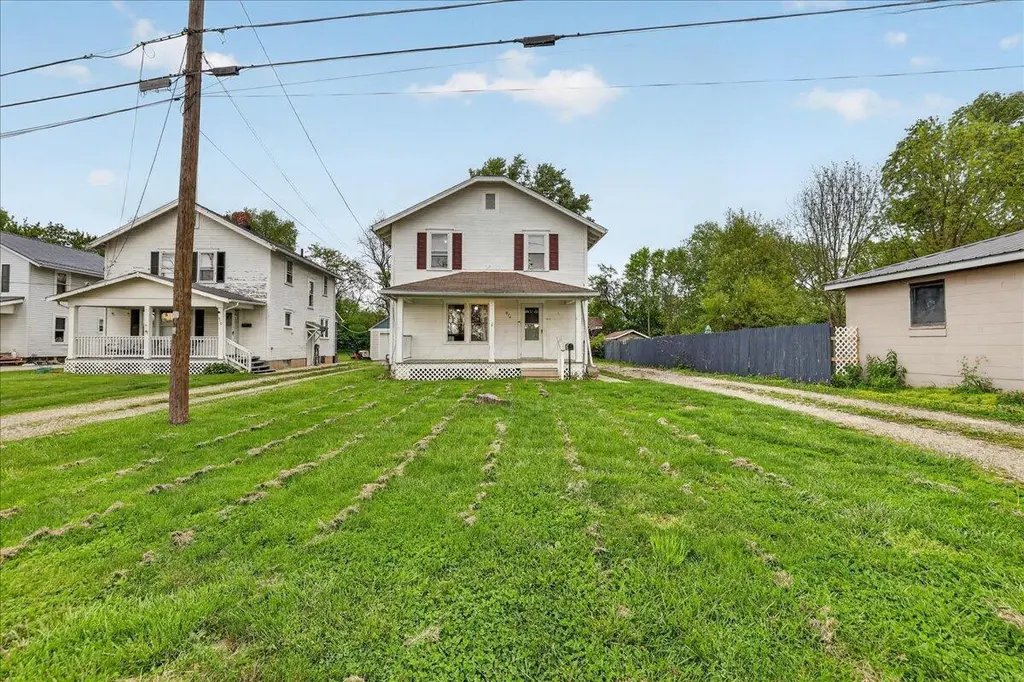
874 Brice St · Newark, OH
Flood risk 1/10 · Minimal
- FEMA flood zone
- X (unshaded)
- Chance of flooding over 30 yrs
- 0.0%
- Est. flood insurance / yr
- $473 – $860
Fire risk 1/10 · Minimal
- Est. fire insurance / yr
- $713 – $1,323
Heat risk 3/10 · Minor
- Hot days now (above 98°F)
- 7 days/yr
- Hot days in 30 yrs
- 18 days/yr
Wind risk 2/10 · Minimal
- Chance of severe wind over 30 yrs
- 1.0%
Air-quality risk 2/10 · Minimal
- Unhealthy air days now
- 1 days/yr
- Unhealthy air days in 30 yrs
- 2 days/yr
Risk factors via First Street. Map © Google.
Why this score? — see what drove the B+ grade
The composite is a weighted blend of 9 inputs, each scored 0–100. Each bar is that input's sub-score; the figure is the points it added to the 100-point composite (weight × sub-score).
- Cash flow +30.0/30.0
- ARV discount +15.0/15.0
- 1% rule +10.0/10.0
- DSCR +10.0/10.0
- Schools +4.3/10.0
- Livability +3.5/5.0
- Rent growth +2.9/5.0
- Condition / age +2.2/5.0
- Appreciation +0.0/10.0
$100,000
🖨 Deal sheet 📄 Offer letter ✓ Due diligence
Listing remarks
LIVE, ONSITE, NON-DISCLOSED RESERVE AUCTION, Saturday, April 25, 2026 at 10:00 AM. This property is being offered at auction. The list price is the starting bid, this is the starting bid. Located in East Newark, this 2-story home features a covered front porch leading into the living room. The main floor includes a dining room and kitchen. Range, microwave, and refrigerator will convey. The second floor offers 3 bedrooms and 1 full bath. Full basement with walk-up access from both the kitchen and exterior side entrance. Stackable washer and dryer will remain. Situated on a 0.23-acre lot with a backyard. Convenient access to State Route 16 with an easy commute to Downtown Newark, Heath, Colu
Key facts
- Covered front porch
- Backyard
- Easy commute
Tags
Property features AI
Finance
- Other: Auction listing condition
Exterior
- Parking: Detached 2-car garage; On-street parking
- Utilities: Public water; Public sewer
- Home design: Single-family home; Two-story
- Construction: Built in 1924; Block foundation
- Exterior features: Deck
Interior
- Flooring: Wood flooring; Carpet; Vinyl flooring
- Bathrooms: 1 full bathroom
- Heating & cooling: Forced air heating; Central air conditioning
- Interior features: Insulated and storm windows; Full basement with walk-up access
Neighborhood map
What this means for you Summary
Snapshot
- This is a 3-bed/1.0-bath single-family listed at $100k. Condition is rated fair.
Deal economics
- At list price, monthly cash flow is $536 ($6k/yr) — positive.
- The deal already cash-flows at list — no discount required.
- Meets the 1% rule at list price ($2k rent vs $100k).
- Recommended offer: $97k (3.0% below list) — sets the bar for market timing.
- Cap rate 12.7% vs local median 3.2% in Newark — top-decile yield for the area; either an underpriced asset or a hidden risk that comps aren't pricing in. Stress-test before assuming the spread holds.
Location & tenants
- Location reads 69/100 on livability (#493 in OH) — a middle-class / working-renter tenant base. Strengths: cost of living A+, housing A+, schools B; Watch: employment D+, amenities F, commute F.
- Newark City (suburban): math 48% / reading 56% proficiency, ranked #431 of 656 in OH (top 66%) — acceptable for families but not a draw, mixed tenant base, ~2y average lease.
- Market conditions: Rents rising (+1.6%/yr); 204 active listings in the ZIP; 3 comparable units currently listed for rent nearby; rentals leasing fast (median 11d on market — plan ~1-2 weeks tenant-placement turnaround); 159 units permitted in Licking County in 2024 (0 in 5+ unit buildings).
Forward outlook
- Local home prices are declining (-3.0%/yr); year-one equity from $691 of loan paydown is wiped out by about $3k of value loss. Plan a longer hold.
- At projected returns (-3.0% appreciation + 1.6% rent growth), your $28k cash investment doubles in ~6 years — after that, you're playing with house money.
Negotiation context
- It's been on market 33 days — a 3% lower offer ($97k) is reasonable based on typical stale-listing flexibility.
Risks & watch-outs
- Watch-outs: built in 1924 — expect roof / HVAC / electrical / plumbing capex.
Questions for the listing agent
- It's been on market 33 days. Have you received any prior offers? Is the seller open to a 3% concession, seller financing, or rate buy-down credit?
- Have any recent inspections been done? Can we get a copy of the seller's disclosures and any deferred-maintenance estimates?
- Built in 1924 — when were the roof, HVAC, electrical panel, plumbing, and water heater last replaced?
- Is there a deadline driving the sale (1031 exchange, divorce, estate, relocation)? That informs how much negotiation room exists.
- Schools are B-rated — typically a magnet for longer-tenancy family renters. What's the average tenant stay here, and is there a school-zone premium baked into asking?
- What's the average days-on-market for RENTAL listings here right now (not sales)? A rising rental-DOM trend means longer vacancies and softer asking-rent achievability than the comps imply.
- What's the recent tenant-quality profile in this submarket — average credit score on applications, eviction rate, late-payment / NSF rate, and stable-employment percentage? A property-management company in the area should have these aggregated.
- How much new for-sale + rental construction is in the pipeline within 1–3 miles? Heavy new supply typically softens prices + rents 12–24 months out; constrained supply supports both.
Investment metrics
- 1% rule
- 1.55% ✓
- Cap rate
- 12.73%
- Cash-on-cash
- 22.98%
- DSCR
- 2.02
- GRM
- 5.4
CMA / ARV
- ARV (on-the-fly)
- $162,432
- Comps found
- 11
Show comp detail 11 sales within ~0.75 mi
| Address | Dist | Beds/Ba | Sqft | Sold | Price | $/sf | Match |
|---|---|---|---|---|---|---|---|
| 28 N Hazelwood Ave | 0.39mi | 3/1.5 | 1,614 (-7%) | 4mo | $225,000 | $139 | 65 |
| 64 Fairmont Ave | 0.58mi | 4/1.5 (+1) | 1,786 (+3%) | 5mo | $168,000 | $94 | 56 |
| 212 Obannon Ave | 0.16mi | 3/2.0 | 1,493 (-14%) | 14mo | $225,000 | $151 | 54 |
| 665 E Main St | 0.49mi | 4/2.0 (+1) | 1,902 (+10%) | 4mo | $159,900 | $84 | 48 |
| 914 E Main Pkwy | 0.21mi | 3/2.0 | 1,952 (+13%) | 20mo | $185,000 | $95 | 48 |
| 836 E Main St | 0.22mi | 3/2.5 | 1,476 (-15%) | 15mo | $120,000 | $81 | 47 |
| 468 Garfield Ave | 0.72mi | 2/2.0 (-1) | 1,580 (-9%) | 1mo | $225,000 | $142 | 43 |
| 228 Wing St | 0.65mi | 3/2.0 | 1,606 (-7%) | 23mo | $210,000 | $131 | 35 |
| 112 Oakwood Ave | 0.73mi | 4/2.0 (+1) | 1,490 (-14%) | 0mo | $140,000 | $94 | 34 |
| 69 Wing St | 0.71mi | 4/2.0 (+1) | 1,652 (-4%) | 23mo | $155,000 | $94 | 32 |
| 79 Wing St | 0.70mi | 4/1.5 (+1) | 1,572 (-9%) | 18mo | $140,000 | $89 | 30 |
Match score weights: distance 35% · size 25% · config 20% · recency 20%. Top-matched comps best support the ARV.
Projected returns pro-forma
-3.0% appreciation · 1.63% rent growth · sell at horizon
- IRR
- 14.4%
- Equity multiple
- 1.57×
- Total profit
- $15,870
- Equity at exit
- $14,910
- IRR
- 22.1%
- Equity multiple
- 2.77×
- Total profit
- $49,490
- Equity at exit
- $8,646
Cash invested: $28,000 (down + closing). Projections, not guarantees.
Landlord ↔ Tenant lean methodology
- Overall (STATE)
- 73 Landlord-Friendly
- State Ohio
- 73 Landlord-Friendly · R+6
- County
- — inherits STATE
- City
- — inherits STATE
ZIP-level market 43055
- Rents YoY
- 1.6%
- Active inventory
- 204
- Price-to-rent
- 5.4×
Monthly cashflow live
- Estimated rent
- $1,545 medium interval (Pro) →
- Mortgage (P&I)
- −$524
- Tax from tax record
- −$118 /mo · $1,420/yr
- Insurance
- −$42
- HOA
- −$0
- Vacancy / Maint / Mgmt
- −$324
- Net cashflow
- $536
Break-even live
UW: 25.0% down · 7.5% · 30yr · 1.5% tax · 5.0% vac · 8.0% maint · 8.0% mgmt
Financing live
Cash to close
- Down payment
- $25,000
- Closing costs
- $3,000
- Reserves months
- —
- Total cash needed
- —
Loan-product check · same deal, 3 products live
Conventional
25% down · 7.5% · 30yr
- Down + closing
- —
- Monthly P&I
- —
- Monthly cashflow
- —
- DSCR
- —
- Eligible?
- —
Personal DTI + credit; lowest rate.
DSCR
20% down · 8.5% · 30yr
- Down + closing
- —
- Monthly P&I
- —
- Monthly cashflow
- —
- DSCR
- —
- Eligible?
- —
No personal income docs; deal must DSCR.
Hard money
10% down · 12.0% · 12mo
- Down + closing
- —
- Monthly P&I
- —
- Monthly cashflow
- —
- DSCR
- —
- Eligible?
- —
Short-term bridge; refi at stabilization.
Rent comps 3 comps
| Address | Beds | Baths | Sqft | Rent | $/sqft | DOM | Units | Dist |
|---|---|---|---|---|---|---|---|---|
| 32 Monroe Ave Newark, OH | 4.0 | 1.5 | 1512 | $1,889 | $1.25 | 43d | 1 | 0.51mi |
| 388 Indiana St Newark, OH | 2.0 | 1.0 | 1200 | $1,100 | $0.92 | 1d | 1 | 0.91mi |
| 27 N Buena Vista St Newark, OH | 3.0 | 2.0 | 1500 | $1,300 | $0.87 | 11d | 1 | 1.41mi |
Listing history 3 events
-
2026-04-28status Pending
-
2026-04-16price $100,000
-
2026-03-25$1 Active
ⓘ Source: listings_history table (triggers on properties + properties_extension) + one-shot
backfill from property_details.listing_events for pre-trigger history.
Tax reassessment forecast OH · Partial reset (capped growth)
- Current annual tax
- $1,420 · $118/mo
- Projected year-2 tax
- $1,490 · $124/mo
- Expected delta
- +$70/yr (+$6/mo · 4.9%)
ⓘ Screening estimate from a state-policy table — verify with the county assessor before closing.
Climate risk First Street
- Flood 1/10 Low FEMA zone X (unshaded) · 0% chance over 30 yrs
- Wildfire 1/10 Low
- Heat 3/10 Moderate 7 d/yr ≥98°F today · 18 d/yr by 30 yrs out
- Wind 2/10 Low 100% chance of damaging wind over 30 yrs
- Air quality 2/10 Low 1 unhealthy d/yr today · 2 by 30 yrs out
Nearby sold comps map
Loading sold comps map…
Walkable amenities ~0.75 mi
Loading nearby amenities…
Taxation est. · year 1
- Rental income
- $18,542
- − Mortgage interest
- −$5,602
- − Property taxes
- −$1,420
- − Insurance
- −$500
- − Repairs & maintenance
- −$1,483
- − Management
- −$1,483
- − Depreciation
- −$2,909
- Taxable income
- $5,145
- Est. tax owed @ 24.0%
- −$1,235
- After-tax cash flow
- $5,201/yr
For passive investors: Depreciation is non-cash, so a rental often shows a tax loss while cash-flowing — sheltering income. Rental losses are passive: they offset passive income freely, and up to $25,000/yr can offset ordinary (W-2) income if you actively participate and your MAGI is under $100k (phasing out to $0 by $150k); unused losses carry forward. On sale, claimed depreciation is recaptured at up to 25%, and gains may owe capital-gains tax (a 1031 exchange can defer both). Figures are a year-1 estimate at your 24.0% rate — not tax advice; consult a CPA.
Condition & rehab AI · 13 photos
This 2-story home requires moderate renovations to improve its curb appeal and functionality. Upgrading the kitchen, bathroom, and exterior can significantly increase its value.
Repairs flagged
- Minor Swing — The swing is in good condition and does not require repair.
- Minor Front porch swing — The swing is in good condition and does not require repair.
- Moderate Landscaping — The front yard is overgrown and needs trimming and planting.
- Moderate Exterior siding — The siding appears aged and may need repainting or replacement.
- Moderate Kitchen cabinets — The cabinets are in good condition but may need updating or refinishing.
- Moderate Bathroom fixtures — The bathroom appears dated and may need updating or replacement.
- Moderate Flooring — The carpeted floors may need cleaning or replacement.
- Moderate Paint — The walls may need repainting to refresh the appearance.
- Minor Ceiling fans — The fans are in good condition and do not require repair.
- Minor Mounted TV — The TV is mounted and does not require repair.
- Minor Ceiling light — The ceiling light is in good condition and does not require repair.
Value-add opportunities
- Both Landscaping and front porch swing — Refreshing the front yard and porch swing can improve curb appeal and attract potential buyers.
- Both Kitchen cabinets and flooring — Updating the kitchen cabinets and flooring can improve the overall look and functionality of the home.
- Both Paint and exterior siding — Repainting the exterior and updating the siding can improve the home's curb appeal and increase its value.
- Both Bathroom fixtures — Updating the bathroom fixtures can improve the home's functionality and increase its value.
- Both Ceiling fans and mounted TV — Updating the ceiling fans and mounted TV can improve the home's functionality and increase its value.
- Both Swing and front porch swing — Refreshing the front yard and porch swing can improve curb appeal and attract potential buyers.
Renovation cost estimate screening
| Repair item | Severity | Est. cost |
|---|---|---|
| Swing · The swing is in good condition and does not require repair. | Minor | $500–3,000 |
| Front porch swing · The swing is in good condition and does not require repair. | Minor | $500–3,000 |
| Landscaping · The front yard is overgrown and needs trimming and planting. | Moderate | $3,000–15,000 |
| Exterior siding · The siding appears aged and may need repainting or replacement. | Moderate | $3,000–15,000 |
| Kitchen cabinets · The cabinets are in good condition but may need updating or refinishing. | Moderate | $3,000–15,000 |
| Bathroom fixtures · The bathroom appears dated and may need updating or replacement. | Moderate | $3,000–15,000 |
| Flooring · The carpeted floors may need cleaning or replacement. | Moderate | $3,000–15,000 |
| Paint · The walls may need repainting to refresh the appearance. | Moderate | $3,000–15,000 |
| Ceiling fans · The fans are in good condition and do not require repair. | Minor | $500–3,000 |
| Mounted TV · The TV is mounted and does not require repair. | Minor | $500–3,000 |
| Ceiling light · The ceiling light is in good condition and does not require repair. | Minor | $500–3,000 |
| Total estimated repair cost · 11 items | $20,500–105,000 |
Value-add ROI direction
- Both Landscaping and front porch swing — Refreshing the front yard and porch swing can improve curb appeal and attract potential buyers. ↑
- Both Kitchen cabinets and flooring — Updating the kitchen cabinets and flooring can improve the overall look and functionality of the home. ↑
- Both Paint and exterior siding — Repainting the exterior and updating the siding can improve the home's curb appeal and increase its value. ↑
- Both Bathroom fixtures — Updating the bathroom fixtures can improve the home's functionality and increase its value. ↑
- Both Ceiling fans and mounted TV — Updating the ceiling fans and mounted TV can improve the home's functionality and increase its value. ↑
- Both Swing and front porch swing — Refreshing the front yard and porch swing can improve curb appeal and attract potential buyers. ↑
ⓘ Cost ranges are severity-bucket heuristics (US national rule-of-thumb). Get contractor quotes + a written scope before underwriting a rehab budget.
Schools (NCES district)
- District
- Newark City
- NCES district ID
- 3904445
- Math proficiency
- 48% ▼ -12.00%
- Reading proficiency
- 56% ▼ -3.00%
- Median HH income
- $38,662
- Composite
- 43.33/100
- National rank
- #3034
- State rank
- #431 of 656 in OH
Livability — Newark
- Score
- 69/100
- State rank
- #493
- US rank
- #8263
Category grades
Schools grade is shown separately in the Schools card above.
Census & demographics
- Census place
- Newark, OH
- County
- Licking County · 109,194 people
- City population
- 63,281
- Metro
- Columbus, OH
- Population (ZIP)
- 63,281
- Household income
- $63,974
- Rent vs Own
- Severe rent burden
- 2269.0
Population outlook (Licking County) Hauer SSP2
- Today (2025)
- 178,210 people
- By 2030
- 180,917 · +1.5%
- By 2040
- 183,885 · +3.2%
- By 2050
- 182,985 · +2.7%
- By 2075
- 178,377 · +0.1%
- By 2100
- 161,075 · -9.6%
Race, ethnicity, and origin ACS 2023
- Neighborhood character
- Predominantly White (89%)
- Race & ethnicity
- White 89% Two or more races 5% Black 3% Hispanic / Latino 2%
- Common ancestry
- Slovak 2% Romanian 2% Lithuanian 2%
- Foreign-born
- 2% · Canada
- Languages at home
- 96% English-only · Spanish 2% Arabic 1%
Political lean MEDSL · Licking
- 2024 margin
- Solid R (+30.0) · D 34.5% · R 64.6%
- 2008→2024 swing
- -14.2pp toward R · 2008: -15.8pp · 2024: -30.0pp
- All cycles
- 2024: R+30.0 2020: R+28.1 2016: R+28.9 2012: R+14.7 2008: R+15.8
Not yet ingested
- Civics
- —
Market trends
- HPI YoY
- ▼ -253.54%
- Current HPI
- 247.9425
- Rent YoY
- ▲ 1.63%
- Metro
- Columbus, OH
- State GDP YoY
- ▲ 1.98%
- F500 in state
- 48
Industry mix (Fortune 500 HQ in OH)
| Industry | F500 HQs | Revenue |
|---|---|---|
| Insurance | 3 | $145B |
|
||
| Industrial Machinery | 3 | $49B |
|
||
| Financial Services | 3 | $24B |
|
||
| Consumer Goods | 2 | $93B |
|
||
| Aerospace / Defense | 2 | $47B |
|
||
| Utilities | 2 | $33B |
|
||
Price history
3 events — show timeline
- 2026-04-28 Pending — CBRMLS
- 2026-04-16 Price Changed $100,000 CBRMLS
- 2026-03-25 Listed $1 CBRMLS
Property tax history
+9.8%/yrLatest (2025): $1,420 · +2.6% YoY. Source: county tax records.
Cash-flow waterfall
monthlySold comps — $/sqft
last 12 mo · ≤1 miLoading sold comps…