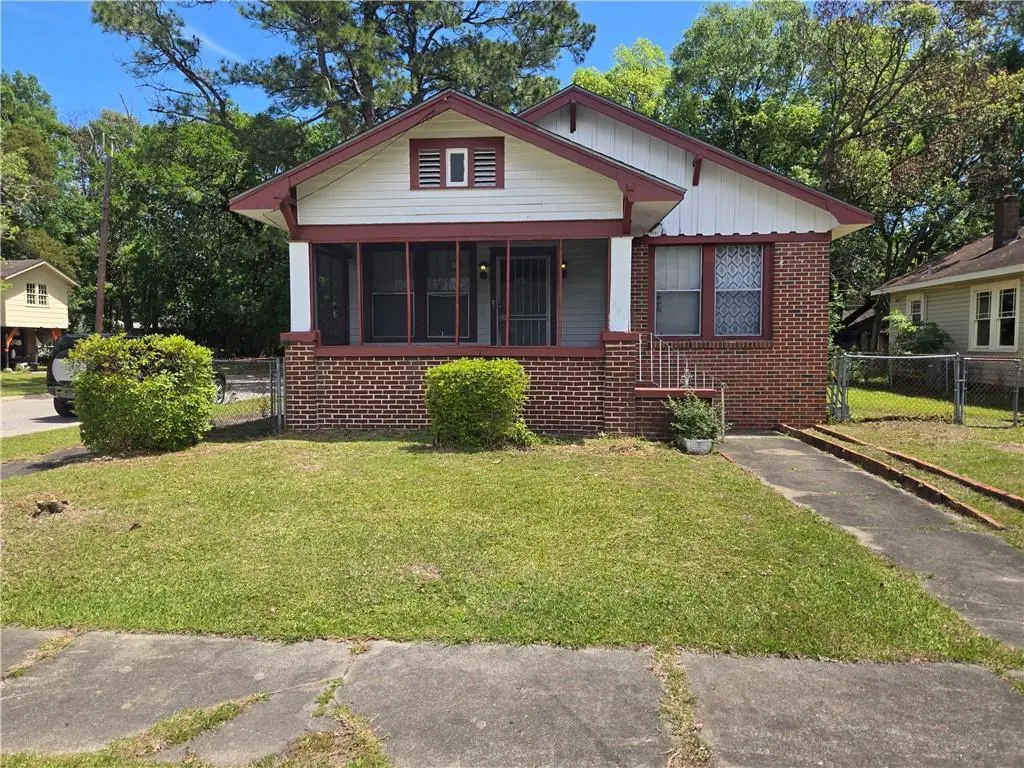
451 Wisconsin Ave · Mobile, AL
Flood risk 1/10 · Minimal
- FEMA flood zone
- X (unshaded)
- Chance of flooding over 30 yrs
- 0.0%
- Est. flood insurance / yr
- $507 – $1,088
Fire risk 1/10 · Minimal
- Est. fire insurance / yr
- $916 – $1,700
Heat risk 9/10 · Severe
- Hot days now (above 105°F)
- 7 days/yr
- Hot days in 30 yrs
- 21 days/yr
Wind risk 9/10 · Severe
- Chance of severe wind over 30 yrs
- 99.0%
Air-quality risk 2/10 · Minimal
- Unhealthy air days now
- 1 days/yr
- Unhealthy air days in 30 yrs
- 1 days/yr
Risk factors via First Street. Map © Google.
Why this score? — see what drove the B- grade
The composite is a weighted blend of 9 inputs, each scored 0–100. Each bar is that input's sub-score; the figure is the points it added to the 100-point composite (weight × sub-score).
- Cash flow +30.0/30.0
- 1% rule +10.0/10.0
- DSCR +10.0/10.0
- ARV discount +7.5/15.0
- Livability +3.8/5.0
- Rent growth +3.4/5.0
- Condition / age +2.5/5.0
- Schools +2.3/10.0
- Appreciation +0.0/10.0
$104,000
🖨 Deal sheet 📄 Offer letter ✓ Due diligence
Listing remarks
This 3 bedroom 2 bath home has so much potential! Located on a corner lot, this home is ready for you to come add your personal touches or would be a great investment for your portfolio. Schedule to view with your favorite realtor before you miss it!
Key facts
- 7,605 sq ft lot
- 2 garage spots
- Listed 17 days
Property features AI
Exterior
- Parking: Detached garage; Driveway parking; Total parking for 4 vehicles; 2-car garage
- Utilities: Cable available; Electricity available; Natural gas available; Water available; 220 volts in workshop; Public sewer
- Home design: Single family residence; Residential property; Corner lot with a view
- Construction: Brick 4 sides construction; Pillar/post/pier foundation; Other roof
- Exterior features: Back yard with chain link fencing; Outdoor kitchen; Detached storage; Garage(s)
Interior
- Kitchen: Gas range; Kitchen island; Breakfast bar; Breakfast room; Other surface counters; Open view to family room
- Bedrooms: 3 bedrooms
- Flooring: Hardwood; Other flooring
- Bathrooms: 2 full bathrooms
- Heating & cooling: Central heating (natural gas); Central air conditioning
- Interior features: Fireplace; Double-sided fireplace serving the family room; Dining L configuration; Breakfast bar and breakfast room; Kitchen island; Kitchen has view to family room; Storage space
- Laundry & utility: Gas water heater
Neighborhood map
What this means for you Summary
Snapshot
- This is a 3-bed/2.0-bath single-family listed at $104k.
Deal economics
- At list price, monthly cash flow is $742 ($9k/yr) — positive.
- The deal already cash-flows at list — no discount required.
- Meets the 1% rule at list price ($2k rent vs $104k).
- Recommended offer: $102k (1.5% below list) — sets the bar for market timing.
- Cap rate 14.9% vs local median 4.9% in Mobile — top-decile yield for the area; either an underpriced asset or a hidden risk that comps aren't pricing in. Stress-test before assuming the spread holds.
Location & tenants
- Location reads 75/100 on livability (#20 in AL, #4,262 nationally) — a middle-class / working-renter tenant base. Strengths: commute A+, cost of living A+, housing A+; Watch: crime F, employment D-.
- Mobile County (urban): math 15% / reading 39% proficiency, ranked #81 of 129 in AL (top 63%) — low school quality limits family demand, transient renter base, plan for 1-2y turnover; 67% free/reduced lunch — lower-income household profile, screen leases tightly.
- Zoned schools: Leinkauf Elementary School (math 8% / reading 26%, grade F, #499 of 627 statewide, top 80%, 538 students, 91% FRL); Murphy High School (math 10% / reading 19%, grade F, #220 of 305 statewide, top 77%, 1,254 students, 66% FRL).
- Market conditions: Rents rising (+3.8%/yr); 93 active listings in the ZIP; 27 comparable units currently listed for rent nearby; rentals lingering (median 44d on market — plan ~5-8 weeks vacancy on turnover, expect pricing pressure); 56% of comp listings sitting > 30 days — soft ceiling on asking rent; 1,678 units permitted in Mobile County in 2024 (264 in 5+ unit buildings).
- This rent runs 33% of the median local income ($66k/yr) — at the standard rent-burdened threshold; future hikes will face affordability resistance.
Forward outlook
- Local home prices are declining (-3.0%/yr); year-one equity from $719 of loan paydown is wiped out by about $3k of value loss. Plan a longer hold.
- Mobile County population projected to shrink 8% by 2050 — rents likely to lag national; underwrite the cash flow, not the appreciation.
- At projected returns (-3.0% appreciation + 3.8% rent growth), your $29k cash investment doubles in ~4 years — after that, you're playing with house money.
Negotiation context
- It's been on market 17 days — a 2% lower offer ($102k) is reasonable based on typical stale-listing flexibility.
Risks & watch-outs
- Climate carrying-cost: severe wind risk, 99% chance of damaging wind over 30y; extreme-heat days projected 7→21/yr by 2055 (HVAC capex compounding) — expect insurance premiums to compound above CPI over the hold.
Questions for the listing agent
- Is there a deadline driving the sale (1031 exchange, divorce, estate, relocation)? That informs how much negotiation room exists.
- Schools are D-rated, which usually means shorter tenancies and higher turnover. Who's the typical renter profile here, and what's been the actual vacancy rate?
- Crime grade is F in this area — have there been break-ins, vandalism, or insurance claims at this property in the last 3 years? What carrier currently insures it and at what premium?
- What's the average days-on-market for RENTAL listings here right now (not sales)? A rising rental-DOM trend means longer vacancies and softer asking-rent achievability than the comps imply.
- What's the recent tenant-quality profile in this submarket — average credit score on applications, eviction rate, late-payment / NSF rate, and stable-employment percentage? A property-management company in the area should have these aggregated.
- How much new for-sale + rental construction is in the pipeline within 1–3 miles? Heavy new supply typically softens prices + rents 12–24 months out; constrained supply supports both.
Investment metrics
- 1% rule
- 1.73% ✓
- Cap rate
- 14.85%
- Cash-on-cash
- 30.57%
- DSCR
- 2.36
- GRM
- 4.8
CMA / ARV
- ARV (on-the-fly)
- $255,528
- Comps found
- 12
Show comp detail 12 sales within ~0.75 mi
| Address | Dist | Beds/Ba | Sqft | Sold | Price | $/sf | Match |
|---|---|---|---|---|---|---|---|
| 451 Wisconsin Ave | 0.00mi | 3/2.0 | 1,512 (0%) | 1mo | $98,000 | $65 | 100 |
| 1561 Bruister St | 0.49mi | 2/2.0 (-1) | 1,504 (-0%) | 3mo | $330,000 | $219 | 69 |
| 409 Wisconsin Ave | 0.07mi | 3/1.0 | 1,288 (-15%) | 6mo | $82,500 | $64 | 63 |
| 29 Monterey St S | 0.72mi | 3/1.0 | 1,516 (+0%) | 5mo | $139,900 | $92 | 58 |
| 121 Macy Pl | 0.54mi | 3/2.0 | 1,375 (-9%) | 3mo | $280,000 | $204 | 57 |
| 273 Park Ter | 0.40mi | 3/2.0 | 1,720 (+14%) | 5mo | $435,000 | $253 | 54 |
| 1809 Calmes St | 0.69mi | 4/2.0 (+1) | 1,420 (-6%) | 0mo | $45,000 | $32 | 52 |
| 1461 Brown St | 0.60mi | 3/2.0 | 1,675 (+11%) | 2mo | $260,000 | $155 | 52 |
| 271 Park Ter | 0.40mi | 2/2.5 (-1) | 1,710 (+13%) | 3mo | $289,500 | $169 | 50 |
| 1253 Gorgas St | 0.62mi | 2/2.0 (-1) | 1,666 (+10%) | 1mo | $22,000 | $13 | 48 |
| 55 Monterey St S | 0.64mi | 2/2.0 (-1) | 1,366 (-10%) | 1mo | $260,000 | $190 | 48 |
| 1367 Brown St | 0.60mi | 2/2.0 (-1) | 1,700 (+12%) | 3mo | $293,000 | $172 | 44 |
Match score weights: distance 35% · size 25% · config 20% · recency 20%. Top-matched comps best support the ARV.
Projected returns pro-forma
-3.0% appreciation · 3.78% rent growth · sell at horizon
- IRR
- 26.1%
- Equity multiple
- 2.09×
- Total profit
- $31,826
- Equity at exit
- $15,507
- IRR
- 34.2%
- Equity multiple
- 4.25×
- Total profit
- $94,508
- Equity at exit
- $8,992
Cash invested: $29,120 (down + closing). Projections, not guarantees.
Landlord ↔ Tenant lean methodology
- Overall (STATE)
- 90 Strongly Landlord-Friendly
- State Alabama
- 90 Strongly Landlord-Friendly · R+15
- County
- — inherits STATE
- City
- — inherits STATE
ZIP-level market 36604
- Rents YoY
- 3.8%
- Active inventory
- 93
- Price-to-rent
- 4.8×
Monthly cashflow live
- Estimated rent
- $1,800 high interval (Pro) →
- Mortgage (P&I)
- −$545
- Tax from tax record
- −$92 /mo · $1,100/yr
- Insurance
- −$43
- HOA
- −$0
- Vacancy / Maint / Mgmt
- −$378
- Net cashflow
- $742
Break-even live
UW: 25.0% down · 7.5% · 30yr · 1.5% tax · 5.0% vac · 8.0% maint · 8.0% mgmt
Financing live
Cash to close
- Down payment
- $26,000
- Closing costs
- $3,120
- Reserves months
- —
- Total cash needed
- —
Loan-product check · same deal, 3 products live
Conventional
25% down · 7.5% · 30yr
- Down + closing
- —
- Monthly P&I
- —
- Monthly cashflow
- —
- DSCR
- —
- Eligible?
- —
Personal DTI + credit; lowest rate.
DSCR
20% down · 8.5% · 30yr
- Down + closing
- —
- Monthly P&I
- —
- Monthly cashflow
- —
- DSCR
- —
- Eligible?
- —
No personal income docs; deal must DSCR.
Hard money
10% down · 12.0% · 12mo
- Down + closing
- —
- Monthly P&I
- —
- Monthly cashflow
- —
- DSCR
- —
- Eligible?
- —
Short-term bridge; refi at stabilization.
Rent comps 27 comps
| Address | Beds | Baths | Sqft | Rent | $/sqft | DOM | Units | Dist |
|---|---|---|---|---|---|---|---|---|
| 1417 Monroe St Mobile, AL | 2.0 | 1.0 | 1064 | $1,350 | $1.27 | 44d | 1 | 0.30mi |
| 84 S Lafayette St Unit 1043577P Mobile, AL | 3.0 | 2.0 | 1496 | $3,116 | $2.08 | 13d | 1 | 0.47mi |
| 107 Macy Pl Mobile, AL | 3.0 | 2.0 | 1800 | $2,250 | $1.25 | 44d | 1 | 0.61mi |
| 1660 Laurel St Mobile, AL | 3.0 | 2.0 | 1768 | $2,200 | $1.24 | 13d | 1 | 0.61mi |
| 1204 Seneca St Mobile, AL | 3.0 | 2.0 | 1425 | $1,345 | $0.94 | 13d | 1 | 0.74mi |
| 1704 McGill Ave Unit B Mobile, AL | 3.0 | 2.5 | 1500 | $1,750 | $1.17 | 44d | 1 | 0.75mi |
| 1141 Montauk Ave Unit 1043864P Mobile, AL | 3.0 | 2.0 | 1420 | $2,741 | $1.93 | 13d | 1 | 0.81mi |
| 122 Demouy Ave Unit 1/2 Mobile, AL | 2.0 | 1.0 | 1300 | $1,530 | $1.18 | 44d | 1 | 0.82mi |
| 1566 Dauphin St Unit Back Carriage House Mobile, AL | 3.0 | 1.0 | 1300 | $1,200 | $0.92 | 44d | 1 | 0.87mi |
| 561 Dauphin Island Pkwy Mobile, AL | 4.0 | 2.0 | 1389 | $1,050 | $0.76 | 44d | 1 | 0.92mi |
| 611 Dauphin Island Pkwy Mobile, AL | 3.0 | 2.0 | 1450 | $1,300 | $0.90 | 44d | 1 | 0.95mi |
| 711 Marine St Mobile, AL | 2.0 | 1.0 | 1100 | $1,150 | $1.05 | 44d | 1 | 0.96mi |
| 706 Cherokee St Mobile, AL | 3.0 | 1.0 | 1260 | $1,375 | $1.09 | 21d | 1 | 0.97mi |
| 814 S Broad St Unit 1043690P Mobile, AL | 3.0 | 2.0 | 1991 | $3,562 | $1.79 | 13d | 1 | 1.03mi |
| 957 Savannah St Mobile, AL | 2.0 | 1.5 | 1054 | $1,400 | $1.33 | 21d | 1 | 1.04mi |
| 182 Williams St Unit 1043570P Mobile, AL | 3.0 | 1.0 | 1399 | $2,476 | $1.77 | 13d | 1 | 1.06mi |
| 57 N Ann St Unit 1043453P Mobile, AL | 2.0 | 2.0 | 1065 | $2,015 | $1.89 | 21d | 1 | 1.06mi |
| 209 S Fulton St Mobile, AL | 2.0 | 1.5 | 1255 | $1,750 | $1.39 | 21d | 1 | 1.08mi |
| 107 Michael Donald Ave Unit 1043461P Mobile, AL | 4.0 | 3.5 | 2195 | $3,962 | $1.81 | 13d | 1 | 1.15mi |
| 562 Clarke St Mobile, AL | 2.0 | 1.0 | 1061 | $1,025 | $0.97 | 44d | 1 | 1.19mi |
| 811 Gorgas St Mobile, AL | 4.0 | 1.0 | 1300 | $1,310 | $1.01 | 44d | 1 | 1.21mi |
| 129 Shell Road Pl Unit 1043713P Mobile, AL | 4.0 | 2.0 | 1496 | $3,389 | $2.27 | 21d | 1 | 1.22mi |
| 1321 SpringHill Ave Unit B Mobile, AL | 2.0 | 1.0 | 2006 | $950 | $0.47 | 44d | 1 | 1.23mi |
| 961 Old Shell Rd Unit A Mobile, AL | 3.0 | 2.5 | 1600 | $1,295 | $0.81 | 44d | 1 | 1.30mi |
| 618 Clarke St Mobile, AL | 3.0 | 1.0 | 1427 | $1,200 | $0.84 | 44d | 1 | 1.31mi |
| 615 Mohawk St Mobile, AL | 3.0 | 1.0 | 1172 | $1,500 | $1.28 | 44d | 1 | 1.31mi |
| 2068 Victory Ct Mobile, AL | 4.0 | 1.0 | 1259 | $1,225 | $0.97 | 44d | 1 | 1.48mi |
Listing history 3 events
-
2026-04-30status Pending
-
2026-04-29price $104,000
-
2026-04-13$109,000 Active
ⓘ Source: listings_history table (triggers on properties + properties_extension) + one-shot
backfill from property_details.listing_events for pre-trigger history.
Tax reassessment forecast AL · Resets to sale price
- Current annual tax
- $1,100 · $92/mo
- Projected year-2 tax
- $1,100 · $92/mo
- Expected delta
- $0/yr ($0/mo · 0.0%)
ⓘ Screening estimate from a state-policy table — verify with the county assessor before closing.
Climate risk First Street
- Flood 1/10 Low FEMA zone X (unshaded) · 0% chance over 30 yrs
- Wildfire 1/10 Low
- Heat 9/10 Extreme 7 d/yr ≥105°F today · 21 d/yr by 30 yrs out
- Wind 9/10 Extreme 99% chance of damaging wind over 30 yrs
- Air quality 2/10 Low 1 unhealthy d/yr today · 1 by 30 yrs out
Nearby sold comps map
Loading sold comps map…
Walkable amenities ~0.75 mi
Loading nearby amenities…
Taxation est. · year 1
- Rental income
- $21,604
- − Mortgage interest
- −$5,826
- − Property taxes
- −$1,100
- − Insurance
- −$520
- − Repairs & maintenance
- −$1,728
- − Management
- −$1,728
- − Depreciation
- −$3,025
- Taxable income
- $7,676
- Est. tax owed @ 24.0%
- −$1,842
- After-tax cash flow
- $7,060/yr
For passive investors: Depreciation is non-cash, so a rental often shows a tax loss while cash-flowing — sheltering income. Rental losses are passive: they offset passive income freely, and up to $25,000/yr can offset ordinary (W-2) income if you actively participate and your MAGI is under $100k (phasing out to $0 by $150k); unused losses carry forward. On sale, claimed depreciation is recaptured at up to 25%, and gains may owe capital-gains tax (a 1031 exchange can defer both). Figures are a year-1 estimate at your 24.0% rate — not tax advice; consult a CPA.
Schools (NCES district)
- District
- Mobile County
- NCES district ID
- 0102370
- Math proficiency
- 15% ▼ -28.00%
- Reading proficiency
- 39% ▬ 0.00%
- Median HH income
- $42,455
- Composite
- 22.9/100
- National rank
- #8002
- State rank
- #81 of 129 in AL
Livability — Mobile
- Score
- 75/100
- State rank
- #20
- US rank
- #4262
Category grades
Schools grade is shown separately in the Schools card above.
Census & demographics
- Census place
- Mobile, AL
- County
- Mobile County · 246,577 people
- City population
- 205,729
- Metro
- Mobile, AL
- Population (ZIP)
- 8,836
- Household income
- $66,357
- Rent vs Own
- Severe rent burden
- 452.0
Population outlook (Mobile County) Hauer SSP2
- Today (2025)
- 415,303 people
- By 2030
- 411,755 · -0.9%
- By 2040
- 399,670 · -3.8%
- By 2050
- 382,616 · -7.9%
- By 2075
- 337,353 · -18.8%
- By 2100
- 283,391 · -31.8%
Race, ethnicity, and origin ACS 2023
- Neighborhood character
- Diverse neighborhood (Simpson 0.56)
- Race & ethnicity
- White 51% Black 42% Two or more races 3% Hispanic / Latino 2%
- Common ancestry
- Lithuanian 4% Serbian 2% Slovak 2%
- Foreign-born
- 2% · Canada, China
- Languages at home
- 97% English-only · Spanish 2%
Political lean MEDSL · Mobile
- 2024 margin
- R (+16.4) · D 41.3% · R 57.7%
- 2008→2024 swing
- -7.7pp toward R · 2008: -8.7pp · 2024: -16.4pp
- All cycles
- 2024: R+16.4 2020: R+11.9 2016: R+13.9 2012: R+9.3 2008: R+8.7
Not yet ingested
- Civics
- —
Market trends
- HPI YoY
- ▼ -143.27%
- Current HPI
- 205.7241
- Rent YoY
- ▲ 3.78%
- Metro
- Mobile, AL
- State GDP YoY
- ▲ 2.94%
- F500 in state
- 4
Industry mix (Fortune 500 HQ in AL)
| Industry | F500 HQs | Revenue |
|---|---|---|
| Financial Services | 1 | $8B |
|
||
| Healthcare | 1 | $5B |
|
||
Price history
-4.6% since first listed3 events — show timeline
- 2026-04-30 Pending — GCMLS AL
- 2026-04-29 Price Changed $104,000 GCMLS AL
- 2026-04-13 Listed $109,000 GCMLS AL
Property tax history
+2.4%/yrLatest (2025): $1,100 · +6.9% YoY. Source: county tax records.
Cash-flow waterfall
monthlySold comps — $/sqft
last 12 mo · ≤1 miLoading sold comps…