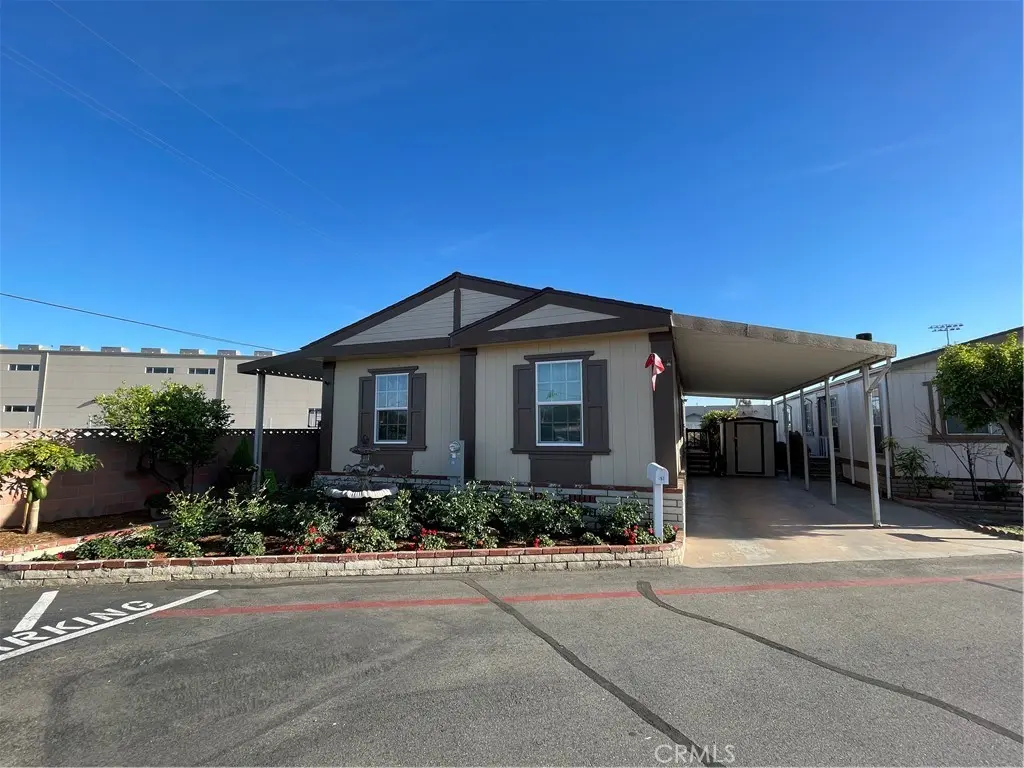
12152 Trask #57 · Garden Grove, CA
Flood risk 3/10 · Minor
- FEMA flood zone
- A
- Chance of flooding over 30 yrs
- 0.09%
- Est. flood insurance / yr
- $1,009 – $1,996
Fire risk 1/10 · Minimal
- Est. fire insurance / yr
- $659 – $1,223
Heat risk 5/10 · Moderate
- Hot days now (above 89°F)
- 7 days/yr
- Hot days in 30 yrs
- 23 days/yr
Wind risk 1/10 · Minimal
- Chance of severe wind over 30 yrs
- —
Air-quality risk 6/10 · Moderate
- Unhealthy air days now
- 12 days/yr
- Unhealthy air days in 30 yrs
- 13 days/yr
Risk factors via First Street. Map © Google.
Why this score? — see what drove the C grade
The composite is a weighted blend of 9 inputs, each scored 0–100. Each bar is that input's sub-score; the figure is the points it added to the 100-point composite (weight × sub-score).
- Cash flow +27.8/30.0
- DSCR +9.8/10.0
- 1% rule +7.6/10.0
- Schools +4.5/10.0
- Livability +3.3/5.0
- Rent growth +2.5/5.0
- Condition / age +2.5/5.0
- ARV discount +0.0/15.0
- Appreciation +0.0/10.0
$239,499
🖨 Deal sheet 📄 Offer letter ✓ Due diligence
Listing remarks MLS
Well-kept 3 bedroom, 2 bathroom (PLUS a bonus office) manufactured home in Garden Grove offering a comfortable and functional layout. The home features a bright living area, a practical kitchen, and good natural light throughout. The primary bedroom includes a private bathroom, and the additional bedrooms provide flexible space for family, guests, or a home office. Conveniently located near shopping, restaurants, schools, and major freeways, making everyday living easy and accessible. Great opportunity to own an affordable home in Orange County.
Key facts
- 7.7 acre lot
- 2 parking spots
- Community pool
Neighborhood map
What this means for you Summary
Snapshot
- This is a 3-bed/2.0-bath manufactured listed at $239k.
Deal economics
- At list price, monthly cash flow is $606 ($7k/yr) — positive.
- The deal already cash-flows at list — no discount required.
- Meets the 1% rule at list price ($3k rent vs $239k).
- Recommended offer: $225k (6.0% below list) — sets the bar for market timing.
- Cap rate 10.0% vs local median 1.8% in Garden Grove — top-decile yield for the area; either an underpriced asset or a hidden risk that comps aren't pricing in. Stress-test before assuming the spread holds.
Location & tenants
- Location reads 66/100 on livability (#343 in CA) — a middle-class / working-renter tenant base. Strengths: commute A+, employment A; Watch: schools C-, amenities D+, cost of living F.
- Garden Grove Unified (suburban): math 38% / reading 65% proficiency, ranked #132 of 517 in CA (top 26%) — acceptable for families but not a draw, mixed tenant base, ~2y average lease; 60% free/reduced lunch — lower-income household profile, screen leases tightly.
- Market conditions: 30 active listings in the ZIP; 37 comparable units currently listed for rent nearby; rentals at typical pace (median 19d on market — plan ~3-4 weeks tenant-placement turnaround); solid renter incomes; 6,974 units permitted in Orange County in 2024 (3,839 in 5+ unit buildings).
- This rent runs 45% of the median local income ($81k/yr) — at the standard rent-burdened threshold; future hikes will face affordability resistance.
Forward outlook
- Local home prices are declining (-3.0%/yr); year-one equity from $2k of loan paydown is wiped out by about $7k of value loss. Plan a longer hold.
- Orange County population projected at +14% by 2050 — modest demand growth; plan on rents tracking national, not racing it.
- At projected returns (-3.0% appreciation + 3.0% rent growth), your $67k cash investment doubles in ~10 years — after that, you're playing with house money.
Negotiation context
- It's been on market 79 days — a 6% lower offer ($225k) is reasonable based on typical stale-listing flexibility.
Risks & watch-outs
- Watch-outs: flood insurance adds $125/mo.
- Climate carrying-cost: in FEMA flood zone A (mandatory federal flood insurance); extreme-heat days projected 7→23/yr by 2055 (HVAC capex compounding) — expect insurance premiums to compound above CPI over the hold.
Questions for the listing agent
- It's been on market 79 days. Have you received any prior offers? Is the seller open to a 6% concession, seller financing, or rate buy-down credit?
- What's the actual annual flood-insurance premium (NFIP or private), and is the property in a SFHA with mandatory coverage?
- Why hasn't it sold? Are there any deal-killer items the seller is aware of (foundation, flood, title, zoning, code violations)?
- Is there a deadline driving the sale (1031 exchange, divorce, estate, relocation)? That informs how much negotiation room exists.
- What's the average days-on-market for RENTAL listings here right now (not sales)? A rising rental-DOM trend means longer vacancies and softer asking-rent achievability than the comps imply.
- What's the recent tenant-quality profile in this submarket — average credit score on applications, eviction rate, late-payment / NSF rate, and stable-employment percentage? A property-management company in the area should have these aggregated.
- How much new for-sale + rental construction is in the pipeline within 1–3 miles? Heavy new supply typically softens prices + rents 12–24 months out; constrained supply supports both.
Investment metrics
- 1% rule
- 1.26% ✓
- Cap rate
- 9.96%
- Cash-on-cash
- 13.09%
- DSCR
- 1.58
- GRM
- 6.6
CMA / ARV
- ARV (median comp)
- $170,000
- List price
- $239,499
- Delta
- 40.88%
- Verdict
- OVERPRICED
- Comps
- 14 within 1.0 mi
Show comp detail 7 sales within ~0.75 mi
| Address | Dist | Beds/Ba | Sqft | Sold | Price | $/sf | Match |
|---|---|---|---|---|---|---|---|
| 13096 Blackbird St #167 | 0.45mi | 3/2.0 | 1,185 (-1%) | 16mo | $178,200 | $150 | 64 |
| 230 Green Dr | 0.67mi | 3/2.0 | 1,248 (+4%) | 4mo | $170,000 | $136 | 59 |
| 3424 W Washington Ave #539 | 0.67mi | 3/2.0 | 1,104 (-8%) | 1mo | $139,000 | $126 | 55 |
| 13096 Blackbird #82 | 0.50mi | 4/2.0 (+1) | 1,100 (-8%) | 4mo | $270,000 | $245 | 55 |
| 1300 Clinton St #27 | 0.74mi | 3/2.0 | 1,104 (-8%) | 21mo | $195,000 | $177 | 35 |
| 511 Willow Dr | 0.68mi | 3/2.0 | 1,062 (-12%) | 18mo | $142,600 | $134 | 35 |
| 12861 West St #153 | 0.75mi | 3/2.0 | 1,368 (+14%) | 15mo | $172,000 | $126 | 29 |
Match score weights: distance 35% · size 25% · config 20% · recency 20%. Top-matched comps best support the ARV.
Projected returns pro-forma
-3.0% appreciation · 3.0% rent growth · sell at horizon
- IRR
- -0.0%
- Equity multiple
- 1.00×
- Total profit
- $-79
- Equity at exit
- $35,710
- IRR
- 9.7%
- Equity multiple
- 1.75×
- Total profit
- $50,143
- Equity at exit
- $20,707
Cash invested: $67,060 (down + closing). Projections, not guarantees.
Landlord ↔ Tenant lean methodology
- Overall (STATE)
- 18 Strongly Tenant-Friendly
- State California
- 18 Strongly Tenant-Friendly · D+13
- County
- — inherits STATE
- City
- — inherits STATE
ZIP-level market 92843
- Active inventory
- 30
- Price-to-rent
- 6.6×
Monthly cashflow live
- Estimated rent
- $3,021 high interval (Pro) →
- Mortgage (P&I)
- −$1,256
- Tax est. 1.5%
- −$299 /mo · $3,592/yr
- Insurance
- −$100
- Flood insurance flood zone
- −$125 /mo · $1,502/yr
- HOA
- −$0
- Vacancy / Maint / Mgmt
- −$634
- Net cashflow
- $606
Break-even live
UW: 25.0% down · 7.5% · 30yr · 1.5% tax · 5.0% vac · 8.0% maint · 8.0% mgmt
Financing live
Cash to close
- Down payment
- $59,875
- Closing costs
- $7,185
- Reserves months
- —
- Total cash needed
- —
Loan-product check · same deal, 3 products live
Conventional
25% down · 7.5% · 30yr
- Down + closing
- —
- Monthly P&I
- —
- Monthly cashflow
- —
- DSCR
- —
- Eligible?
- —
Personal DTI + credit; lowest rate.
DSCR
20% down · 8.5% · 30yr
- Down + closing
- —
- Monthly P&I
- —
- Monthly cashflow
- —
- DSCR
- —
- Eligible?
- —
No personal income docs; deal must DSCR.
Hard money
10% down · 12.0% · 12mo
- Down + closing
- —
- Monthly P&I
- —
- Monthly cashflow
- —
- DSCR
- —
- Eligible?
- —
Short-term bridge; refi at stabilization.
Rent comps 37 comps
| Address | Beds | Baths | Sqft | Rent | $/sqft | DOM | Units | Dist |
|---|---|---|---|---|---|---|---|---|
| 12562 Cardinal Ave Unit B Garden Grove, CA | 3.0 | 1.0 | 1100 | $2,800 | $2.55 | 43d | 1 | 0.38mi |
| 3630 Westminster Ave Santa Ana, CA | 2.0 | 2.0 | 997 | $2,758 | $2.77 | 43d | 1 | 0.50mi |
| 11655 Trask Ave Unit 6 Garden Grove, CA | 2.0 | 2.0 | 950 | $2,800 | $2.95 | 43d | 1 | 0.53mi |
| 11655 Trask Ave Unit 3 Garden Grove, CA | 2.0 | 2.0 | 950 | $2,750 | $2.89 | 43d | 1 | 0.53mi |
| 1500 N Harbor Blvd Santa Ana, CA | 1.0–2.0 | 1.0–2.0 | 780 | $2,575 | $3.30 | 15d | 1 | 0.62mi |
| 1314 N Harbor Blvd Santa Ana, CA | 2.0 | 2.0 | 884 | $2,742 | $3.10 | 13d | 4 | 0.67mi |
| 12777 Garden Grove Blvd Garden Grove, CA | 1.0–2.0 | 1.0–2.0 | 731 | $2,470 | $3.38 | 7d | 3 | 0.73mi |
| 12842 Palm St #6 Garden Grove, CA | 2.0 | 1.0 | 864 | $2,400 | $2.78 | 24d | 1 | 0.74mi |
| 11782 Garden Grove Blvd Unit C Garden Grove, CA | 2.0 | 2.0 | 850 | $2,550 | $3.00 | 43d | 1 | 0.79mi |
| 13032 Newhope St Unit B Garden Grove, CA | 2.0 | 2.0 | 850 | $2,400 | $2.82 | 43d | 1 | 0.86mi |
| 13100 Garden Grove Blvd Garden Grove, CA | 2.0 | 2.0 | 902 | $2,700 | $2.99 | 43d | 1 | 0.90mi |
| 12611 Sungrove Cir Garden Grove, CA | 3.0 | 2.0 | 1258 | $3,350 | $2.66 | 22d | 1 | 1.08mi |
| 1610 N King St Santa Ana, CA | 1.0–2.0 | 1.0–2.0 | 808 | $2,400 | $2.97 | 43d | 1 | 1.12mi |
| 12602 Citruswood Ave Garden Grove, CA | 3.0 | 2.0 | 1000 | $6,000 | $6.00 | 1d | 1 | 1.14mi |
| 2111 W 17th St Santa Ana, CA | 1.0–2.0 | 1.0–2.0 | 756 | $2,880 | $3.81 | 12d | 8 | 1.15mi |
| 13884 Euclid St Unit F08 Garden Grove, CA | 2.0 | 1.5 | 900 | $2,895 | $3.22 | 24d | 1 | 1.20mi |
| 13884 Euclid St Unit D07 Garden Grove, CA | 3.0 | 1.5 | 1060 | $3,300 | $3.11 | 2d | 1 | 1.20mi |
| 13884 Euclid St Apt C12 Garden Grove, CA | 3.0 | 1.5 | 1060 | $3,335 | $3.15 | 24d | 1 | 1.20mi |
| 13772 Euclid St Unit 3 Garden Grove, CA | 2.0 | 2.5 | 1200 | $2,800 | $2.33 | 43d | 1 | 1.20mi |
| 13884 Euclid St Garden Grove, CA | 2.0–3.0 | 1.5 | 980 | $3,300 | $3.37 | 2d | 4 | 1.20mi |
| 4109 W 5th St Unit C3 Santa Ana, CA | 2.0 | 2.0 | 921 | $2,900 | $3.15 | 43d | 1 | 1.23mi |
| 4109 W 5th St Unit C3 Santa Ana, CA | 2.0 | 2.0 | 921 | $2,500 | $2.71 | 22d | 1 | 1.23mi |
| 13418 Lynne Dr Garden Grove, CA | 2.0 | 1.0 | 744 | $3,195 | $4.29 | 24d | 1 | 1.27mi |
| 4201 W 5th St Santa Ana, CA | 2.0 | 1.0 | 921 | $2,800 | $3.04 | 7d | 1 | 1.27mi |
| 3900 W 5th St Santa Ana, CA | 1.0–2.0 | 1.0–2.0 | 780 | $2,175 | $2.79 | 13d | 1 | 1.29mi |
| 3200 W 5th St Santa Ana, CA | 1.0–2.0 | 1.0–2.0 | 769 | $2,795 | $3.63 | 2d | 9 | 1.33mi |
| 11791 Comstock Rd Garden Grove, CA | 3.0 | 2.0 | 1155 | $3,950 | $3.42 | 19d | 1 | 1.33mi |
| 13061 Lampson Ave Garden Grove, CA | 1.0–2.0 | 1.0–1.5 | 847 | $2,550 | $3.01 | 10d | 2 | 1.34mi |
| 12575 9th St Garden Grove, CA | 2.0 | 2.0 | 925 | $2,802 | $3.03 | 2d | 1 | 1.35mi |
| 12681 Lewis St Garden Grove, CA | 2.0 | 1.0–2.0 | 775 | $2,722 | $3.51 | 1d | 1 | 1.42mi |
| 13388 Taft St #8 Garden Grove, CA | 3.0 | 2.5 | 1239 | $3,200 | $2.58 | 19d | 1 | 1.43mi |
| 13388 Taft St Garden Grove, CA | 3.0 | 2.5 | 1239 | $3,200 | $2.58 | 24d | 1 | 1.43mi |
| 12621 Lewis St Garden Grove, CA | 2.0 | 2.0 | 960 | $2,600 | $2.71 | 7d | 1 | 1.43mi |
| 12291 Hampton Ave Garden Grove, CA | 3.0 | 2.0 | 1146 | $4,950 | $4.32 | 13d | 1 | 1.44mi |
| 3825 W Garden Grove Blvd Orange, CA | 1.0–3.0 | 1.0–2.5 | 1112 | $2,845 | $2.56 | 2d | 3 | 1.47mi |
| 13357 Taft St Unit ADU Garden Grove, CA | 2.0 | 2.0 | 1050 | $3,400 | $3.24 | 43d | 1 | 1.48mi |
| 12162 Jentges Ave Garden Grove, CA | 2.0 | 1.0 | 908 | $2,620 | $2.89 | 12d | 2 | 1.50mi |
Listing history 4 events
-
2026-06-01days on market $239,499 Active 79 DOM
-
2026-05-31days on market $239,499 Active 78 DOM
-
2026-05-06price $239,499 553-char remark
Show marketing remark (553 chars)
Well-kept 3 bedroom, 2 bathroom (PLUS a bonus office) manufactured home in Garden Grove offering a comfortable and functional layout. The home features a bright living area, a practical kitchen, and good natural light throughout. The primary bedroom includes a private bathroom, and the additional bedrooms provide flexible space for family, guests, or a home office. Conveniently located near shopping, restaurants, schools, and major freeways, making everyday living easy and accessible. Great opportunity to own an affordable home in Orange County.
-
2026-03-14$249,500 Active 553-char remark
Show marketing remark (553 chars)
Well-kept 3 bedroom, 2 bathroom (PLUS a bonus office) manufactured home in Garden Grove offering a comfortable and functional layout. The home features a bright living area, a practical kitchen, and good natural light throughout. The primary bedroom includes a private bathroom, and the additional bedrooms provide flexible space for family, guests, or a home office. Conveniently located near shopping, restaurants, schools, and major freeways, making everyday living easy and accessible. Great opportunity to own an affordable home in Orange County.
ⓘ Source: listings_history table (triggers on properties + properties_extension) + one-shot
backfill from property_details.listing_events for pre-trigger history.
Climate risk First Street
- Flood 3/10 Moderate FEMA zone A · 9% chance over 30 yrs
- Wildfire 1/10 Low
- Heat 5/10 Major 7 d/yr ≥89°F today · 23 d/yr by 30 yrs out
- Wind 1/10 Low
- Air quality 6/10 Major 12 unhealthy d/yr today · 13 by 30 yrs out
Nearby sold comps map
Loading sold comps map…
Walkable amenities ~0.75 mi
Loading nearby amenities…
Taxation est. · year 1
- Rental income
- $36,251
- − Mortgage interest
- −$13,416
- − Property taxes
- −$3,592
- − Insurance
- −$2,700
- − Repairs & maintenance
- −$2,900
- − Management
- −$2,900
- − Depreciation
- −$6,967
- Taxable income
- $3,775
- Est. tax owed @ 24.0%
- −$906
- After-tax cash flow
- $6,368/yr
For passive investors: Depreciation is non-cash, so a rental often shows a tax loss while cash-flowing — sheltering income. Rental losses are passive: they offset passive income freely, and up to $25,000/yr can offset ordinary (W-2) income if you actively participate and your MAGI is under $100k (phasing out to $0 by $150k); unused losses carry forward. On sale, claimed depreciation is recaptured at up to 25%, and gains may owe capital-gains tax (a 1031 exchange can defer both). Figures are a year-1 estimate at your 24.0% rate — not tax advice; consult a CPA.
Schools (NCES district)
- District
- Garden Grove Unified
- NCES district ID
- 0614880
- Math proficiency
- 38% ▼ -14.00%
- Reading proficiency
- 65% ▲ 4.00%
- Median HH income
- $60,089
- Composite
- 44.89/100
- National rank
- #2715
- State rank
- #132 of 517 in CA
Livability — Garden Grove
- Score
- 66/100
- State rank
- #343
- US rank
- #11727
Category grades
Schools grade is shown separately in the Schools card above.
Census & demographics
- Census place
- Garden Grove, CA
- County
- Orange County · 3,096,323 people
- City population
- 157,355
- Metro
- Los Angeles-Long Beach-Anaheim, CA
- Population (ZIP)
- 46,414
- Household income
- $81,446
- Rent vs Own
- Severe rent burden
- 1814.0
Population outlook (Orange County) Hauer SSP2
- Today (2025)
- 3,477,456 people
- By 2030
- 3,613,117 · +3.9%
- By 2040
- 3,835,945 · +10.3%
- By 2050
- 3,968,736 · +14.1%
- By 2075
- 4,097,053 · +17.8%
- By 2100
- 3,903,633 · +12.3%
Race, ethnicity, and origin ACS 2023
- Neighborhood character
- Diverse neighborhood (Simpson 0.59)
- Race & ethnicity
- Hispanic / Latino 46% Asian 44% Two or more races 15% White 7% Native American 2%
- Hispanic origin (detail)
- Mexican 42%
- Foreign-born
- 53% · Vietnam, Canada, South Korea
- Languages at home
- 20% English-only · Spanish 39% Vietnamese 36% Korean 1%
Political lean MEDSL · Orange
- 2024 margin
- Toss-up / Even · D 49.7% · R 47.1% · Other 3.2%
- 2008→2024 swing
- +5.2pp toward D · 2008: -2.6pp · 2024: 2.6pp
- All cycles
- 2024: D+2.6 2020: D+9.0 2016: D+7.7 2012: R+8.3 2008: R+2.6
Not yet ingested
- Civics
- —
Market trends
- HPI YoY
- ▼ -826.28%
- Current HPI
- 496.9803
- Rent YoY
- —
- Metro
- Los Angeles-Long Beach-Anaheim, CA
- State GDP YoY
- ▲ 3.21%
- F500 in state
- 116
Industry mix (Fortune 500 HQ in CA)
| Industry | F500 HQs | Revenue |
|---|---|---|
| Technology | 27 | $1,492B |
|
||
| Financial Services | 3 | $174B |
|
||
| Retail | 3 | $44B |
|
||
| Insurance | 3 | $26B |
|
||
| Media / Entertainment | 2 | $115B |
|
||
| Pharmaceuticals / Biotech | 2 | $62B |
|
||
Price history
-4.0% since first listed2 events — show timeline
- 2026-05-06 Price Changed $239,499 CRMLS
- 2026-03-14 Listed $249,500 CRMLS
Property tax history
-4.9%/yrLatest (2025): $102 · +0.5% YoY. Source: county tax records.
Cash-flow waterfall
monthlySold comps — $/sqft
last 12 mo · ≤1 miLoading sold comps…