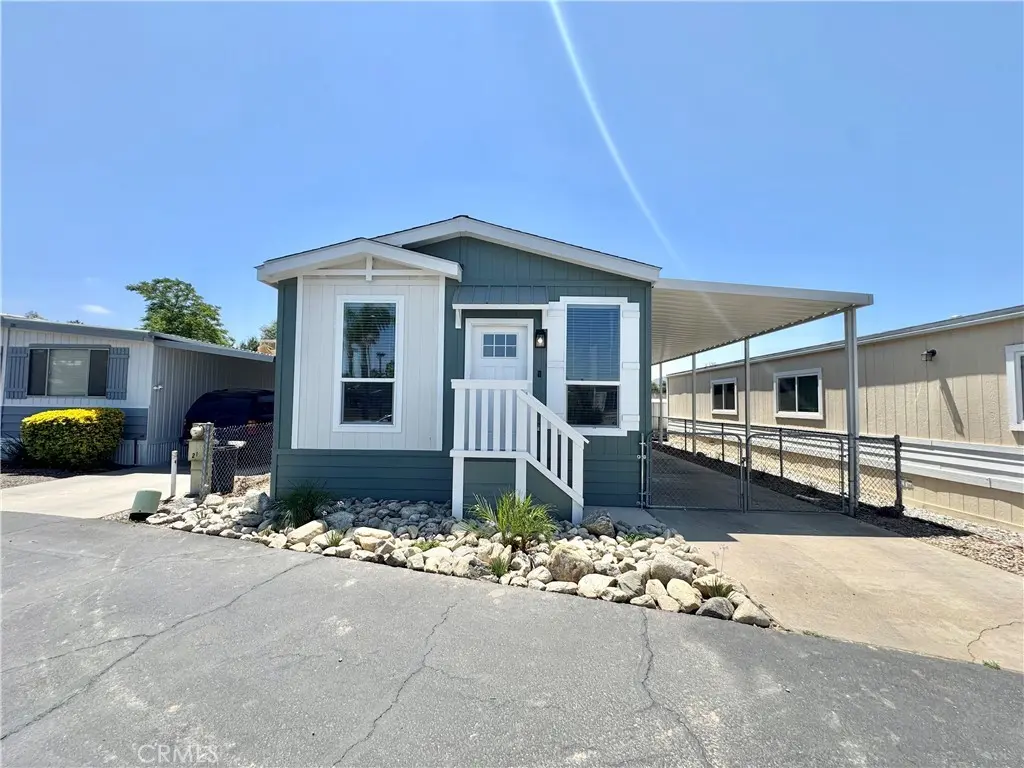
21601 Canyon #21 · Wildomar, CA
Flood risk 6/10 · Moderate
- FEMA flood zone
- X (unshaded)
- Chance of flooding over 30 yrs
- 0.72%
- Est. flood insurance / yr
- $507 – $1,088
Fire risk 8/10 · Major
- Est. fire insurance / yr
- $659 – $1,223
Heat risk 6/10 · Moderate
- Hot days now (above 105°F)
- 6 days/yr
- Hot days in 30 yrs
- 18 days/yr
Wind risk 1/10 · Minimal
- Chance of severe wind over 30 yrs
- —
Air-quality risk 5/10 · Moderate
- Unhealthy air days now
- 7 days/yr
- Unhealthy air days in 30 yrs
- 9 days/yr
Risk factors via First Street. Map © Google.
Why this score? — see what drove the B+ grade
The composite is a weighted blend of 9 inputs, each scored 0–100. Each bar is that input's sub-score; the figure is the points it added to the 100-point composite (weight × sub-score).
- Cash flow +30.0/30.0
- ARV discount +15.0/15.0
- 1% rule +10.0/10.0
- DSCR +10.0/10.0
- Condition / age +4.0/5.0
- Schools +3.7/10.0
- Livability +2.7/5.0
- Rent growth +2.0/5.0
- Appreciation +0.0/10.0
$142,000
🖨 Deal sheet 📄 Offer letter ✓ Due diligence
Listing remarks
Discover comfortable, low-maintenance living in this brand-new 2-bedroom, 2-bath manufactured home located in a welcoming 55+ community. Designed with modern finishes and an open-concept layout, this beautiful home offers a bright and spacious living area, stylish kitchen, and comfortable bedrooms perfect for relaxing or entertaining. Enjoy the convenience of a thoughtfully designed floor plan with plenty of natural light and contemporary touches throughout. Residents of the community enjoy access to fantastic amenities including a clubhouse, recreation room, and sparkling swimming pool — perfect for socializing, staying active, or simply unwinding. Conveniently located near shopping,
Key facts
- Bright living area
- Stylish kitchen
- Natural light
Tags
Property features AI
Finance
- Other: Located in a land-lease park (Canyon Homes)
- Financial info: Monthly land lease of $1,200
- HOA & community: Senior community; Manager approval required
Exterior
- Parking: Located in Canyon Homes park
- Utilities: Public sewer; District/Public water
- Home design: Single-story mobile home; Mobile remains on site; Mobile dimensions approximately 20 ft by 44 ft; Entry at level 1; Suburban neighborhood
- Construction: Year built per builder source
- Exterior features: Community pool; Landscaped lot
Interior
- Bathrooms: 2 full bathrooms
- Interior features: Single-level entry
- Laundry & utility: Laundry inside the unit
Neighborhood map
What this means for you Summary
Snapshot
- This is a 2-bed/2.0-bath manufactured listed at $142k. Condition is rated good.
Deal economics
- At list price, monthly cash flow is $808 ($10k/yr) — positive.
- The deal already cash-flows at list — no discount required.
- Meets the 1% rule at list price ($2k rent vs $142k).
- Recommended offer: $138k (3.0% below list) — sets the bar for market timing.
- Cap rate 13.1% vs local median 3.3% in Wildomar — top-decile yield for the area; either an underpriced asset or a hidden risk that comps aren't pricing in. Stress-test before assuming the spread holds.
Location & tenants
- Location reads 53/100 on livability (#951 in CA) — a working-class tenant base; expect higher turnover. Strengths: crime A+, housing A+, employment B+; Watch: schools D, health & safety D, amenities F.
- Lake Elsinore Unified (suburban): math 34% / reading 49% proficiency, ranked #210 of 517 in CA (top 41%) — families likely to look elsewhere, expect single-tenant / working-renter base with shorter leases.
- Market conditions: Rents soft (-2.1%/yr); 145 active listings in the ZIP; solid renter incomes; 9,195 units permitted in Riverside County in 2024 (1,512 in 5+ unit buildings).
Forward outlook
- Local home prices are declining (-3.0%/yr); year-one equity from $982 of loan paydown is wiped out by about $4k of value loss. Plan a longer hold.
- Riverside County population projected at +22% by 2050 — long-run rental-demand tailwind backs the buy-and-hold thesis.
- At projected returns (-3.0% appreciation + 0.0% rent growth), your $40k cash investment doubles in ~6 years — after that, you're playing with house money.
Negotiation context
- It's been on market 35 days — a 3% lower offer ($138k) is reasonable based on typical stale-listing flexibility.
Risks & watch-outs
- Climate carrying-cost: major flood risk; severe wildfire risk; extreme-heat days projected 6→18/yr by 2055 (HVAC capex compounding) — expect insurance premiums to compound above CPI over the hold.
Questions for the listing agent
- It's been on market 35 days. Have you received any prior offers? Is the seller open to a 3% concession, seller financing, or rate buy-down credit?
- Is there a deadline driving the sale (1031 exchange, divorce, estate, relocation)? That informs how much negotiation room exists.
- Schools are D-rated, which usually means shorter tenancies and higher turnover. Who's the typical renter profile here, and what's been the actual vacancy rate?
- What's the average days-on-market for RENTAL listings here right now (not sales)? A rising rental-DOM trend means longer vacancies and softer asking-rent achievability than the comps imply.
- What's the recent tenant-quality profile in this submarket — average credit score on applications, eviction rate, late-payment / NSF rate, and stable-employment percentage? A property-management company in the area should have these aggregated.
- How much new for-sale + rental construction is in the pipeline within 1–3 miles? Heavy new supply typically softens prices + rents 12–24 months out; constrained supply supports both.
Investment metrics
- 1% rule
- 1.60% ✓
- Cap rate
- 13.12%
- Cash-on-cash
- 24.39%
- DSCR
- 2.09
- GRM
- 5.2
CMA / ARV
- ARV (median comp)
- $215,000
- List price
- $142,000
- Delta
- -33.95%
- Verdict
- UNDERPRICED
- Comps
- 5 within 2.0 mi
Projected returns pro-forma
-3.0% appreciation · 0.0% rent growth · sell at horizon
- IRR
- 14.3%
- Equity multiple
- 1.55×
- Total profit
- $21,860
- Equity at exit
- $21,173
- IRR
- 20.7%
- Equity multiple
- 2.50×
- Total profit
- $59,800
- Equity at exit
- $12,278
Cash invested: $39,760 (down + closing). Projections, not guarantees.
Landlord ↔ Tenant lean methodology
- Overall (STATE)
- 18 Strongly Tenant-Friendly
- State California
- 18 Strongly Tenant-Friendly · D+13
- County
- — inherits STATE
- City
- — inherits STATE
ZIP-level market 92595
- Home prices YoY
- -23.8%
- Rents YoY
- -2.1%
- Active inventory
- 145
- Price-to-rent
- 5.2×
Monthly cashflow live
- Estimated rent
- $2,265 medium interval (Pro) →
- Mortgage (P&I)
- −$745
- Tax est. 1.5%
- −$178 /mo · $2,130/yr
- Insurance
- −$59
- HOA
- −$0
- Vacancy / Maint / Mgmt
- −$476
- Net cashflow
- $808
Break-even live
UW: 25.0% down · 7.5% · 30yr · 1.5% tax · 5.0% vac · 8.0% maint · 8.0% mgmt
Financing live
Cash to close
- Down payment
- $35,500
- Closing costs
- $4,260
- Reserves months
- —
- Total cash needed
- —
Loan-product check · same deal, 3 products live
Conventional
25% down · 7.5% · 30yr
- Down + closing
- —
- Monthly P&I
- —
- Monthly cashflow
- —
- DSCR
- —
- Eligible?
- —
Personal DTI + credit; lowest rate.
DSCR
20% down · 8.5% · 30yr
- Down + closing
- —
- Monthly P&I
- —
- Monthly cashflow
- —
- DSCR
- —
- Eligible?
- —
No personal income docs; deal must DSCR.
Hard money
10% down · 12.0% · 12mo
- Down + closing
- —
- Monthly P&I
- —
- Monthly cashflow
- —
- DSCR
- —
- Eligible?
- —
Short-term bridge; refi at stabilization.
Listing history 15 events
-
2026-06-18days on market $142,000 Active 35 DOM
-
2026-06-17days on market $142,000 Active 34 DOM
-
2026-06-16days on market $142,000 Active 33 DOM
-
2026-06-15days on market $142,000 Active 32 DOM
-
2026-06-13days on market $142,000 Active 30 DOM
-
2026-06-13days on market $142,000 Active 29 DOM
-
2026-06-09pricedays on market $142,000 Active 26 DOM
-
2026-06-08days on market $152,000 Active 25 DOM
-
2026-06-07days on market $152,000 Active 24 DOM
-
2026-06-04days on market $152,000 Active 21 DOM
-
2026-06-03days on market $152,000 Active 20 DOM
-
2026-06-02days on market $152,000 Active 19 DOM
-
2026-06-01days on market $152,000 Active 18 DOM
-
2026-05-31days on market $152,000 Active 17 DOM
-
2026-05-14$152,000 Active 903-char remark
ⓘ Source: listings_history table (triggers on properties + properties_extension) + one-shot
backfill from property_details.listing_events for pre-trigger history.
Climate risk First Street
- Flood 6/10 Major FEMA zone X (unshaded) · 72% chance over 30 yrs
- Wildfire 8/10 Severe
- Heat 6/10 Major 6 d/yr ≥105°F today · 18 d/yr by 30 yrs out
- Wind 1/10 Low
- Air quality 5/10 Major 7 unhealthy d/yr today · 9 by 30 yrs out
Nearby sold comps map
Loading sold comps map…
Walkable amenities ~0.75 mi
Loading nearby amenities…
Taxation est. · year 1
- Rental income
- $27,183
- − Mortgage interest
- −$7,954
- − Property taxes
- −$2,130
- − Insurance
- −$710
- − Repairs & maintenance
- −$2,175
- − Management
- −$2,175
- − Depreciation
- −$4,131
- Taxable income
- $7,908
- Est. tax owed @ 24.0%
- −$1,898
- After-tax cash flow
- $7,800/yr
For passive investors: Depreciation is non-cash, so a rental often shows a tax loss while cash-flowing — sheltering income. Rental losses are passive: they offset passive income freely, and up to $25,000/yr can offset ordinary (W-2) income if you actively participate and your MAGI is under $100k (phasing out to $0 by $150k); unused losses carry forward. On sale, claimed depreciation is recaptured at up to 25%, and gains may owe capital-gains tax (a 1031 exchange can defer both). Figures are a year-1 estimate at your 24.0% rate — not tax advice; consult a CPA.
Condition & rehab AI · 14 photos
This 2-bedroom, 2-bath manufactured home in a 55+ community is in excellent condition with modern finishes and an open-concept layout. It offers a bright and spacious living area, stylish kitchen, and comfortable bedrooms. The home is move-in ready with minimal maintenance required.
Value-add opportunities
- Both Painting exterior siding — Enhances curb appeal and value
- Both Landscaping improvements — Enhances curb appeal and value
- Both Replace carpet with hardwood flooring — Improves aesthetics and value
- Both Install smart home features — Enhances convenience and value
Renovation cost estimate screening
Value-add ROI direction
- Both Painting exterior siding — Enhances curb appeal and value ↑
- Both Landscaping improvements — Enhances curb appeal and value ↑
- Both Replace carpet with hardwood flooring — Improves aesthetics and value ↑
- Both Install smart home features — Enhances convenience and value ↑
ⓘ Cost ranges are severity-bucket heuristics (US national rule-of-thumb). Get contractor quotes + a written scope before underwriting a rehab budget.
Schools (NCES district)
- District
- Lake Elsinore Unified
- NCES district ID
- 0600027
- Math proficiency
- 34% ▲ 5.00%
- Reading proficiency
- 49% ▲ 8.00%
- Median HH income
- $63,829
- Composite
- 37.01/100
- National rank
- #4518
- State rank
- #210 of 517 in CA
Livability — Wildomar
- Score
- 53/100
- State rank
- #951
- US rank
- #24427
Category grades
Schools grade is shown separately in the Schools card above.
Census & demographics
- Census place
- Wildomar, CA
- County
- Riverside County · 2,287,001 people
- City population
- 34,438
- Metro
- Riverside-San Bernardino-Ontario, CA
- Population (ZIP)
- 34,438
- Household income
- $106,047
- Rent vs Own
- Severe rent burden
- 429.0
Population outlook (Riverside County) Hauer SSP2
- Today (2025)
- 2,664,475 people
- By 2030
- 2,802,692 · +5.2%
- By 2040
- 3,050,904 · +14.5%
- By 2050
- 3,256,783 · +22.2%
- By 2075
- 3,655,058 · +37.2%
- By 2100
- 3,766,594 · +41.4%
Race, ethnicity, and origin ACS 2023
- Neighborhood character
- Diverse neighborhood (Simpson 0.66)
- Race & ethnicity
- White 42% Hispanic / Latino 41% Two or more races 18% Asian 5% Black 3%
- Hispanic origin (detail)
- Mexican 33%
- Common ancestry
- Slovak 2% Lithuanian 1% Romanian 1%
- Foreign-born
- 17% · Canada, Vietnam, China
- Languages at home
- 69% English-only · Spanish 25% Tagalog/Filipino 1% Vietnamese 1%
Political lean MEDSL · Riverside
- 2024 margin
- Toss-up / Even · D 48.0% · R 49.3% · Other 2.6%
- 2008→2024 swing
- -3.6pp toward R · 2008: 2.3pp · 2024: -1.3pp
- All cycles
- 2024: R+1.3 2020: D+8.0 2016: D+4.3 2012: R+0.4 2008: D+2.3
Not yet ingested
- Civics
- —
Market trends
- HPI YoY
- ▼ -110.47%
- Current HPI
- 354.397
- Rent YoY
- ▼ -2.12%
- Metro
- Riverside-San Bernardino-Ontario, CA
- State GDP YoY
- ▲ 3.21%
- F500 in state
- 116
Industry mix (Fortune 500 HQ in CA)
| Industry | F500 HQs | Revenue |
|---|---|---|
| Technology | 27 | $1,492B |
|
||
| Financial Services | 3 | $174B |
|
||
| Retail | 3 | $44B |
|
||
| Insurance | 3 | $26B |
|
||
| Media / Entertainment | 2 | $115B |
|
||
| Pharmaceuticals / Biotech | 2 | $62B |
|
||
Price history
-6.6% since first listed2 events — show timeline
- 2026-06-08 Price Changed $142,000 CRMLS
- 2026-05-14 Listed $152,000 CRMLS
Cash-flow waterfall
monthlySold comps — $/sqft
last 12 mo · ≤1 miLoading sold comps…