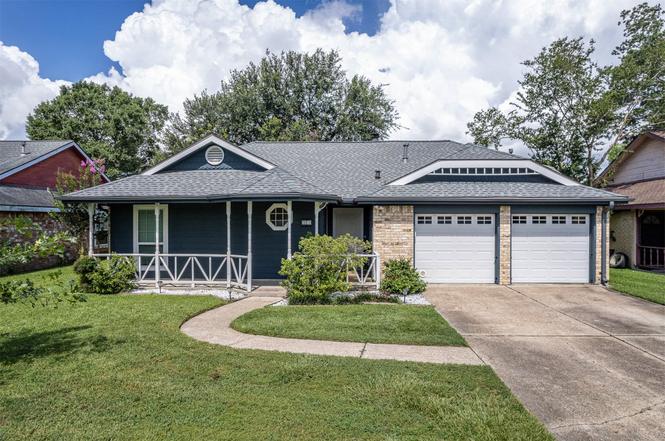
307 Enfield Dr · Highlands, TX
Flood risk 1/10 · Minimal
- FEMA flood zone
- X (unshaded)
- Chance of flooding over 30 yrs
- 0.0%
- Est. flood insurance / yr
- $507 – $1,088
Fire risk 3/10 · Minor
- Est. fire insurance / yr
- $1,222 – $2,270
Heat risk 9/10 · Severe
- Hot days now (above 109°F)
- 7 days/yr
- Hot days in 30 yrs
- 24 days/yr
Wind risk 9/10 · Severe
- Chance of severe wind over 30 yrs
- 99.0%
Air-quality risk 2/10 · Minimal
- Unhealthy air days now
- 2 days/yr
- Unhealthy air days in 30 yrs
- 2 days/yr
Risk factors via First Street. Map © Google.
Why this score? — see what drove the C- grade
The composite is a weighted blend of 9 inputs, each scored 0–100. Each bar is that input's sub-score; the figure is the points it added to the 100-point composite (weight × sub-score).
- Cash flow +22.6/30.0
- DSCR +7.3/10.0
- 1% rule +6.8/10.0
- ARV discount +5.4/15.0
- Schools +3.2/10.0
- Livability +3.2/5.0
- Rent growth +2.5/5.0
- Condition / age +2.5/5.0
- Appreciation +0.0/10.0
$220,000
🖨 Deal sheet 📄 Offer letter ✓ Due diligence
Listing remarks MLS
Well maintained and loved 3/2/2 in Highlands Woods. This home has been upgraded with lighting, back yard upgrades, featuring faux-wood plantation blinds, new flooring, granite, master bath remodeled. Gorgeous fireplace and built in shelving. Breakfast bar opens the kitchen to the family room. You dont want to miss this one1
Key facts
- Covered front porch
- Plantation shutters
- Covered patio
Tags
Property features AI
Finance
- Other: Living area approximately 1,421; Lot about 0.158 acres (6,900 sq ft)
- HOA & community: Member of Highlands Woods 2 HOA with an annual fee of $375
Exterior
- Parking: Attached 2-car garage
- Utilities: Public water; Public sewer
- Home design: Residential property; Single-story entry (all living area on first floor); Full ownership
- Construction: Built in 1982; Composition roof; Slab foundation; Construction materials: Unknown
- Exterior features: Subdivision lot
Interior
- Bedrooms: Three bedrooms on the first floor
- Bathrooms: Two full bathrooms
- Heating & cooling: Central gas heating; Central electric air conditioning
- Interior features: One fireplace
Neighborhood map
What this means for you Summary
Snapshot
- This is a 3-bed/2.0-bath single-family listed at $220k.
Deal economics
- At list price, monthly cash flow is $375 ($5k/yr) — positive.
- The deal already cash-flows at list — no discount required.
- Meets the 1% rule at list price ($3k rent vs $220k).
- Cap rate 8.3% vs local median 5.2% in Highlands — top-decile yield for the area; either an underpriced asset or a hidden risk that comps aren't pricing in. Stress-test before assuming the spread holds.
Location & tenants
- Location reads 64/100 on livability (#738 in TX) — a middle-class / working-renter tenant base. Strengths: cost of living A+, housing A+; Watch: crime C-, employment D+, amenities F.
- Goose Creek CISD (urban): math 37% / reading 36% proficiency, ranked #473 of 826 in TX (top 57%) — families likely to look elsewhere, expect single-tenant / working-renter base with shorter leases; 61% free/reduced lunch — lower-income household profile, screen leases tightly.
- Zoned schools: Highlands El (math 33% / reading 33%, grade F, #2,208 of 4,322 statewide, top 52%, 739 students, 83% FRL); Highlands J H (math 46% / reading 37%, grade F, #595 of 1,662 statewide, top 37%, 994 students, 82% FRL); Goose Creek Memorial (math 28% / reading 45%, grade F, #924 of 1,632 statewide, top 57%, 2,223 students, 70% FRL) — zoned schools average 78% FRL vs 61% district-wide (17 pts higher); higher-poverty schools than district average — tighter screening recommended.
- Market conditions: 74 active listings in the ZIP; 1 comparable units currently listed for rent nearby; 29,883 units permitted in Harris County in 2024 (8,621 in 5+ unit buildings).
Forward outlook
- Local home prices are declining (-3.0%/yr); year-one equity from $2k of loan paydown is wiped out by about $7k of value loss. Plan a longer hold.
- Harris County population projected at +47% by 2050 — long-run rental-demand tailwind backs the buy-and-hold thesis.
Negotiation context
- Only 4 days on market — expect competitive offers; lowballing is unlikely to land.
- 2 sale attempts since 5y ago with the ask held roughly flat each time — persistent listings suggest the price (not the market) is what's stuck; bring a comps-based counter.
Risks & watch-outs
- Climate carrying-cost: severe wind risk, 99% chance of damaging wind over 30y; extreme-heat days projected 7→24/yr by 2055 (HVAC capex compounding) — expect insurance premiums to compound above CPI over the hold.
Questions for the listing agent
- What does the HOA fee cover, when was the last increase, and are there any pending special assessments or reserve-fund shortfalls?
- Is there a deadline driving the sale (1031 exchange, divorce, estate, relocation)? That informs how much negotiation room exists.
- Schools are D-rated, which usually means shorter tenancies and higher turnover. Who's the typical renter profile here, and what's been the actual vacancy rate?
- What's the average days-on-market for RENTAL listings here right now (not sales)? A rising rental-DOM trend means longer vacancies and softer asking-rent achievability than the comps imply.
- What's the recent tenant-quality profile in this submarket — average credit score on applications, eviction rate, late-payment / NSF rate, and stable-employment percentage? A property-management company in the area should have these aggregated.
- How much new for-sale + rental construction is in the pipeline within 1–3 miles? Heavy new supply typically softens prices + rents 12–24 months out; constrained supply supports both.
Investment metrics
- 1% rule
- 1.18% ✓
- Cap rate
- 8.34%
- Cash-on-cash
- 7.31%
- DSCR
- 1.33
- GRM
- 7.1
CMA / ARV
- ARV (on-the-fly)
- $210,308
- Comps found
- 12
Show comp detail 12 sales within ~0.75 mi
| Address | Dist | Beds/Ba | Sqft | Sold | Price | $/sf | Match |
|---|---|---|---|---|---|---|---|
| 311 Brompton Ct | 0.06mi | 3/2.0 | 1,421 (0%) | 12mo | $205,000 | $144 | 87 |
| 327 Brompton Ct | 0.08mi | 3/2.0 | 1,494 (+5%) | 4mo | $180,000 | $120 | 85 |
| 314 Enfield Dr | 0.04mi | 3/2.0 | 1,421 (0%) | 18mo | $211,000 | $148 | 83 |
| 331 Enfield Dr | 0.07mi | 3/2.0 | 1,494 (+5%) | 9mo | $210,000 | $141 | 81 |
| 327 Enfield Dr | 0.06mi | 3/2.0 | 1,569 (+10%) | 6mo | $205,000 | $131 | 75 |
| 414 Enfield Dr | 0.13mi | 3/3.0 | 1,494 (+5%) | 11mo | $240,000 | $161 | 73 |
| 1007 San Jacinto St | 0.34mi | 3/2.0 | 1,320 (-7%) | 2mo | $195,000 | $148 | 71 |
| 115 N 12th St | 0.37mi | 3/2.0 | 1,384 (-3%) | 10mo | $215,000 | $155 | 70 |
| 309 W Wallisville Rd | 0.39mi | 3/2.0 | 1,456 (+2%) | 14mo | $189,900 | $130 | 66 |
| 306 Hackberry Dr | 0.17mi | 3/2.0 | 1,564 (+10%) | 14mo | $249,900 | $160 | 64 |
| 510 Evergreen Dr | 0.24mi | 3/2.0 | 1,566 (+10%) | 21mo | $224,000 | $143 | 54 |
| 402 E Oak St | 0.71mi | 3/2.0 | 1,590 (+12%) | 17mo | $235,000 | $148 | 33 |
Match score weights: distance 35% · size 25% · config 20% · recency 20%. Top-matched comps best support the ARV.
Projected returns pro-forma
-3.0% appreciation · 3.0% rent growth · sell at horizon
- IRR
- -5.1%
- Equity multiple
- 0.81×
- Total profit
- $-11,608
- Equity at exit
- $32,803
- IRR
- 4.7%
- Equity multiple
- 1.34×
- Total profit
- $21,228
- Equity at exit
- $19,022
Cash invested: $61,600 (down + closing). Projections, not guarantees.
Landlord ↔ Tenant lean methodology
- Overall (STATE)
- 87 Strongly Landlord-Friendly
- State Texas
- 87 Strongly Landlord-Friendly · R+5
- County
- — inherits STATE
- City
- — inherits STATE
ZIP-level market 77562
- Home prices YoY
- -24.9%
- Active inventory
- 74
- Price-to-rent
- 7.1×
Monthly cashflow live
- Estimated rent
- $2,600 medium interval (Pro) →
- Mortgage (P&I)
- −$1,154
- Tax from tax record
- −$402 /mo · $4,828/yr
- Insurance
- −$92
- HOA
- −$31
- Vacancy / Maint / Mgmt
- −$546
- Net cashflow
- $375
Break-even live
UW: 25.0% down · 7.5% · 30yr · 1.5% tax · 5.0% vac · 8.0% maint · 8.0% mgmt
Financing live
Cash to close
- Down payment
- $55,000
- Closing costs
- $6,600
- Reserves months
- —
- Total cash needed
- —
Loan-product check · same deal, 3 products live
Conventional
25% down · 7.5% · 30yr
- Down + closing
- —
- Monthly P&I
- —
- Monthly cashflow
- —
- DSCR
- —
- Eligible?
- —
Personal DTI + credit; lowest rate.
DSCR
20% down · 8.5% · 30yr
- Down + closing
- —
- Monthly P&I
- —
- Monthly cashflow
- —
- DSCR
- —
- Eligible?
- —
No personal income docs; deal must DSCR.
Hard money
10% down · 12.0% · 12mo
- Down + closing
- —
- Monthly P&I
- —
- Monthly cashflow
- —
- DSCR
- —
- Eligible?
- —
Short-term bridge; refi at stabilization.
Rent comps 1 comps
| Address | Beds | Baths | Sqft | Rent | $/sqft | DOM | Units | Dist |
|---|---|---|---|---|---|---|---|---|
| 305 Riverside St Highlands, TX | 3.0 | 2.0 | 1404 | $2,600 | $1.85 | 2d | 1 | 0.92mi |
HOA detail
- Monthly dues
- $31 · $372/yr
Listing history 5 events
-
2026-06-18days on market $220,000 Active 4 DOM
-
2026-06-17days on market $220,000 Active 3 DOM
-
2026-06-16days on market $220,000 Active 2 DOM
-
2026-06-15remarks 699-char remark
-
2026-06-15$220,000 Active 1 DOM
ⓘ Source: listings_history table (triggers on properties + properties_extension) + one-shot
backfill from property_details.listing_events for pre-trigger history.
Tax reassessment forecast TX · Resets to sale price
- Current annual tax
- $4,828 · $402/mo
- Projected year-2 tax
- $4,828 · $402/mo
- Expected delta
- $0/yr ($0/mo · 0.0%)
ⓘ Screening estimate from a state-policy table — verify with the county assessor before closing.
Climate risk First Street
- Flood 1/10 Low FEMA zone X (unshaded) · 0% chance over 30 yrs
- Wildfire 3/10 Moderate
- Heat 9/10 Extreme 7 d/yr ≥109°F today · 24 d/yr by 30 yrs out
- Wind 9/10 Extreme 99% chance of damaging wind over 30 yrs
- Air quality 2/10 Low 2 unhealthy d/yr today · 2 by 30 yrs out
Nearby sold comps map
Loading sold comps map…
Walkable amenities ~0.75 mi
Loading nearby amenities…
Taxation est. · year 1
- Rental income
- $31,200
- − Mortgage interest
- −$12,323
- − Property taxes
- −$4,828
- − Insurance
- −$1,100
- − Repairs & maintenance
- −$2,496
- − Management
- −$2,496
- − HOA
- −$372
- − Depreciation
- −$6,400
- Taxable income
- $1,185
- Est. tax owed @ 24.0%
- −$284
- After-tax cash flow
- $4,220/yr
For passive investors: Depreciation is non-cash, so a rental often shows a tax loss while cash-flowing — sheltering income. Rental losses are passive: they offset passive income freely, and up to $25,000/yr can offset ordinary (W-2) income if you actively participate and your MAGI is under $100k (phasing out to $0 by $150k); unused losses carry forward. On sale, claimed depreciation is recaptured at up to 25%, and gains may owe capital-gains tax (a 1031 exchange can defer both). Figures are a year-1 estimate at your 24.0% rate — not tax advice; consult a CPA.
Schools (NCES district)
- District
- Goose Creek CISD
- NCES district ID
- 4821150
- Math proficiency
- 37% ▼ -11.00%
- Reading proficiency
- 36% ▼ -4.00%
- Median HH income
- $52,468
- Composite
- 31.84/100
- National rank
- #5877
- State rank
- #473 of 826 in TX
Livability — Highlands
- Score
- 64/100
- State rank
- #738
- US rank
- #13697
Category grades
Schools grade is shown separately in the Schools card above.
Census & demographics
- Census place
- Highlands, TX
- City population
- 9,805
- Population (ZIP)
- 9,805
Population outlook (Harris County) Hauer SSP2
- Today (2025)
- 5,571,493 people
- By 2030
- 6,089,821 · +9.3%
- By 2040
- 7,142,806 · +28.2%
- By 2050
- 8,185,864 · +46.9%
- By 2075
- 10,574,329 · +89.8%
- By 2100
- 12,109,958 · +117.4%
Race, ethnicity, and origin ACS 2023
- Neighborhood character
- Diverse neighborhood (Simpson 0.62)
- Race & ethnicity
- White 48% Hispanic / Latino 38% Two or more races 19% Black 7% Native American 2%
- Hispanic origin (detail)
- Mexican 30%
- Common ancestry
- Lithuanian 2% Italian 1% Iranian 1%
- Foreign-born
- 15% · Canada, Jamaica
- Languages at home
- 69% English-only · Spanish 29% German/W. Germanic 1%
Political lean MEDSL · Harris
- 2024 margin
- Lean D (+5.5) · D 52.0% · R 46.4% · Other 1.6%
- 2008→2024 swing
- +3.9pp toward D · 2008: 1.6pp · 2024: 5.5pp
- All cycles
- 2024: D+5.5 2020: D+13.3 2016: D+12.4 2012: D+0.1 2008: D+1.6
Not yet ingested
- Civics
- —
Market trends
- HPI YoY
- ▼ -100.57%
- Current HPI
- 303.5126
- Rent YoY
- —
- Metro
- —
- State GDP YoY
- ▲ 3.95%
- F500 in state
- 110
Industry mix (Fortune 500 HQ in TX)
| Industry | F500 HQs | Revenue |
|---|---|---|
| Energy | 16 | $1,198B |
|
||
| Technology | 5 | $198B |
|
||
| Engineering / Construction | 4 | $72B |
|
||
| Energy Services | 3 | $60B |
|
||
| Utilities | 3 | $41B |
|
||
| Healthcare | 2 | $330B |
|
||
Price history
+18.9% since first listed7 events — show timeline
- 2026-06-14 Listed $220,000 HARMLS
- 2021-09-03 Sold (Public Records) — Public Records
- 2021-08-31 Sold (MLS) — HARMLS
- 2021-08-14 Pending — HARMLS
- 2021-08-08 Pending — HARMLS
- 2021-08-05 Listed $185,000 HARMLS
- 1988-04-14 Sold (Public Records) — Public Records
Property tax history
+4.0%/yrLatest (2025): $4,828 · +11.6% YoY. Source: county tax records.
Cash-flow waterfall
monthlySold comps — $/sqft
last 12 mo · ≤1 miLoading sold comps…