300 Falmouth Rd Apt 21E · Mashpee Neck, MA
Flood risk No data
- FEMA flood zone
- —
- Chance of flooding over 30 yrs
- —
- Est. flood insurance / yr
- —
Fire risk No data
- Est. fire insurance / yr
- —
Heat risk No data
- Hot days now (above threshold)
- —
- Hot days in 30 yrs
- —
Wind risk No data
- Chance of severe wind over 30 yrs
- —
Air-quality risk No data
- Unhealthy air days now
- —
- Unhealthy air days in 30 yrs
- —
Risk factors via First Street. Map © Google.
Why this score? — see what drove the D+ grade
The composite is a weighted blend of 9 inputs, each scored 0–100. Each bar is that input's sub-score; the figure is the points it added to the 100-point composite (weight × sub-score).
- Cash flow +18.4/30.0
- ARV discount +7.5/15.0
- DSCR +5.8/10.0
- 1% rule +5.5/10.0
- Schools +3.8/10.0
- Livability +3.2/5.0
- Rent growth +2.5/5.0
- Condition / age +2.5/5.0
- Appreciation +0.0/10.0
$380,000
🖨 Deal sheet 📄 Offer letter ✓ Due diligence
Listing remarks
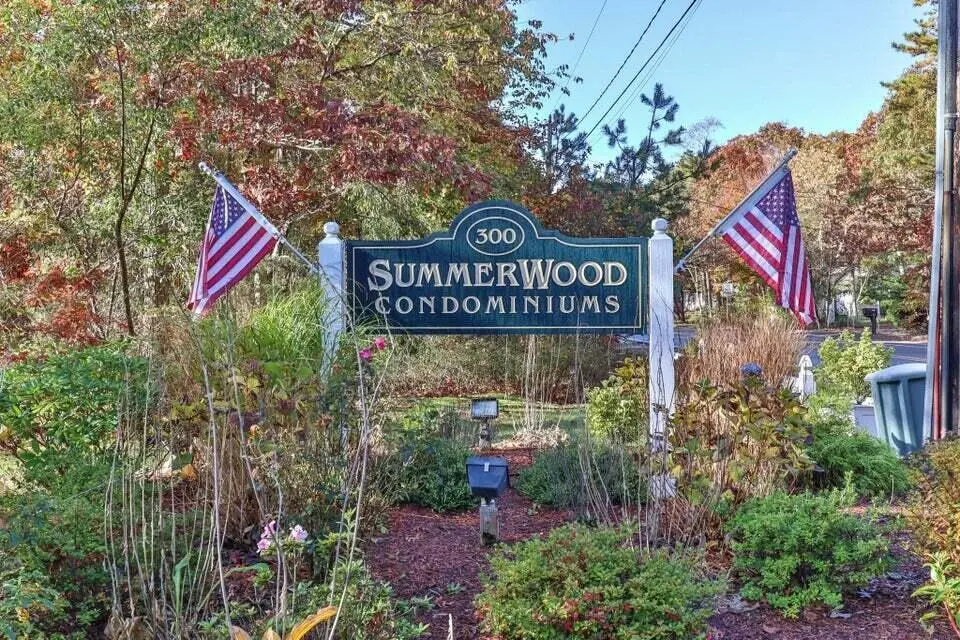
Refreshing Spring in Your New HomeDiscover comfort and convenience in this charming townhouse-style condominium nestled within the serene Summerwood Condominium Complex. Key Features:Spacious Living: Enjoy two floors of living space. Modern Interior: Creating a bright and airy atmosphere. Functional Layout: The first floor boasts an eat-in kitchen with patio access, a spacious living room, hardwood floors, and a convenient full bath. The second floor features a large primary bedroom with oversized closet space and a second bedroom with ample storage. Versatile Basement: provides additional storage and the potential for a finished den or office space. Outdoor Oasis: Relax on the private pat
Key facts
- $500 HOA
- Parking
- Community pool
Neighborhood map
What this means for you Summary
Snapshot
- This is a 2-bed/2.0-bath condo listed at $380k.
Deal economics
- At list price, monthly cash flow is $357 ($4k/yr) — positive.
- The deal already cash-flows at list — no discount required.
- Meets the 1% rule at list price ($4k rent vs $380k).
Location & tenants
- Location reads 65/100 on livability (#180 in MA) — a middle-class / working-renter tenant base. Strengths: crime A+, employment A+, housing A+; Watch: amenities F, commute F, cost of living F.
- Mashpee (suburban): math 34% / reading 51% proficiency, ranked #183 of 302 in MA (top 61%) — families likely to look elsewhere, expect single-tenant / working-renter base with shorter leases.
- Market conditions: 144 active listings in the ZIP; 1 comparable units currently listed for rent nearby; 657 units permitted in Barnstable County in 2024 (178 in 5+ unit buildings).
Forward outlook
- Local home prices are declining (-3.0%/yr); year-one equity from $3k of loan paydown is wiped out by about $11k of value loss. Plan a longer hold.
- Barnstable County population projected at -20% by 2050 — secular population decline; favor cash flow + early exit over multi-decade hold.
Negotiation context
- Only 0 days on market — expect competitive offers; lowballing is unlikely to land.
- 8 sale attempts since 23y ago with the ask held roughly flat each time — persistent listings suggest the price (not the market) is what's stuck; bring a comps-based counter.
Questions for the listing agent
- What does the HOA fee cover, when was the last increase, and are there any pending special assessments or reserve-fund shortfalls?
- Any open or pending special assessments — roof, HVAC, plumbing, elevator, façade? What's the per-unit balance and payoff schedule, and is the seller paying it off at close or rolling it to the buyer?
- Is there a deadline driving the sale (1031 exchange, divorce, estate, relocation)? That informs how much negotiation room exists.
- The area grade is low — what's the realistic commute time and amenity access for the typical tenant pool here? Any planned neighborhood developments (good or bad) we should know about?
- What's the average days-on-market for RENTAL listings here right now (not sales)? A rising rental-DOM trend means longer vacancies and softer asking-rent achievability than the comps imply.
- What's the recent tenant-quality profile in this submarket — average credit score on applications, eviction rate, late-payment / NSF rate, and stable-employment percentage? A property-management company in the area should have these aggregated.
- How much new apartment / multifamily construction is in the pipeline within 1–3 miles? Heavy new supply (>2% of stock underway) typically softens rents 12–24 months out; light construction supports rent growth.
Investment metrics
- 1% rule
- 1.05% ✓
- Cap rate
- 7.42%
- Cash-on-cash
- 4.02%
- DSCR
- 1.18
- GRM
- 7.9
CMA / ARV
No comps found within radius.
Projected returns pro-forma
-3.0% appreciation · 3.0% rent growth · sell at horizon
- IRR
- -10.0%
- Equity multiple
- 0.64×
- Total profit
- $-38,686
- Equity at exit
- $56,659
- IRR
- -0.5%
- Equity multiple
- 0.96×
- Total profit
- $-3,743
- Equity at exit
- $32,855
Cash invested: $106,400 (down + closing). Projections, not guarantees.
Landlord ↔ Tenant lean methodology
- Overall (STATE)
- 20 Strongly Tenant-Friendly
- State Massachusetts
- 20 Strongly Tenant-Friendly · D+15
- County
- — inherits STATE
- City
- — inherits STATE
ZIP-level market 02649
- Home prices YoY
- -32.6%
- Active inventory
- 144
- Price-to-rent
- 7.9×
Monthly cashflow live
- Estimated rent
- $4,000 medium interval (Pro) →
- Mortgage (P&I)
- −$1,993
- Tax from tax record
- −$152 /mo · $1,826/yr
- Insurance
- −$158
- HOA
- −$500
- Vacancy / Maint / Mgmt
- −$840
- Net cashflow
- $357
Break-even live
UW: 25.0% down · 7.5% · 30yr · 1.5% tax · 5.0% vac · 8.0% maint · 8.0% mgmt
Financing live
Cash to close
- Down payment
- $95,000
- Closing costs
- $11,400
- Reserves months
- —
- Total cash needed
- —
Loan-product check · same deal, 3 products live
Conventional
25% down · 7.5% · 30yr
- Down + closing
- —
- Monthly P&I
- —
- Monthly cashflow
- —
- DSCR
- —
- Eligible?
- —
Personal DTI + credit; lowest rate.
DSCR
20% down · 8.5% · 30yr
- Down + closing
- —
- Monthly P&I
- —
- Monthly cashflow
- —
- DSCR
- —
- Eligible?
- —
No personal income docs; deal must DSCR.
Hard money
10% down · 12.0% · 12mo
- Down + closing
- —
- Monthly P&I
- —
- Monthly cashflow
- —
- DSCR
- —
- Eligible?
- —
Short-term bridge; refi at stabilization.
Rent comps 1 comps
| Address | Beds | Baths | Sqft | Rent | $/sqft | DOM | Units | Dist |
|---|---|---|---|---|---|---|---|---|
| 87 Park Place Way Mashpee, MA | 3.0 | 2.0 | 1056 | $4,000 | $3.79 | 43d | 1 | 1.21mi |
HOA detail condo
- Monthly dues
- $500 · $6,000/yr
- Assessments
- None detected in remarks — confirm with the listing agent.
Listing history 25 events
-
2026-04-06historical
-
2026-04-06$380,000
-
2026-03-16status Pending/Continue to Show
-
2026-03-16historical
-
2025-12-05price $390,000
-
2025-12-04$375,000 Active
-
2025-10-31historical
-
2025-01-30price $415,000
-
2024-11-08price $395,000
-
2024-11-08price $1,400,000
-
2024-11-01$395,000 Active
-
2022-05-13status Under Agreement
-
2022-05-13soldstatus $334,300 Sold
-
2022-05-13soldstatus $334,300 Closed
-
2022-05-13soldstatus $334,300
-
2022-04-29status Pending
-
2022-04-15$349,200 New
-
2022-04-15$349,200 Active
-
2019-12-04historical
-
2019-09-04historical
-
2014-08-01$109,000
-
2006-03-01soldstatus $227,000
-
2006-03-01soldstatus $227,000
-
2005-09-06$229,000
-
2003-03-19$175,000
ⓘ Source: listings_history table (triggers on properties + properties_extension) + one-shot
backfill from property_details.listing_events for pre-trigger history.
Tax reassessment forecast MA · Partial reset (capped growth)
- Current annual tax
- $1,826 · $152/mo
- Projected year-2 tax
- $3,250 · $271/mo
- Expected delta
- +$1,424/yr (+$119/mo · 78.0%)
ⓘ Screening estimate from a state-policy table — verify with the county assessor before closing.
Nearby sold comps map
Loading sold comps map…
Walkable amenities ~0.75 mi
Loading nearby amenities…
Taxation est. · year 1
- Rental income
- $48,000
- − Mortgage interest
- −$21,286
- − Property taxes
- −$1,826
- − Insurance
- −$1,900
- − Repairs & maintenance
- −$3,840
- − Management
- −$3,840
- − HOA
- −$6,000
- − Depreciation
- −$11,055
- Taxable loss
- −$1,746
- Est. tax savings @ 24.0%
- +$419
- After-tax cash flow
- $4,700/yr
For passive investors: Depreciation is non-cash, so a rental often shows a tax loss while cash-flowing — sheltering income. Rental losses are passive: they offset passive income freely, and up to $25,000/yr can offset ordinary (W-2) income if you actively participate and your MAGI is under $100k (phasing out to $0 by $150k); unused losses carry forward. On sale, claimed depreciation is recaptured at up to 25%, and gains may owe capital-gains tax (a 1031 exchange can defer both). Figures are a year-1 estimate at your 24.0% rate — not tax advice; consult a CPA.
Schools (NCES district)
- District
- Mashpee
- NCES district ID
- 2507440
- Math proficiency
- 34% ▼ -16.00%
- Reading proficiency
- 51% ▼ -2.00%
- Median HH income
- $65,376
- Composite
- 37.97/100
- National rank
- #4299
- State rank
- #183 of 302 in MA
Livability — Mashpee Neck
- Score
- 65/100
- State rank
- #180
- US rank
- #12489
Category grades
Schools grade is shown separately in the Schools card above.
Census & demographics
- Population (ZIP)
- 15,234
Population outlook (Barnstable County) Hauer SSP2
- Today (2025)
- 208,497 people
- By 2030
- 202,530 · -2.9%
- By 2040
- 184,936 · -11.3%
- By 2050
- 167,489 · -19.7%
- By 2075
- 144,938 · -30.5%
- By 2100
- 117,312 · -43.7%
Race, ethnicity, and origin ACS 2023
- Neighborhood character
- Predominantly White (88%)
- Race & ethnicity
- White 88% Two or more races 5% Black 2% Hispanic / Latino 2% Native American 2%
- Common ancestry
- Lithuanian 5% Russian 5% Romanian 4%
- Foreign-born
- 5% · Canada
- Languages at home
- 95% English-only · Spanish 2% Other Indo-European 1% Russian/Polish/Slavic 1%
Political lean MEDSL · Barnstable
- 2024 margin
- Strong D (+20.8) · D 59.6% · R 38.9% · Other 1.5%
- 2008→2024 swing
- +6.7pp toward D · 2008: 14.0pp · 2024: 20.8pp
- All cycles
- 2024: D+20.8 2020: D+24.4 2016: D+13.4 2012: D+7.6 2008: D+14.0
Not yet ingested
- Civics
- —
Market trends
- HPI YoY
- ▼ -159.04%
- Current HPI
- 328.8662
- Rent YoY
- —
- Metro
- —
- State GDP YoY
- ▲ 2.28%
- F500 in state
- 38
Industry mix (Fortune 500 HQ in MA)
| Industry | F500 HQs | Revenue |
|---|---|---|
| Technology | 3 | $17B |
|
||
| Insurance | 2 | $84B |
|
||
| Retail | 2 | $76B |
|
||
| Life Sciences | 1 | $43B |
|
||
| Energy Technology | 1 | $31B |
|
||
| Aerospace / Defense | 1 | $18B |
|
||
Price history
+117.1% since first listed25 events — show timeline
- 2026-04-06 Listing Removed — CCIMLS
- 2026-04-06 Listed $380,000 CCIMLS
- 2026-03-16 Pending — CCIMLS
- 2026-03-16 Listing Removed — CCIMLS
- 2025-12-05 Price Changed $390,000 CCIMLS
- 2025-12-04 Listed $375,000 CCIMLS
- 2025-10-31 Listing Removed — CCIMLS
- 2025-01-30 Price Changed $415,000 CCIMLS
- 2024-11-08 Price Changed $395,000 CCIMLS
- 2024-11-08 Price Changed $1,400,000 CCIMLS
- 2024-11-01 Listed $395,000 CCIMLS
- 2022-05-13 Pending — MLS PIN
- 2022-05-13 Sold (Public Records) $334,300 Public Records
- 2022-05-13 Sold (MLS) $334,300 CCIMLS
- 2022-05-13 Sold (MLS) $334,300 MLS PIN
- 2022-04-29 Pending — CCIMLS
- 2022-04-15 Listed $349,200 CCIMLS
- 2022-04-15 Listed $349,200 MLS PIN
- 2019-12-04 Listing Removed — CCIMLS
- 2019-09-04 Listing Removed — CCIMLS
- 2014-08-01 Listed $109,000 CCIMLS
- 2006-03-01 Sold (Public Records) $227,000 Public Records
- 2006-03-01 Sold (MLS) $227,000 CCIMLS
- 2005-09-06 Listed $229,000 CCIMLS
- 2003-03-19 Listed $175,000 CCIMLS
Property tax history
+7.3%/yrLatest (2023): $1,826 · +11.1% YoY. Source: county tax records.
Cash-flow waterfall
monthlySold comps — $/sqft
last 12 mo · ≤1 miLoading sold comps…