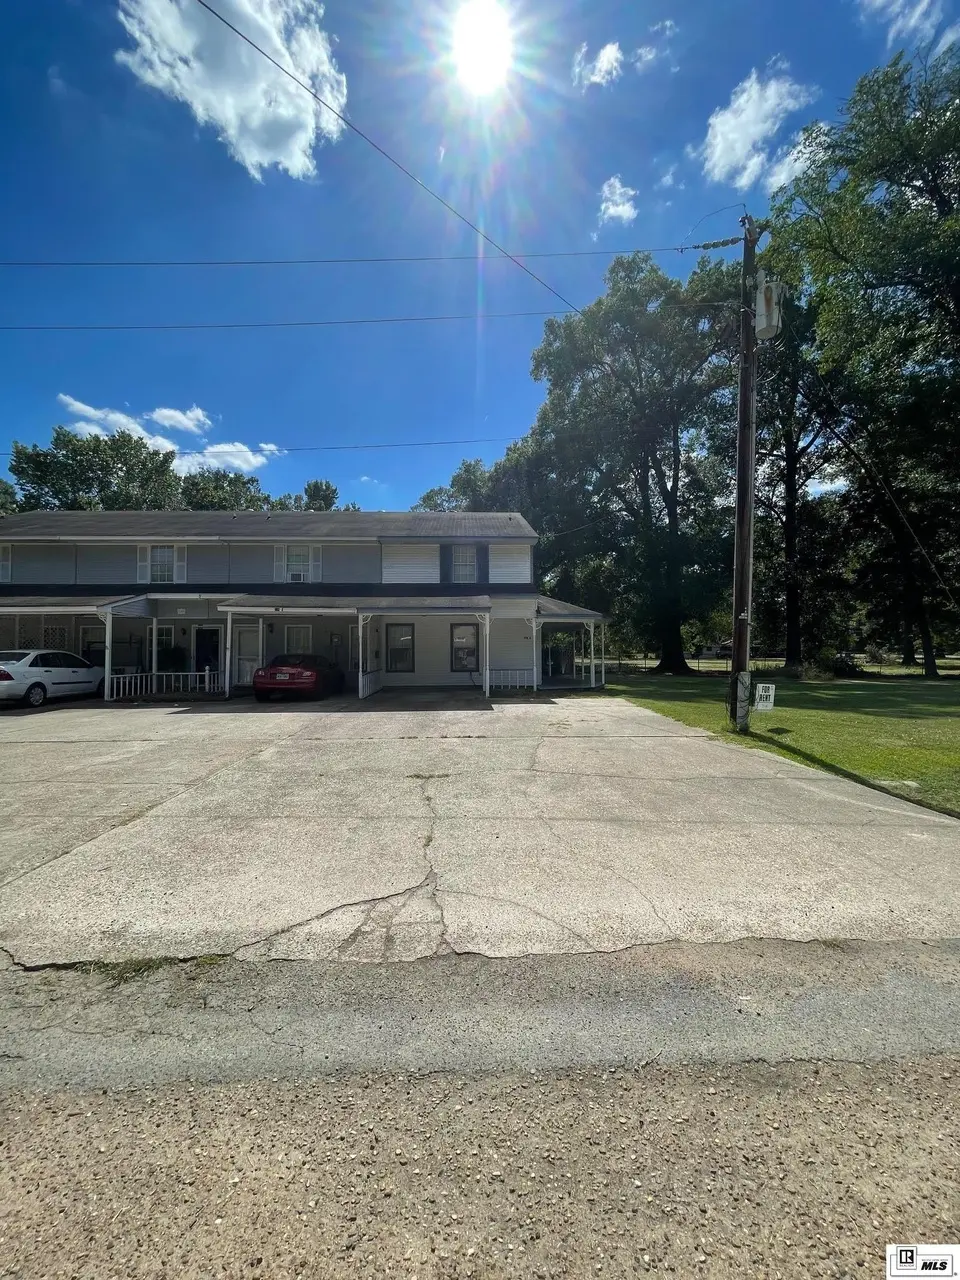
276 Clayton Dr · Swartz, LA
Flood risk 6/10 · Moderate
- FEMA flood zone
- X (shaded)
- Chance of flooding over 30 yrs
- 0.72%
- Est. flood insurance / yr
- $507 – $1,088
Fire risk 3/10 · Minor
- Est. fire insurance / yr
- $1,269 – $2,357
Heat risk 7/10 · Major
- Hot days now (above 111°F)
- 7 days/yr
- Hot days in 30 yrs
- 20 days/yr
Wind risk 6/10 · Moderate
- Chance of severe wind over 30 yrs
- 74.0%
Air-quality risk 1/10 · Minimal
- Unhealthy air days now
- 0 days/yr
- Unhealthy air days in 30 yrs
- 0 days/yr
Risk factors via First Street. Map © Google.
Why this score? — see what drove the D+ grade
The composite is a weighted blend of 9 inputs, each scored 0–100. Each bar is that input's sub-score; the figure is the points it added to the 100-point composite (weight × sub-score).
- ARV discount +15.0/15.0
- Cash flow +14.3/30.0
- DSCR +4.4/10.0
- 1% rule +4.0/10.0
- Schools +3.2/10.0
- Livability +3.2/5.0
- Rent growth +2.5/5.0
- Condition / age +2.5/5.0
- Appreciation +0.0/10.0
$135,000
🖨 Deal sheet (PDF) 📄 Offer letter ✓ Due diligence
Listing remarks
Cute 2 bed 1 full/1 half bath home tucked away at the end of Clayton drive in Swartz. Large workshop. Great built it's including an office right off the kitchen. Stop by soon this little gem won't last long!
Key facts
- 3,049 sq ft lot
- Garage
- Built 1986
Neighborhood map
What this means for you Summary
Snapshot
- This is a 2-bed/1.5-bath single-family listed at $135k.
Deal economics
- At list price, monthly cash flow is $26 ($306/yr) — positive.
- The deal already cash-flows at list — no discount required.
- To meet the 1% rule (rent ≥ 1% of price), the offer needs to be $121k (10.1% below list).
- Recommended offer: $119k (12.0% below list) — sets the bar for market timing.
Location & tenants
- Location reads 64/100 on livability (#184 in LA) — a middle-class / working-renter tenant base. Strengths: cost of living A+, housing A+; Watch: crime C-, health & safety D, amenities F.
- Ouachita Parish (suburban): math 31% / reading 45% proficiency, ranked #26 of 98 in LA (top 26%) — families likely to look elsewhere, expect single-tenant / working-renter base with shorter leases.
- Zoned schools: Lakeshore School (math 15% / reading 31%, grade F, #408 of 646 statewide, top 64%, 570 students, 75% FRL); Ouachita Junior High School (math 12% / reading 25%, grade F, #169 of 218 statewide, top 78%, 422 students, 80% FRL); Ouachita Parish High School (math 23% / reading 31%, grade F, #136 of 265 statewide, top 55%, 1,191 students, 66% FRL) — zoned schools average 74% FRL vs 52% district-wide (22 pts higher); higher-poverty schools than district average — tighter screening recommended.
- Zoned-school proficiency averages 23% at this address vs 38% district-wide (-15 pts) — the specific schools serving this property underperform the Ouachita Parish average; the district grade overstates school quality for this exact location.
- Market conditions: 440 active listings in the ZIP; 1 comparable units currently listed for rent nearby; 345 units permitted in Ouachita Parish in 2024 (0 in 5+ unit buildings).
Forward outlook
- Local home prices are declining (-3.0%/yr); year-one equity from $933 of loan paydown is wiped out by about $4k of value loss. Plan a longer hold.
Negotiation context
- It's been on market 151 days — a 12% lower offer ($119k) is reasonable based on typical stale-listing flexibility.
- 3 sale attempts since 3y ago; this cycle's ask is 14111% above the opening price — seller raised mid-cycle; expect resistance to lowballs.
Risks & watch-outs
- Climate carrying-cost: major flood risk; major wind risk, 74% chance of damaging wind over 30y; extreme-heat days projected 7→20/yr by 2055 (HVAC capex compounding) — expect insurance premiums to compound above CPI over the hold.
Questions for the listing agent
- It's been on market 151 days. Have you received any prior offers? Is the seller open to a 12% concession, seller financing, or rate buy-down credit?
- Why hasn't it sold? Are there any deal-killer items the seller is aware of (foundation, flood, title, zoning, code violations)?
- Is there a deadline driving the sale (1031 exchange, divorce, estate, relocation)? That informs how much negotiation room exists.
- The area grade is low — what's the realistic commute time and amenity access for the typical tenant pool here? Any planned neighborhood developments (good or bad) we should know about?
- What's the average days-on-market for RENTAL listings here right now (not sales)? A rising rental-DOM trend means longer vacancies and softer asking-rent achievability than the comps imply.
- What's the recent tenant-quality profile in this submarket — average credit score on applications, eviction rate, late-payment / NSF rate, and stable-employment percentage? A property-management company in the area should have these aggregated.
- How much new for-sale + rental construction is in the pipeline within 1–3 miles? Heavy new supply typically softens prices + rents 12–24 months out; constrained supply supports both.
Investment metrics
- 1% rule
- 0.90% ✗
- Cap rate
- 6.52%
- Cash-on-cash
- 0.81%
- DSCR
- 1.04
- GRM
- 9.3
CMA / ARV
- ARV (on-the-fly)
- $180,747
- Comps found
- 1
Show comp detail 1 sale within ~0.75 mi
| Address | Dist | Beds/Ba | Sqft | Sold | Price | $/sf | Match |
|---|---|---|---|---|---|---|---|
| 515 Lincoln Rd #168 | 0.66mi | 2/2.5 | 1,131 (-6%) | 7mo | $171,100 | $151 | 50 |
Match score weights: distance 35% · size 25% · config 20% · recency 20%. Top-matched comps best support the ARV.
Projected returns pro-forma
-3.0% appreciation · 3.0% rent growth · sell at horizon
- IRR
- -15.0%
- Equity multiple
- 0.46×
- Total profit
- $-20,231
- Equity at exit
- $20,129
- IRR
- -6.4%
- Equity multiple
- 0.59×
- Total profit
- $-15,448
- Equity at exit
- $11,672
Cash invested: $37,800 (down + closing). Projections, not guarantees.
Landlord ↔ Tenant lean methodology
- Overall (STATE)
- 90 Strongly Landlord-Friendly
- State Louisiana
- 90 Strongly Landlord-Friendly · R+12
- County
- — inherits STATE
- City
- — inherits STATE
ZIP-level market 71203
- Home prices YoY
- -32.4%
- Active inventory
- 440
- Price-to-rent
- 9.3×
Monthly cashflow live
- Estimated rent
- $1,213 medium interval (Pro) →
- Mortgage (P&I)
- −$708
- Tax est. 1.5%
- −$169 /mo · $2,025/yr
- Insurance
- −$56
- HOA
- −$0
- Vacancy / Maint / Mgmt
- −$255
- Net cashflow
- $26
Break-even live
Sensitivity live
| Price | -10% $119 | -5% $72 | +0% $26 | +5% $-21 | +10% $-68 |
|---|---|---|---|---|---|
| Rent | -10% $-70 | -5% $-22 | +0% $26 | +5% $73 | +10% $121 |
| Rate | -1.0pp $94 | -0.5pp $60 | base $26 | +0.5pp $-9 | +1.0pp $-45 |
UW: 25.0% down · 7.5% · 30yr · 1.5% tax · 5.0% vac · 8.0% maint · 8.0% mgmt
Financing live
Cash to close
- Down payment
- $33,750
- Closing costs
- $4,050
- Reserves months
- —
- Total cash needed
- —
Loan-product check · same deal, 3 products live
Conventional
25% down · 7.5% · 30yr
- Down + closing
- —
- Monthly P&I
- —
- Monthly cashflow
- —
- DSCR
- —
- Eligible?
- —
Personal DTI + credit; lowest rate.
DSCR
20% down · 8.5% · 30yr
- Down + closing
- —
- Monthly P&I
- —
- Monthly cashflow
- —
- DSCR
- —
- Eligible?
- —
No personal income docs; deal must DSCR.
Hard money
10% down · 12.0% · 12mo
- Down + closing
- —
- Monthly P&I
- —
- Monthly cashflow
- —
- DSCR
- —
- Eligible?
- —
Short-term bridge; refi at stabilization.
Rent comps 1 comps
| Address | Beds | Baths | Sqft | Rent | $/sqft | DOM | Units | Dist |
|---|---|---|---|---|---|---|---|---|
| 206 Curve Dr Monroe, LA | 1.0 | 1.5 | 720 | $830 | $1.15 | 23d | 1 | 1.34mi |
Listing history 6 events
-
2024-01-19status Pending
-
2024-01-12historical $950
-
2023-12-28$950
-
2023-12-15historical $950
-
2023-11-09$950
-
2023-08-21$135,000 Active
ⓘ Source: listings_history table (triggers on properties + properties_extension) + one-shot
backfill from property_details.listing_events for pre-trigger history.
Climate risk First Street
- Flood 6/10 Major FEMA zone X (shaded) · 72% chance over 30 yrs
- Wildfire 3/10 Moderate
- Heat 7/10 Severe 7 d/yr ≥111°F today · 20 d/yr by 30 yrs out
- Wind 6/10 Major 74% chance of damaging wind over 30 yrs
- Air quality 1/10 Low 0 unhealthy d/yr today · 0 by 30 yrs out
Nearby sold comps map
Loading sold comps map…
Walkable amenities ~0.75 mi
Loading nearby amenities…
Taxation est. · year 1
- Rental income
- $14,559
- − Mortgage interest
- −$7,562
- − Property taxes
- −$2,025
- − Insurance
- −$675
- − Repairs & maintenance
- −$1,165
- − Management
- −$1,165
- − Depreciation
- −$3,927
- Taxable loss
- −$1,960
- Est. tax savings @ 24.0%
- +$470
- After-tax cash flow
- $777/yr
For passive investors: Depreciation is non-cash, so a rental often shows a tax loss while cash-flowing — sheltering income. Rental losses are passive: they offset passive income freely, and up to $25,000/yr can offset ordinary (W-2) income if you actively participate and your MAGI is under $100k (phasing out to $0 by $150k); unused losses carry forward. On sale, claimed depreciation is recaptured at up to 25%, and gains may owe capital-gains tax (a 1031 exchange can defer both). Figures are a year-1 estimate at your 24.0% rate — not tax advice; consult a CPA.
Schools (NCES district)
- District
- Ouachita Parish
- NCES district ID
- 2201200
- Math proficiency
- 31% ▼ -38.00%
- Reading proficiency
- 45% ▼ -31.00%
- Median HH income
- $43,316
- Composite
- 32.14/100
- National rank
- #5791
- State rank
- #26 of 98 in LA
Livability — Swartz
- Score
- 64/100
- State rank
- #184
- US rank
- #14862
Category grades
Schools grade is shown separately in the Schools card above.
Census & demographics
- Census place
- Swartz, LA
- County
- Ouachita Parish · 118,340 people
- Metro
- Monroe, LA
- Population (ZIP)
- 38,354
- Household income
- $52,326
- Rent vs Own
- Severe rent burden
- 2085.0
Population outlook (Ouachita County) Hauer SSP2
- Today (2025)
- 163,370 people
- By 2030
- 165,520 · +1.3%
- By 2040
- 167,652 · +2.6%
- By 2050
- 166,699 · +2.0%
- By 2075
- 156,348 · -4.3%
- By 2100
- 134,102 · -17.9%
Race, ethnicity, and origin ACS 2023
- Neighborhood character
- Diverse neighborhood (Simpson 0.57)
- Race & ethnicity
- Black 48% White 45% Two or more races 4% Hispanic / Latino 3% Asian 1%
- Common ancestry
- Lithuanian 3% Slovak 1% Serbian 1%
- Foreign-born
- 3% · Canada
- Languages at home
- 96% English-only · Spanish 2% Other Indo-European 1%
Political lean MEDSL · Ouachita
- 2024 margin
- Strong R (+27.9) · D 35.5% · R 63.3% · Other 1.2%
- 2008→2024 swing
- -2.7pp toward R · 2008: -25.2pp · 2024: -27.9pp
- All cycles
- 2024: R+27.9 2020: R+23.6 2016: R+25.4 2012: R+20.9 2008: R+25.2
Not yet ingested
- Civics
- —
Market trends
- HPI YoY
- ▼ -99.01%
- Current HPI
- 206.1948
- Rent YoY
- —
- Metro
- Monroe, LA
- State GDP YoY
- ▲ 3.29%
- F500 in state
- 10
Industry mix (Fortune 500 HQ in LA)
| Industry | F500 HQs | Revenue |
|---|---|---|
| Telecommunications | 2 | $23B |
|
||
| Utilities | 1 | $12B |
|
||
| Wholesale / Distribution | 1 | $5B |
|
||
| Advertising | 1 | $2B |
|
||
Price history
6 events — show timeline
- 2024-01-19 Pending — NELABOR
- 2024-01-12 Rental Removed $950 TURBOTENANT
- 2023-12-28 Listed for Rent $950 TURBOTENANT
- 2023-12-15 Rental Removed $950 TURBOTENANT
- 2023-11-09 Listed for Rent $950 TURBOTENANT
- 2023-08-21 Listed $135,000 NELABOR
Cash-flow waterfall
monthlySold comps — $/sqft
last 12 mo · ≤1 miLoading sold comps…