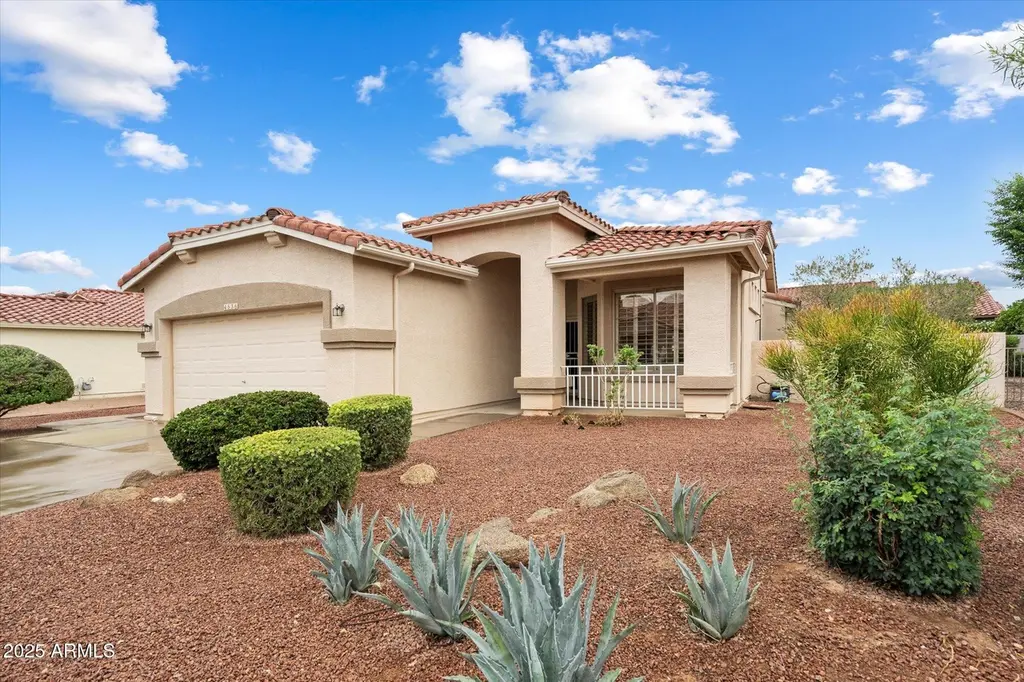
4536 E Strawberry Dr · Gilbert, AZ
Flood risk 1/10 · Minimal
- FEMA flood zone
- X (shaded)
- Chance of flooding over 30 yrs
- 0.0%
- Est. flood insurance / yr
- $507 – $1,088
Fire risk 5/10 · Moderate
- Est. fire insurance / yr
- $610 – $1,132
Heat risk 9/10 · Severe
- Hot days now (above 111°F)
- 7 days/yr
- Hot days in 30 yrs
- 17 days/yr
Wind risk 1/10 · Minimal
- Chance of severe wind over 30 yrs
- —
Air-quality risk 2/10 · Minimal
- Unhealthy air days now
- 1 days/yr
- Unhealthy air days in 30 yrs
- 1 days/yr
Risk factors via First Street. Map © Google.
Why this score? — see what drove the D- grade
The composite is a weighted blend of 9 inputs, each scored 0–100. Each bar is that input's sub-score; the figure is the points it added to the 100-point composite (weight × sub-score).
- Appreciation +9.2/10.0
- ARV discount +7.0/15.0
- Cash flow +6.0/30.0
- Schools +5.2/10.0
- Livability +4.4/5.0
- Rent growth +3.6/5.0
- Condition / age +2.5/5.0
- 1% rule +0.7/10.0
- DSCR +0.4/10.0
$465,000
🖨 Deal sheet 📄 Offer letter ✓ Due diligence
Listing remarks MLS
BEAUTIFUL HOME/WELL MAINTAINED/MOVE IN READY Just bring your clothes and golf clubs! Fresh interior paint, new tile and plantation shutters. Beautiful new quartz countertop in the kitchen along with a undermount sink. Island is wrapped in wainscoting with an extended quartz countertop. Dining area also has wainscoting, Split floorplan perfect for company. Great for entertaining as the kitchen is open to the family room which leads out to the back patio, Plenty of room for outdoor dining/entertaining with added flagstone off of the patio. Backyard is fenced. The garage has a sink and shelving. Active Adult Community with many activities for everyone. This is a clean home.
Key facts
- Quartz countertops
- Split floor plan
- Plantation shutters
Tags
Property features AI
Finance
- Other: Lot features include a 7,528 sq ft parcel (assessor source)
- HOA & community: Community association with quarterly fee; Association fee due quarterly; Association fee covers grounds maintenance and street maintenance; Association rules prohibit visible trucks, trailers, RVs, and boats; Community amenities include golf, tennis, pickleball, racquetball, biking/walking paths, and a community media room
Exterior
- Parking: 2 covered parking spaces; 2 open parking spaces; 2-car garage with garage door opener
- Security: Gated community; Guarded entry with security guard
- Utilities: City water; Public sewer
- Home design: Fee simple ownership; Single family residence
- Construction: Stucco and wood frame construction; Tile roof
- Exterior features: Heated spa; Wrought iron fencing; Sprinklers front and rear with auto timers; Desert front and back landscaping; Pool and community amenities (pool, community spa, community spa heated)
Interior
- Kitchen: Built-in microwave; Refrigerator; Dishwasher; Garbage disposal; Kitchen island
- Bedrooms: 3 possible bedrooms
- Flooring: Carpet; Laminate; Tile
- Bathrooms: 2 full bathrooms
- Heating & cooling: Natural gas heating; Central air; Ceiling fans; Programmable thermostat
- Interior features: Double vanity; Eat-in kitchen; Breakfast bar; No interior steps; Vaulted ceilings; Kitchen island; Master bedroom with 3/4 bath; Solar screens on windows; Dual pane windows; Family room gas fireplace
- Laundry & utility: Laundry room inside
Neighborhood map
What this means for you Summary
Snapshot
- This is a 3-bed/3.0-bath single-family listed at $465k.
Deal economics
- At list price, monthly cash flow is $-885 ($-11k/yr) — negative.
- To cash-flow at today's rent, offer at most $309k (33.6% below list).
- To meet the 1% rule (rent ≥ 1% of price), the offer needs to be $264k (43.3% below list).
- Recommended offer: $264k (43.3% below list) — sets the bar for 1% rule.
- Cap rate 4.0% vs local median 3.2% in Gilbert — meaningfully above typical; check what's discounted (condition, days-on-market, listing class) to confirm the premium yield is real.
Location & tenants
- Location reads 87/100 on livability (#1 in AZ, #240 nationally) — a professional / high-income tenant draw. Strengths: schools A+, amenities A+, employment A+; Watch: health & safety C-, cost of living F.
- Higley Unified School District (4248) (suburban): math 56% / reading 58% proficiency, ranked #21 of 249 in AZ (top 8%) — acceptable for families but not a draw, mixed tenant base, ~2y average lease; only 15% free/reduced lunch — higher-income household profile.
- Market conditions: Rents rising fast (+4.3%/yr); 329 active listings in the ZIP; 27 comparable units currently listed for rent nearby; rentals at typical pace (median 19d on market — plan ~3-4 weeks tenant-placement turnaround); high-income renter base; 36,011 units permitted in Maricopa County in 2024 (12,801 in 5+ unit buildings).
Forward outlook
- In year one you build about $42k of equity ($3k loan paydown + $39k appreciation (8.4% local appreciation)).
- Maricopa County population projected at +38% by 2050 — long-run rental-demand tailwind backs the buy-and-hold thesis.
- By year 2, paydown + projected appreciation supports a ~$67k cash-out refi (75% LTV) — recoverable capital for the next deal without selling this one.
Negotiation context
- Only 6 days on market — expect competitive offers; lowballing is unlikely to land.
- 7 sale attempts since 8y ago with the ask held roughly flat each time — persistent listings suggest the price (not the market) is what's stuck; bring a comps-based counter.
Risks & watch-outs
- Climate carrying-cost: moderate wildfire risk; extreme-heat days projected 7→17/yr by 2055 (HVAC capex compounding) — expect insurance premiums to compound above CPI over the hold.
Questions for the listing agent
- What do current leases actually rent for vs. the listed asking? Can we see a recent rent roll and the last 12 months of T-12 income?
- What does the HOA fee cover, when was the last increase, and are there any pending special assessments or reserve-fund shortfalls?
- Is there a deadline driving the sale (1031 exchange, divorce, estate, relocation)? That informs how much negotiation room exists.
- Schools are A-rated — typically a magnet for longer-tenancy family renters. What's the average tenant stay here, and is there a school-zone premium baked into asking?
- The area grade is low — what's the realistic commute time and amenity access for the typical tenant pool here? Any planned neighborhood developments (good or bad) we should know about?
- What's the average days-on-market for RENTAL listings here right now (not sales)? A rising rental-DOM trend means longer vacancies and softer asking-rent achievability than the comps imply.
- What's the recent tenant-quality profile in this submarket — average credit score on applications, eviction rate, late-payment / NSF rate, and stable-employment percentage? A property-management company in the area should have these aggregated.
- How much new for-sale + rental construction is in the pipeline within 1–3 miles? Heavy new supply typically softens prices + rents 12–24 months out; constrained supply supports both.
Investment metrics
- 1% rule
- 0.57% ✗
- Cap rate
- 4.01%
- Cash-on-cash
- -8.16%
- DSCR
- 0.64
- GRM
- 14.7
CMA / ARV
- ARV (on-the-fly)
- $460,089
- Comps found
- 12
Show comp detail 12 sales within ~0.75 mi
| Address | Dist | Beds/Ba | Sqft | Sold | Price | $/sf | Match |
|---|---|---|---|---|---|---|---|
| 4694 E Mia Ct | 0.34mi | 3/2.0 | 1,407 (0%) | 2mo | $480,000 | $341 | 79 |
| 5091 S Peachwood Dr | 0.33mi | 3/2.0 | 1,412 (+0%) | 3mo | $477,500 | $338 | 78 |
| 4685 E Walnut Rd | 0.24mi | 2/2.0 (-1) | 1,437 (+2%) | 3mo | $470,000 | $327 | 74 |
| 4684 E Walnut Rd | 0.23mi | 2/2.0 (-1) | 1,332 (-5%) | 1mo | $435,000 | $327 | 71 |
| 4687 E Mia Ct | 0.36mi | 2/2.0 (-1) | 1,433 (+2%) | 2mo | $460,000 | $321 | 70 |
| 5020 S Citrus Ln | 0.30mi | 2/2.0 (-1) | 1,471 (+4%) | 3mo | $549,000 | $373 | 67 |
| 4624 E Indigo St | 0.40mi | 2/2.0 (-1) | 1,437 (+2%) | 4mo | $425,000 | $296 | 66 |
| 5127 S Almond Ct | 0.37mi | 2/2.0 (-1) | 1,334 (-5%) | 3mo | $420,000 | $315 | 63 |
| 4239 E Azalea Dr | 0.58mi | 3/2.0 | 1,604 (+14%) | 4mo | $575,000 | $358 | 42 |
| 4696 E Carob Dr | 0.62mi | 2/2.0 (-1) | 1,604 (+14%) | 4mo | $480,000 | $299 | 36 |
| 4111 E Appleby Dr | 0.72mi | 2/2.0 (-1) | 1,604 (+14%) | 2mo | $440,000 | $274 | 32 |
| 5380 S Lantana Ln | 0.74mi | 2/2.0 (-1) | 1,604 (+14%) | 2mo | $480,000 | $299 | 32 |
Match score weights: distance 35% · size 25% · config 20% · recency 20%. Top-matched comps best support the ARV.
Projected returns pro-forma
8.36% appreciation · 4.31% rent growth · sell at horizon
- IRR
- 15.1%
- Equity multiple
- 2.15×
- Total profit
- $149,453
- Equity at exit
- $364,816
- IRR
- 15.0%
- Equity multiple
- 4.71×
- Total profit
- $483,626
- Equity at exit
- $735,450
Cash invested: $130,200 (down + closing). Projections, not guarantees.
Landlord ↔ Tenant lean methodology
- Overall (STATE)
- 87 Strongly Landlord-Friendly
- State Arizona
- 87 Strongly Landlord-Friendly · R+3
- County
- — inherits STATE
- City
- — inherits STATE
ZIP-level market 85298
- Home prices YoY
- 2.5%
- Rents YoY
- 4.3%
- Active inventory
- 329
- Price-to-rent
- 14.7×
Monthly cashflow live
- Estimated rent
- $2,637 high interval (Pro) →
- Mortgage (P&I)
- −$2,439
- Tax from tax record
- −$127 /mo · $1,526/yr
- Insurance
- −$194
- HOA
- −$209
- Vacancy / Maint / Mgmt
- −$554
- Net cashflow
- $-885
Break-even live
UW: 25.0% down · 7.5% · 30yr · 1.5% tax · 5.0% vac · 8.0% maint · 8.0% mgmt
Financing live
Cash to close
- Down payment
- $116,250
- Closing costs
- $13,950
- Reserves months
- —
- Total cash needed
- —
Loan-product check · same deal, 3 products live
Conventional
25% down · 7.5% · 30yr
- Down + closing
- —
- Monthly P&I
- —
- Monthly cashflow
- —
- DSCR
- —
- Eligible?
- —
Personal DTI + credit; lowest rate.
DSCR
20% down · 8.5% · 30yr
- Down + closing
- —
- Monthly P&I
- —
- Monthly cashflow
- —
- DSCR
- —
- Eligible?
- —
No personal income docs; deal must DSCR.
Hard money
10% down · 12.0% · 12mo
- Down + closing
- —
- Monthly P&I
- —
- Monthly cashflow
- —
- DSCR
- —
- Eligible?
- —
Short-term bridge; refi at stabilization.
Rent comps 27 comps
| Address | Beds | Baths | Sqft | Rent | $/sqft | DOM | Units | Dist |
|---|---|---|---|---|---|---|---|---|
| 4554 E Strawberry Dr Gilbert, AZ | 2.0 | 2.0 | 1407 | $2,500 | $1.78 | 24d | 1 | 0.03mi |
| 4269 E Cassia Ln Gilbert, AZ | 2.0 | 2.0 | 1407 | $2,495 | $1.77 | 24d | 1 | 0.38mi |
| 5141 S Eucalyptus Dr Gilbert, AZ | 2.0 | 2.0 | 1604 | $3,700 | $2.31 | 1d | 1 | 0.51mi |
| 4094 E Azalea Dr Gilbert, AZ | 2.0 | 2.0 | 1308 | $2,500 | $1.91 | 24d | 1 | 0.68mi |
| 4502 E Narrowleaf Dr Gilbert, AZ | 2.0 | 2.0 | 1604 | $2,500 | $1.56 | 24d | 1 | 0.76mi |
| 4147 S Bandit Ct Gilbert, AZ | 4.0 | 2.0 | 1692 | $2,295 | $1.36 | 2d | 1 | 0.87mi |
| 4147 S Bandit Ct Gilbert, AZ | 4.0 | 2.0 | 1692 | $2,395 | $1.42 | 24d | 1 | 0.87mi |
| 4374 S Woodshed Rd Gilbert, AZ | 3.0 | 2.5 | 1724 | $2,249 | $1.30 | 20d | 1 | 0.93mi |
| 4091 S Vineyard Ave Gilbert, AZ | 3.0 | 2.0 | 1584 | $2,149 | $1.36 | 24d | 1 | 0.94mi |
| 7640 S Power Rd Gilbert, AZ | 2.0–3.0 | 2.0 | 975 | $2,025 | $2.08 | 2d | 4 | 0.95mi |
| 4569 E Sundance Ave Gilbert, AZ | 3.0 | 2.0 | 1584 | $2,050 | $1.29 | 24d | 1 | 0.97mi |
| 18650 E Swan Dr Queen Creek, AZ | 3.0 | 2.0 | 1637 | $2,400 | $1.47 | 18d | 1 | 1.15mi |
| 4632 E Germann Rd Gilbert, AZ | 1.0–3.0 | 1.0–2.0 | 1050 | $2,083 | $1.98 | 2d | 23 | 1.15mi |
| 4632 E Germann Rd Gilbert, AZ | 1.0–3.0 | 1.0–2.0 | 1050 | $2,148 | $2.05 | 10d | 23 | 1.15mi |
| 4055 S Ranch House Pkwy Gilbert, AZ | 1.0–2.0 | 1.0–2.0 | 1102 | $2,689 | $2.44 | 2d | 7 | 1.18mi |
| 3710 E Lodgepole Dr Gilbert, AZ | 3.0 | 2.0 | 1818 | $2,650 | $1.46 | 12d | 1 | 1.29mi |
| 5149 S Moccasin Trl Gilbert, AZ | 3.0 | 2.5 | 1675 | $2,750 | $1.64 | 15d | 1 | 1.33mi |
| 3855 E Santa Fe Ln Gilbert, AZ | 3.0 | 2.5 | 1573 | $1,795 | $1.14 | 20d | 1 | 1.35mi |
| 3636 E Lodgepole Dr Gilbert, AZ | 3.0 | 2.0 | 1818 | $3,075 | $1.69 | 16d | 1 | 1.37mi |
| 3668 E Moreno St Gilbert, AZ | 3.0 | 3.0 | 1828 | $2,480 | $1.36 | 4d | 1 | 1.39mi |
| 3816 E Trigger Way Gilbert, AZ | 3.0 | 2.5 | 1564 | $1,975 | $1.26 | 20d | 1 | 1.48mi |
| 3938 S Napa Ln Gilbert, AZ | 3.0 | 2.5 | 1564 | $2,188 | $1.40 | 24d | 1 | 1.48mi |
| 4750 E Thunderheart Trl #103 Gilbert, AZ | 3.0 | 2.0 | 1368 | $1,925 | $1.41 | 4d | 1 | 1.48mi |
| 4703 E Waterman St #102 Gilbert, AZ | 3.0 | 3.0 | 1386 | $2,200 | $1.59 | 18d | 1 | 1.49mi |
| 4729 E Waterman St Gilbert, AZ | 3.0 | 2.5 | 1368 | $2,045 | $1.49 | 3d | 1 | 1.49mi |
| 3806 E Trigger Way Gilbert, AZ | 3.0 | 2.5 | 1564 | $2,099 | $1.34 | 2d | 1 | 1.50mi |
| 3922 S Napa Ln Gilbert, AZ | 3.0 | 2.5 | 1684 | $2,020 | $1.20 | 22d | 1 | 1.50mi |
HOA detail
- Monthly dues
- $209 · $2,508/yr
Listing history 6 events
-
2026-06-18days on market $465,000 Active 6 DOM
-
2026-06-17days on market $465,000 Active 5 DOM
-
2026-06-16days on market $465,000 Active 4 DOM
-
2026-06-15days on market $465,000 Active 3 DOM
-
2026-06-13remarks 699-char remark
-
2026-06-13$465,000 Active 1 DOM
ⓘ Source: listings_history table (triggers on properties + properties_extension) + one-shot
backfill from property_details.listing_events for pre-trigger history.
Tax reassessment forecast AZ · Resets to sale price
- Current annual tax
- $1,526 · $127/mo
- Projected year-2 tax
- $3,069 · $256/mo
- Expected delta
- +$1,543/yr (+$129/mo · 101.1%)
ⓘ Screening estimate from a state-policy table — verify with the county assessor before closing.
Climate risk First Street
- Flood 1/10 Low FEMA zone X (shaded) · 0% chance over 30 yrs
- Wildfire 5/10 Major
- Heat 9/10 Extreme 7 d/yr ≥111°F today · 17 d/yr by 30 yrs out
- Wind 1/10 Low
- Air quality 2/10 Low 1 unhealthy d/yr today · 1 by 30 yrs out
Nearby sold comps map
Loading sold comps map…
Walkable amenities ~0.75 mi
Loading nearby amenities…
Taxation est. · year 1
- Rental income
- $31,648
- − Mortgage interest
- −$26,047
- − Property taxes
- −$1,526
- − Insurance
- −$2,325
- − Repairs & maintenance
- −$2,532
- − Management
- −$2,532
- − HOA
- −$2,508
- − Depreciation
- −$13,527
- Taxable loss
- −$19,349
- Est. tax savings @ 24.0%
- +$4,644
- After-tax cash flow
- $-5,975/yr
For passive investors: Depreciation is non-cash, so a rental often shows a tax loss while cash-flowing — sheltering income. Rental losses are passive: they offset passive income freely, and up to $25,000/yr can offset ordinary (W-2) income if you actively participate and your MAGI is under $100k (phasing out to $0 by $150k); unused losses carry forward. On sale, claimed depreciation is recaptured at up to 25%, and gains may owe capital-gains tax (a 1031 exchange can defer both). Figures are a year-1 estimate at your 24.0% rate — not tax advice; consult a CPA.
Schools (NCES district)
- District
- Higley Unified School District (4248)
- NCES district ID
- 0403780
- Math proficiency
- 56% ▼ -10.00%
- Reading proficiency
- 58% ▼ -8.00%
- Median HH income
- $82,526
- Composite
- 51.7/100
- National rank
- #1688
- State rank
- #21 of 249 in AZ
Livability — Gilbert
- Score
- 87/100
- State rank
- #1
- US rank
- #240
Category grades
Schools grade is shown separately in the Schools card above.
Census & demographics
- Census place
- Gilbert, AZ
- County
- Maricopa County · 4,537,380 people
- City population
- 281,769
- Metro
- Phoenix-Mesa-Chandler, AZ
- Population (ZIP)
- 44,114
- Household income
- $156,425
- Rent vs Own
- Severe rent burden
- 173.0
Population outlook (Maricopa County) Hauer SSP2
- Today (2025)
- 4,979,203 people
- By 2030
- 5,378,229 · +8.0%
- By 2040
- 6,156,598 · +23.6%
- By 2050
- 6,872,376 · +38.0%
- By 2075
- 8,401,270 · +68.7%
- By 2100
- 9,247,439 · +85.7%
Race, ethnicity, and origin ACS 2023
- Neighborhood character
- Predominantly White (72%)
- Race & ethnicity
- White 72% Hispanic / Latino 14% Two or more races 11% Asian 7% Black 2%
- Hispanic origin (detail)
- Mexican 10%
- Common ancestry
- Italian 4% Romanian 3% Lithuanian 3%
- Foreign-born
- 9% · Canada, China, Vietnam
- Languages at home
- 85% English-only · Spanish 7% Other Indo-European 2% Chinese 1%
Political lean MEDSL · Maricopa
- 2024 margin
- Toss-up / Even · D 47.7% · R 51.2% · Other 1.1%
- 2008→2024 swing
- +7.1pp toward D · 2008: -10.6pp · 2024: -3.5pp
- All cycles
- 2024: R+3.5 2020: D+2.2 2016: R+3.5 2012: R+12.0 2008: R+10.6
Not yet ingested
- Civics
- —
Market trends
- HPI YoY
- ▲ 8.36%
- Current HPI
- 343.6932
- Rent YoY
- ▲ 4.31%
- Metro
- Phoenix-Mesa-Chandler, AZ
- State GDP YoY
- ▲ 4.54%
- F500 in state
- 20
Industry mix (Fortune 500 HQ in AZ)
| Industry | F500 HQs | Revenue |
|---|---|---|
| Technology | 2 | $13B |
|
||
| Mining / Metals | 1 | $23B |
|
||
| Environmental Services | 1 | $16B |
|
||
| Metals / Steel | 1 | $14B |
|
||
| Technology Distribution | 1 | $9B |
|
||
| Homebuilding | 1 | $8B |
|
||
Price history
+66.1% since first listed28 events — show timeline
- 2026-06-12 Listed $465,000 ARMLS
- 2026-04-11 Listing Removed — ARMLS
- 2026-03-11 Price Changed $470,000 ARMLS
- 2026-02-27 Relisted — ARMLS
- 2026-02-20 Listing Removed — ARMLS
- 2026-02-07 Contingent — ARMLS
- 2026-02-02 Price Changed $480,000 ARMLS
- 2026-01-28 Price Changed $487,000 ARMLS
- 2025-12-13 Price Changed $494,999 ARMLS
- 2025-11-26 Price Changed $499,999 ARMLS
- 2025-11-14 Price Changed $507,000 ARMLS
- 2025-10-10 Listed $510,000 ARMLS
- 2021-12-17 Sold (Public Records) $449,900 Public Records
- 2021-12-17 Sold (MLS) $449,900 ARMLS
- 2021-12-17 Pending — ARMLS
- 2021-11-15 Contingent — ARMLS
- 2021-11-10 Listed $449,900 ARMLS
- 2021-05-06 Sold (Public Records) $385,000 Public Records
- 2021-05-06 Sold (MLS) $385,000 ARMLS
- 2021-04-04 Pending — ARMLS
- 2021-03-31 Listed $359,900 ARMLS
- 2018-11-15 Sold (MLS) $273,000 ARMLS
- 2018-10-18 Contingent — ARMLS
- 2018-10-12 Price Changed $277,900 ARMLS
- 2018-09-29 Relisted — ARMLS
- 2018-09-03 Contingent — ARMLS
- 2018-08-18 Price Changed $279,900 ARMLS
- 2018-08-14 Listed $280,000 ARMLS
Property tax history
+0.3%/yrLatest (2025): $1,526 · -6.4% YoY. Source: county tax records.
Cash-flow waterfall
monthlySold comps — $/sqft
last 12 mo · ≤1 miLoading sold comps…