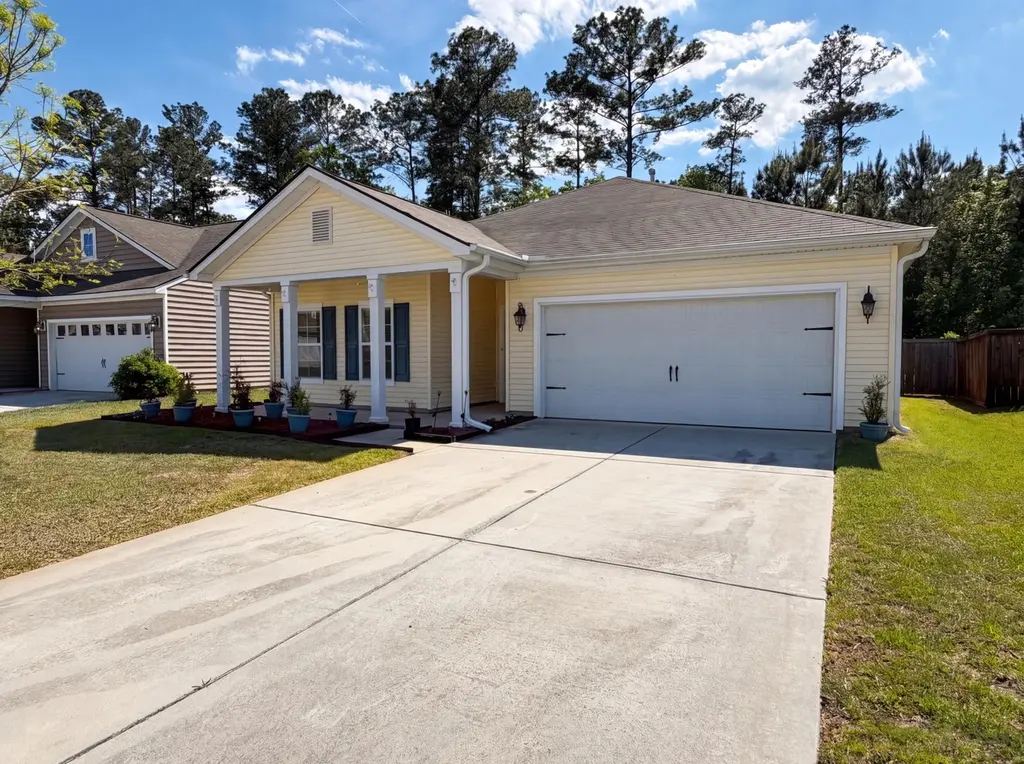
537 Nandina Dr · Goose Creek, SC
Flood risk 1/10 · Minimal
- FEMA flood zone
- X (unshaded)
- Chance of flooding over 30 yrs
- 0.0%
- Est. flood insurance / yr
- $507 – $1,088
Fire risk 5/10 · Moderate
- Est. fire insurance / yr
- $783 – $1,453
Heat risk 9/10 · Severe
- Hot days now (above 107°F)
- 7 days/yr
- Hot days in 30 yrs
- 18 days/yr
Wind risk 8/10 · Major
- Chance of severe wind over 30 yrs
- 99.0%
Air-quality risk 2/10 · Minimal
- Unhealthy air days now
- 2 days/yr
- Unhealthy air days in 30 yrs
- 2 days/yr
Risk factors via First Street. Map © Google.
Why this score? — see what drove the D grade
The composite is a weighted blend of 9 inputs, each scored 0–100. Each bar is that input's sub-score; the figure is the points it added to the 100-point composite (weight × sub-score).
- Cash flow +13.7/30.0
- ARV discount +10.2/15.0
- DSCR +4.2/10.0
- Rent growth +3.6/5.0
- Schools +3.6/10.0
- Livability +3.4/5.0
- 1% rule +2.9/10.0
- Condition / age +2.5/5.0
- Appreciation +0.0/10.0
$332,000
🖨 Deal sheet (PDF) 📄 Offer letter ✓ Due diligence
Listing remarks MLS
Welcome to 537 Nandina Dr, a single-family residence with a straightforward, functional layout. The kitchen is equipped with all stainless steel appliances and features an accent backsplash. The primary bathroom includes double sinks. A covered patio extends to a fully fenced backyard. This residence combines modern elements with practical outdoor living.. Included 100-Day Home Warranty with buyer activation
Key facts
- Covered patio
- Accent backsplash
- 6,534 sq ft lot
Tags
Property features AI
Finance
- HOA & community: HOA fee collected semi-annually
Exterior
- Parking: Detached 2-car garage
- Utilities: Public sewer
- Home design: Single-family detached home; Residential property
- Construction: No additional structures on the property
- Exterior features: Community clubhouse; Community fitness center; Community pool; Walk/jog trails
Interior
- Kitchen: Dishwasher; Gas range; Microwave
- Bedrooms: 3 bedrooms
- Flooring: Laminate
- Bathrooms: 2 bathrooms
- Heating & cooling: Central air
- Interior features: Laminate flooring; Laundry room
- Laundry & utility: Laundry room
Neighborhood map
What this means for you Summary
Snapshot
- This is a 3-bed/2.0-bath single-family listed at $332k.
Deal economics
- At list price, monthly cash flow is $26 ($316/yr) — positive.
- The deal already cash-flows at list — no discount required.
- To meet the 1% rule (rent ≥ 1% of price), the offer needs to be $263k (20.9% below list).
- Recommended offer: $263k (20.9% below list) — sets the bar for 1% rule.
- Cap rate 6.4% vs local median 4.0% in Goose Creek — top-decile yield for the area; either an underpriced asset or a hidden risk that comps aren't pricing in. Stress-test before assuming the spread holds.
Location & tenants
- Location reads 67/100 on livability (#103 in SC) — a middle-class / working-renter tenant base. Strengths: housing A+, employment A, cost of living B+; Watch: amenities F, commute F, health & safety F.
- Berkeley 01 (suburban): math 35% / reading 48% proficiency, ranked #30 of 80 in SC (top 38%) — families likely to look elsewhere, expect single-tenant / working-renter base with shorter leases.
- Zoned schools: Berkeley Elementary (619 students, 100% FRL); Sedgefield Middle (math 13% / reading 26%, grade F, #182 of 229 statewide, top 80%, 986 students, 100% FRL); Goose Creek High (math 33% / reading 68%, grade D+, #150 of 196 statewide, top 76%, 1,981 students, 52% FRL) — zoned schools average 84% FRL vs 48% district-wide (36 pts higher); higher-poverty schools than district average — tighter screening recommended.
- Market conditions: Rents rising fast (+4.5%/yr); 266 active listings in the ZIP; 17 comparable units currently listed for rent nearby; rentals at typical pace (median 16d on market — plan ~3-4 weeks tenant-placement turnaround); solid renter incomes; 3,183 units permitted in Berkeley County in 2024 (580 in 5+ unit buildings).
- This rent runs 39% of the median local income ($82k/yr) — at the standard rent-burdened threshold; future hikes will face affordability resistance.
Forward outlook
- Local home prices are declining (-3.0%/yr); year-one equity from $2k of loan paydown is wiped out by about $10k of value loss. Plan a longer hold.
- Berkeley County population projected at +48% by 2050 — long-run rental-demand tailwind backs the buy-and-hold thesis.
Negotiation context
- It's been on market 65 days — a 6% lower offer ($312k) is reasonable based on typical stale-listing flexibility.
- 3 sale attempts since 9y ago; this cycle's ask has dropped $58k (15%) from the opening price — seller is motivated, your offer sets the floor, not the list.
Risks & watch-outs
- Climate carrying-cost: severe wind risk, 99% chance of damaging wind over 30y; moderate wildfire risk; extreme-heat days projected 7→18/yr by 2055 (HVAC capex compounding) — expect insurance premiums to compound above CPI over the hold.
Questions for the listing agent
- It's been on market 65 days. Have you received any prior offers? Is the seller open to a 21% concession, seller financing, or rate buy-down credit?
- What does the HOA fee cover, when was the last increase, and are there any pending special assessments or reserve-fund shortfalls?
- Why hasn't it sold? Are there any deal-killer items the seller is aware of (foundation, flood, title, zoning, code violations)?
- Is there a deadline driving the sale (1031 exchange, divorce, estate, relocation)? That informs how much negotiation room exists.
- The area grade is low — what's the realistic commute time and amenity access for the typical tenant pool here? Any planned neighborhood developments (good or bad) we should know about?
- What's the average days-on-market for RENTAL listings here right now (not sales)? A rising rental-DOM trend means longer vacancies and softer asking-rent achievability than the comps imply.
- What's the recent tenant-quality profile in this submarket — average credit score on applications, eviction rate, late-payment / NSF rate, and stable-employment percentage? A property-management company in the area should have these aggregated.
- How much new for-sale + rental construction is in the pipeline within 1–3 miles? Heavy new supply typically softens prices + rents 12–24 months out; constrained supply supports both.
Investment metrics
- 1% rule
- 0.79% ✗
- Cap rate
- 6.39%
- Cash-on-cash
- 0.34%
- DSCR
- 1.02
- GRM
- 10.5
CMA / ARV
- ARV (on-the-fly)
- $352,804
- Comps found
- 12
Show comp detail 12 sales within ~0.75 mi
| Address | Dist | Beds/Ba | Sqft | Sold | Price | $/sf | Match |
|---|---|---|---|---|---|---|---|
| 402 Pomegranate Dr | 0.20mi | 3/2.0 | 1,777 (-3%) | 2mo | $355,000 | $200 | 85 |
| 186 Daniels Creek Cir | 0.30mi | 4/2.5 (+1) | 1,792 (-2%) | 6mo | $375,000 | $209 | 71 |
| 173 Daniels Creek Cir | 0.28mi | 3/2.5 | 1,988 (+9%) | 3mo | $367,000 | $185 | 68 |
| 171 Daniels Creek Cir | 0.29mi | 3/2.5 | 1,620 (-11%) | 3mo | $345,000 | $213 | 64 |
| 212 Mayfield Dr | 0.61mi | 3/2.0 | 1,914 (+5%) | 1mo | $379,000 | $198 | 63 |
| 211 Daniels Creek Cir | 0.23mi | 4/2.5 (+1) | 2,067 (+13%) | 1mo | $399,000 | $193 | 60 |
| 258 Urbano Ln | 0.45mi | 3/2.5 | 2,041 (+12%) | 5mo | $365,000 | $179 | 53 |
| 149 Salem Creek Dr | 0.55mi | 4/2.5 (+1) | 1,664 (-9%) | 3mo | $300,000 | $180 | 49 |
| 247 Old Carolina Dr | 0.48mi | 4/3.0 (+1) | 2,052 (+12%) | 0mo | $352,000 | $172 | 48 |
| 115 Salem Creek Dr | 0.75mi | 3/2.0 | 1,584 (-13%) | 2mo | $319,000 | $201 | 41 |
| 424 Gianna Ln | 0.71mi | 3/2.5 | 2,066 (+13%) | 4mo | $375,000 | $182 | 40 |
| 400 Watershed Dr | 0.70mi | 4/2.5 (+1) | 2,098 (+15%) | 7mo | $376,000 | $179 | 30 |
Match score weights: distance 35% · size 25% · config 20% · recency 20%. Top-matched comps best support the ARV.
Projected returns pro-forma
-3.0% appreciation · 4.52% rent growth · sell at horizon
- IRR
- -14.3%
- Equity multiple
- 0.48×
- Total profit
- $-48,154
- Equity at exit
- $49,502
- IRR
- -3.5%
- Equity multiple
- 0.75×
- Total profit
- $-22,959
- Equity at exit
- $28,705
Cash invested: $92,960 (down + closing). Projections, not guarantees.
Landlord ↔ Tenant lean methodology
- Overall (STATE)
- 90 Strongly Landlord-Friendly
- State South Carolina
- 90 Strongly Landlord-Friendly · R+6
- County
- — inherits STATE
- City
- — inherits STATE
ZIP-level market 29445
- Home prices YoY
- -18.0%
- Rents YoY
- 4.5%
- Active inventory
- 266
- Price-to-rent
- 10.5×
Monthly cashflow live
- Estimated rent
- $2,627 high interval (Pro) →
- Mortgage (P&I)
- −$1,741
- Tax from tax record
- −$115 /mo · $1,377/yr
- Insurance
- −$138
- HOA
- −$55
- Vacancy / Maint / Mgmt
- −$552
- Net cashflow
- $26
Break-even live
Sensitivity live
| Price | -10% $214 | -5% $120 | +0% $26 | +5% $-68 | +10% $-162 |
|---|---|---|---|---|---|
| Rent | -10% $-181 | -5% $-77 | +0% $26 | +5% $130 | +10% $234 |
| Rate | -1.0pp $194 | -0.5pp $111 | base $26 | +0.5pp $-60 | +1.0pp $-147 |
UW: 25.0% down · 7.5% · 30yr · 1.5% tax · 5.0% vac · 8.0% maint · 8.0% mgmt
Financing live
Cash to close
- Down payment
- $83,000
- Closing costs
- $9,960
- Reserves months
- —
- Total cash needed
- —
Loan-product check · same deal, 3 products live
Conventional
25% down · 7.5% · 30yr
- Down + closing
- —
- Monthly P&I
- —
- Monthly cashflow
- —
- DSCR
- —
- Eligible?
- —
Personal DTI + credit; lowest rate.
DSCR
20% down · 8.5% · 30yr
- Down + closing
- —
- Monthly P&I
- —
- Monthly cashflow
- —
- DSCR
- —
- Eligible?
- —
No personal income docs; deal must DSCR.
Hard money
10% down · 12.0% · 12mo
- Down + closing
- —
- Monthly P&I
- —
- Monthly cashflow
- —
- DSCR
- —
- Eligible?
- —
Short-term bridge; refi at stabilization.
Rent comps 17 comps
| Address | Beds | Baths | Sqft | Rent | $/sqft | DOM | Units | Dist |
|---|---|---|---|---|---|---|---|---|
| 117 Sequoia Ln Goose Creek, SC | 4.0 | 3.0 | 1930 | $2,695 | $1.40 | 12d | 1 | 0.26mi |
| 117 Sequoia Ln Goose Creek, SC | 4.0 | 3.0 | 1930 | $2,695 | $1.40 | 16d | 1 | 0.26mi |
| 141 Hawthorne Landing Dr Goose Creek, SC | 3.0 | 2.5 | 1750 | $2,500 | $1.43 | 25d | 1 | 0.39mi |
| 335 Chapman Cir Goose Creek, SC | 3.0 | 2.5 | 1540 | $2,400 | $1.56 | 5d | 1 | 0.43mi |
| 150 Daniels Creek Cir Goose Creek, SC | 3.0 | 2.0 | 1828 | $2,550 | $1.39 | 12d | 1 | 0.46mi |
| 144 Daniels Creek Cir Goose Creek, SC | 4.0 | 2.5 | 2480 | $2,821 | $1.14 | 13d | 1 | 0.46mi |
| 117 Patterson Ave Goose Creek, SC | 3.0 | 2.5 | 1767 | $2,349 | $1.33 | 25d | 1 | 0.46mi |
| 117 Patterson Ave Goose Creek, SC | 3.0 | 2.5 | 1767 | $2,349 | $1.33 | 16d | 1 | 0.46mi |
| 225 Urbano Ln Goose Creek, SC | 3.0 | 2.5 | 2000 | $5,500 | $2.75 | 25d | 1 | 0.66mi |
| 266 Mayfield Dr Goose Creek, SC | 4.0 | 2.0 | 1980 | $2,450 | $1.24 | 25d | 1 | 0.71mi |
| 531 Brick Barn Ln Goose Creek, SC | 3.0 | 2.0 | 1443 | $2,600 | $1.80 | 25d | 1 | 0.83mi |
| 108 Farm Quarters Dr Goose Creek, SC | 3.0 | 2.0 | 1437 | $2,181 | $1.52 | 16d | 1 | 1.02mi |
| 114 Marinella Dr Goose Creek, SC | 3.0 | 2.0 | 1470 | $2,250 | $1.53 | 23d | 1 | 1.10mi |
| 114 Marinella Dr Goose Creek, SC | 3.0 | 2.0 | 1470 | $2,250 | $1.53 | 25d | 1 | 1.10mi |
| 115 Marinella Dr Goose Creek, SC | 4.0 | 3.0 | 2301 | $2,781 | $1.21 | 13d | 1 | 1.12mi |
| 120 Stall Way Goose Creek, SC | 4.0–5.0 | 2.0–3.0 | 2067 | $2,498 | $1.21 | 16d | 2 | 1.20mi |
| 218 Seth Ct Goose Creek, SC | 3.0 | 2.0 | 1676 | $2,400 | $1.43 | 25d | 1 | 1.41mi |
HOA detail
- Monthly dues
- $55 · $660/yr
Listing history 23 events
-
2026-06-21days on market $332,000 Active 65 DOM
-
2026-06-18days on market $332,000 Active 62 DOM
-
2026-06-17days on market $332,000 Active 61 DOM
-
2026-06-16days on market $332,000 Active 60 DOM
-
2026-06-15days on market $332,000 Active 59 DOM
-
2026-06-13days on market $332,000 Active 57 DOM
-
2026-06-13pricedays on market $332,000 Active 56 DOM
-
2026-06-10days on market $390,000 Active 54 DOM
-
2026-06-09pricedays on market $390,000 Active 53 DOM
-
2026-06-08days on market $350,000 Active 52 DOM
-
2026-06-07pricedays on market $350,000 Active 51 DOM
-
2026-06-05days on market $390,000 Active 48 DOM
-
2026-06-03days on market $390,000 Active 47 DOM
-
2026-06-03days on market $390,000 Active 46 DOM
-
2026-06-01days on market $390,000 Active 45 DOM
-
2026-05-31days on market $390,000 Active 44 DOM
-
2026-05-14price $358,000
-
2026-04-30price $370,000
-
2026-04-17$390,000 Active
Show marketing remark (411 chars)
Welcome to 537 Nandina Dr, a single-family residence with a straightforward, functional layout. The kitchen is equipped with all stainless steel appliances and features an accent backsplash. The primary bathroom includes double sinks. A covered patio extends to a fully fenced backyard. This residence combines modern elements with practical outdoor living.. Included 100-Day Home Warranty with buyer activation
-
2026-04-17$390,000 Active 411-char remark
Show marketing remark (411 chars)
Welcome to 537 Nandina Dr, a single-family residence with a straightforward, functional layout. The kitchen is equipped with all stainless steel appliances and features an accent backsplash. The primary bathroom includes double sinks. A covered patio extends to a fully fenced backyard. This residence combines modern elements with practical outdoor living.. Included 100-Day Home Warranty with buyer activation
-
2026-04-06soldstatus $390,000
-
2017-08-31$263,473 Active
-
2017-08-31soldstatus $263,473 Closed
ⓘ Source: listings_history table (triggers on properties + properties_extension) + one-shot
backfill from property_details.listing_events for pre-trigger history.
Tax reassessment forecast SC · Resets to sale price
- Current annual tax
- $1,377 · $115/mo
- Projected year-2 tax
- $1,892 · $158/mo
- Expected delta
- +$516/yr (+$43/mo · 37.5%)
ⓘ Screening estimate from a state-policy table — verify with the county assessor before closing.
Climate risk First Street
- Flood 1/10 Low FEMA zone X (unshaded) · 0% chance over 30 yrs
- Wildfire 5/10 Major
- Heat 9/10 Extreme 7 d/yr ≥107°F today · 18 d/yr by 30 yrs out
- Wind 8/10 Severe 99% chance of damaging wind over 30 yrs
- Air quality 2/10 Low 2 unhealthy d/yr today · 2 by 30 yrs out
Nearby sold comps map
Loading sold comps map…
Walkable amenities ~0.75 mi
Loading nearby amenities…
Taxation est. · year 1
- Rental income
- $31,526
- − Mortgage interest
- −$18,597
- − Property taxes
- −$1,377
- − Insurance
- −$1,660
- − Repairs & maintenance
- −$2,522
- − Management
- −$2,522
- − HOA
- −$660
- − Depreciation
- −$9,658
- Taxable loss
- −$5,471
- Est. tax savings @ 24.0%
- +$1,313
- After-tax cash flow
- $1,629/yr
For passive investors: Depreciation is non-cash, so a rental often shows a tax loss while cash-flowing — sheltering income. Rental losses are passive: they offset passive income freely, and up to $25,000/yr can offset ordinary (W-2) income if you actively participate and your MAGI is under $100k (phasing out to $0 by $150k); unused losses carry forward. On sale, claimed depreciation is recaptured at up to 25%, and gains may owe capital-gains tax (a 1031 exchange can defer both). Figures are a year-1 estimate at your 24.0% rate — not tax advice; consult a CPA.
Schools (NCES district)
- District
- Berkeley 01
- NCES district ID
- 4501170
- Math proficiency
- 35% ▼ -8.00%
- Reading proficiency
- 48% ▼ -2.00%
- Median HH income
- $52,724
- Composite
- 35.95/100
- National rank
- #4799
- State rank
- #30 of 80 in SC
Livability — Goose Creek
- Score
- 67/100
- State rank
- #103
- US rank
- #10912
Category grades
Schools grade is shown separately in the Schools card above.
Census & demographics
- Census place
- Goose Creek, SC
- County
- Berkeley County · 198,768 people
- City population
- 59,227
- Metro
- Charleston-North Charleston, SC
- Population (ZIP)
- 59,227
- Household income
- $81,594
- Rent vs Own
- Severe rent burden
- 1308.0
Population outlook (Berkeley County) Hauer SSP2
- Today (2025)
- 254,184 people
- By 2030
- 279,677 · +10.0%
- By 2040
- 329,379 · +29.6%
- By 2050
- 375,557 · +47.8%
- By 2075
- 476,740 · +87.6%
- By 2100
- 535,945 · +110.8%
Race, ethnicity, and origin ACS 2023
- Neighborhood character
- Diverse neighborhood (Simpson 0.63)
- Race & ethnicity
- White 55% Black 23% Hispanic / Latino 11% Two or more races 9% Asian 3%
- Hispanic origin (detail)
- Mexican 4% Puerto Rican 3%
- Common ancestry
- Slovak 2% Lithuanian 2% Italian 1%
- Foreign-born
- 9% · Canada, Jamaica, Vietnam
- Languages at home
- 86% English-only · Spanish 8% Other Indo-European 2% Tagalog/Filipino 2%
Political lean MEDSL · Berkeley
- 2024 margin
- R (+16.3) · D 41.1% · R 57.4% · Other 1.4%
- 2008→2024 swing
- -3.2pp toward R · 2008: -13.1pp · 2024: -16.3pp
- All cycles
- 2024: R+16.3 2020: R+11.7 2016: R+17.4 2012: R+18.9 2008: R+13.1
Not yet ingested
- Civics
- —
Market trends
- HPI YoY
- ▼ -66.40%
- Current HPI
- 301.8653
- Rent YoY
- ▲ 4.52%
- Metro
- Charleston-North Charleston, SC
- State GDP YoY
- ▲ 4.51%
- F500 in state
- 2
Industry mix (Fortune 500 HQ in SC)
| Industry | F500 HQs | Revenue |
|---|---|---|
| Packaging | 1 | $7B |
|
||
Price history
+35.9% since first listed7 events — show timeline
- 2026-05-14 Price Changed $358,000 Charleston Trident MLS
- 2026-04-30 Price Changed $370,000 Charleston Trident MLS
- 2026-04-17 Listed $390,000 Charleston Trident MLS
- 2026-04-17 Listed $390,000 Charleston Trident MLS
- 2026-04-06 Sold (Public Records) $390,000 Public Records
- 2017-08-31 Listed $263,473 Charleston Trident MLS
- 2017-08-31 Sold (MLS) $263,473 Charleston Trident MLS
Property tax history
+57.4%/yrLatest (2025): $1,377 · +1.8% YoY. Source: county tax records.
Cash-flow waterfall
monthlySold comps — $/sqft
last 12 mo · ≤1 miLoading sold comps…