100 E Lyle St · Milford, IL
Flood risk 1/10 · Minimal
- FEMA flood zone
- X (unshaded)
- Chance of flooding over 30 yrs
- 0.0%
- Est. flood insurance / yr
- $473 – $860
Fire risk 1/10 · Minimal
- Est. fire insurance / yr
- $804 – $1,492
Heat risk 3/10 · Minor
- Hot days now (above 104°F)
- 7 days/yr
- Hot days in 30 yrs
- 17 days/yr
Wind risk 2/10 · Minimal
- Chance of severe wind over 30 yrs
- 1.0%
Air-quality risk 2/10 · Minimal
- Unhealthy air days now
- 1 days/yr
- Unhealthy air days in 30 yrs
- 1 days/yr
Risk factors via First Street. Map © Google.
Why this score? — see what drove the D- grade
The composite is a weighted blend of 9 inputs, each scored 0–100. Each bar is that input's sub-score; the figure is the points it added to the 100-point composite (weight × sub-score).
- Cash flow +11.6/30.0
- Appreciation +5.9/10.0
- ARV discount +3.6/15.0
- DSCR +3.4/10.0
- 1% rule +3.3/10.0
- Livability +3.1/5.0
- Rent growth +2.5/5.0
- Condition / age +2.5/5.0
- Schools +2.4/10.0
$130,000
🖨 Deal sheet 📄 Offer letter ✓ Due diligence
Listing remarks
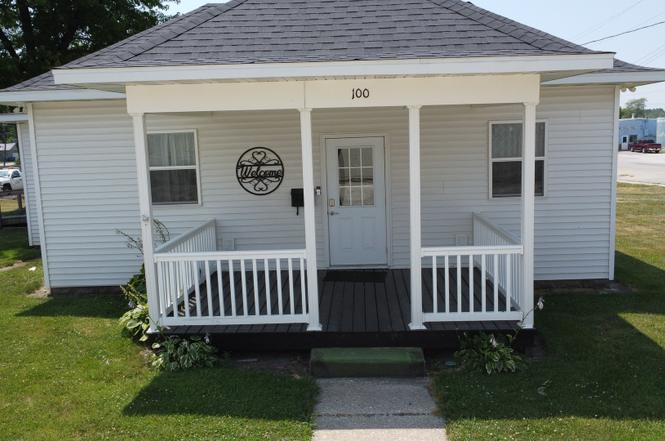
Charming, move-in ready ranch offering 1,494 sq ft of beautifully updated living space. This 2-bedroom, 1-bath home sits on a generous 99' x 132' lot and features a new roof, siding, windows, kitchen, bathroom, and flooring. The stylish, open layout includes a bright living room with fresh finishes, a crisp white kitchen with stainless steel appliances, and a warm bonus room with wood accents and a fireplace. A front porch adds curb appeal while the spacious backyard offers room to roam. Enjoy the ease of single-level living in a thoughtfully renovated home near the heart of Milford.
Key facts
- New kitchen
- New siding
- New bathroom
Tags
Property features AI
Finance
- Other: Property is not currently leased; Total finished/unfinshed area reported about 1,994 (main finished area listed separately)
- HOA & community: No master association fee required
Exterior
- Parking: Attached garage (garage owned); Gravel parking; One garage parking space (one total parking space)
- Utilities: Public water; Public sewer; Electric service with circuit breakers
- Home design: Detached single-family home; One-story layout; Fee simple ownership; Over 100 years old
- Construction: Vinyl siding; Asphalt roof; Block foundation; Built before 1978
- Exterior features: Corner lot; Lot dimensions approximately 100 x 132; Lot size roughly 0.25–0.49 acre
Interior
- Kitchen: Main-level kitchen (11 x 14)
- Bedrooms: Two bedrooms (both on the main level); Master bedroom on the main level (12 x 17); Second bedroom on the main level (10 x 15)
- Flooring: Wood laminate flooring throughout main living areas
- Bathrooms: One full bathroom
- Heating & cooling: Natural gas heating; Central air conditioning
- Interior features: Six total rooms; Unfinished partial basement (about 500 finished/unfin. basement area noted separately)
- Laundry & utility: Main-level laundry room (10 x 10)
Neighborhood map
What this means for you Summary
Snapshot
- This is a 2-bed/1.0-bath single-family listed at $130k.
Deal economics
- At list price, monthly cash flow is $-41 ($-498/yr) — negative.
- To cash-flow at today's rent, offer at most $123k (5.6% below list).
- To meet the 1% rule (rent ≥ 1% of price), the offer needs to be $107k (17.5% below list).
- Recommended offer: $107k (17.5% below list) — sets the bar for 1% rule.
Location & tenants
- Location reads 62/100 on livability (#854 in IL) — a middle-class / working-renter tenant base. Strengths: cost of living A+, crime A, housing A-; Watch: employment D, schools D-, amenities F.
- Milford Area PSD 124 (rural): math 30% / reading 26% proficiency, ranked #278 of 620 in IL (top 45%) — low school quality limits family demand, transient renter base, plan for 1-2y turnover.
- Market conditions: 10 active listings in the ZIP; 14 units permitted in Iroquois County in 2024 (0 in 5+ unit buildings).
Forward outlook
- In year one you build about $3k of equity ($899 loan paydown + $2k appreciation (1.9% local appreciation)).
- Iroquois County population projected at -20% by 2050 — secular population decline; favor cash flow + early exit over multi-decade hold.
- At projected returns (1.9% appreciation + 3.0% rent growth), your $36k cash investment doubles in ~9 years — after that, you're playing with house money.
- By year 10, paydown + projected appreciation supports a ~$33k cash-out refi (75% LTV) — recoverable capital for the next deal without selling this one.
Negotiation context
- It's been on market 331 days — a 12% lower offer ($114k) is reasonable based on typical stale-listing flexibility.
- Current owner paid $30k; list at $130k implies a 329% gain — meaningful room to come down on a strong offer.
Risks & watch-outs
- Watch-outs: built in 1895 — expect roof / HVAC / electrical / plumbing capex.
Questions for the listing agent
- What do current leases actually rent for vs. the listed asking? Can we see a recent rent roll and the last 12 months of T-12 income?
- It's been on market 331 days. Have you received any prior offers? Is the seller open to a 17% concession, seller financing, or rate buy-down credit?
- Built in 1895 — when were the roof, HVAC, electrical panel, plumbing, and water heater last replaced?
- Why hasn't it sold? Are there any deal-killer items the seller is aware of (foundation, flood, title, zoning, code violations)?
- Is there a deadline driving the sale (1031 exchange, divorce, estate, relocation)? That informs how much negotiation room exists.
- Schools are D-rated, which usually means shorter tenancies and higher turnover. Who's the typical renter profile here, and what's been the actual vacancy rate?
- The area grade is low — what's the realistic commute time and amenity access for the typical tenant pool here? Any planned neighborhood developments (good or bad) we should know about?
- What's the average days-on-market for RENTAL listings here right now (not sales)? A rising rental-DOM trend means longer vacancies and softer asking-rent achievability than the comps imply.
- What's the recent tenant-quality profile in this submarket — average credit score on applications, eviction rate, late-payment / NSF rate, and stable-employment percentage? A property-management company in the area should have these aggregated.
- How much new for-sale + rental construction is in the pipeline within 1–3 miles? Heavy new supply typically softens prices + rents 12–24 months out; constrained supply supports both.
Investment metrics
- 1% rule
- 0.83% ✗
- Cap rate
- 5.91%
- Cash-on-cash
- -1.37%
- DSCR
- 0.94
- GRM
- 10.1
CMA / ARV
- ARV (on-the-fly)
- $119,520
- Comps found
- 4
Show comp detail 4 sales within ~0.75 mi
| Address | Dist | Beds/Ba | Sqft | Sold | Price | $/sf | Match |
|---|---|---|---|---|---|---|---|
| 115 N Axtel Ave | 0.15mi | 3/2.0 (+1) | 1,603 (+7%) | 12mo | $285,000 | $178 | 61 |
| 212 W Mckinley St | 0.46mi | 2/1.0 | 1,303 (-13%) | 3mo | $102,500 | $79 | 55 |
| 223 N Walnut St | 0.38mi | 3/1.5 (+1) | 1,377 (-8%) | 12mo | $110,000 | $80 | 52 |
| 206 N Grant St | 0.26mi | 3/2.0 (+1) | 1,360 (-9%) | 18mo | $30,000 | $22 | 49 |
Match score weights: distance 35% · size 25% · config 20% · recency 20%. Top-matched comps best support the ARV.
Projected returns pro-forma
1.87% appreciation · 3.0% rent growth · sell at horizon
- IRR
- 2.8%
- Equity multiple
- 1.15×
- Total profit
- $5,420
- Equity at exit
- $50,359
- IRR
- 6.7%
- Equity multiple
- 1.91×
- Total profit
- $32,952
- Equity at exit
- $71,821
Cash invested: $36,400 (down + closing). Projections, not guarantees.
Landlord ↔ Tenant lean methodology
- Overall (STATE)
- 43 Moderately Tenant-Leaning
- State Illinois
- 43 Moderately Tenant-Leaning · D+7
- County
- — inherits STATE
- City
- — inherits STATE
ZIP-level market 60953
- Home prices YoY
- 1.2%
- Active inventory
- 10
- Price-to-rent
- 10.1×
Monthly cashflow live
- Estimated rent
- $1,073 medium interval (Pro) →
- Mortgage (P&I)
- −$682
- Tax from tax record
- −$153 /mo · $1,837/yr
- Insurance
- −$54
- HOA
- −$0
- Vacancy / Maint / Mgmt
- −$225
- Net cashflow
- $-41
Break-even live
UW: 25.0% down · 7.5% · 30yr · 1.5% tax · 5.0% vac · 8.0% maint · 8.0% mgmt
Financing live
Cash to close
- Down payment
- $32,500
- Closing costs
- $3,900
- Reserves months
- —
- Total cash needed
- —
Loan-product check · same deal, 3 products live
Conventional
25% down · 7.5% · 30yr
- Down + closing
- —
- Monthly P&I
- —
- Monthly cashflow
- —
- DSCR
- —
- Eligible?
- —
Personal DTI + credit; lowest rate.
DSCR
20% down · 8.5% · 30yr
- Down + closing
- —
- Monthly P&I
- —
- Monthly cashflow
- —
- DSCR
- —
- Eligible?
- —
No personal income docs; deal must DSCR.
Hard money
10% down · 12.0% · 12mo
- Down + closing
- —
- Monthly P&I
- —
- Monthly cashflow
- —
- DSCR
- —
- Eligible?
- —
Short-term bridge; refi at stabilization.
Listing history 21 events
-
2026-06-18days on market $130,000 Active 331 DOM
-
2026-06-17days on market $130,000 Active 330 DOM
-
2026-06-16days on market $130,000 Active 329 DOM
-
2026-06-15days on market $130,000 Active 328 DOM
-
2026-06-14price $130,000 Active 326 DOM
-
2026-06-13days on market $169,900 Active 326 DOM
-
2026-06-12days on market $169,900 Active 325 DOM
-
2026-06-09days on market $169,900 Active 322 DOM
-
2026-06-08days on market $169,900 Active 321 DOM
-
2026-06-07days on market $169,900 Active 320 DOM
-
2026-06-05days on market $169,900 Active 318 DOM
-
2026-06-04days on market $169,900 Active 316 DOM
-
2026-06-02days on market $169,900 Active 315 DOM
-
2026-06-01days on market $169,900 Active 314 DOM
-
2026-05-31days on market $169,900 Active 313 DOM
-
2026-05-31days on market $169,900 Active 312 DOM
-
2026-01-15price $169,900
-
2025-09-29price $179,900
-
2025-07-22$189,900 Active
-
2018-11-16soldstatus $30,302
-
2009-02-01soldstatus $40,000
ⓘ Source: listings_history table (triggers on properties + properties_extension) + one-shot
backfill from property_details.listing_events for pre-trigger history.
Tax reassessment forecast IL · Partial reset (capped growth)
- Current annual tax
- $1,837 · $153/mo
- Projected year-2 tax
- $2,394 · $199/mo
- Expected delta
- +$557/yr (+$46/mo · 30.3%)
ⓘ Screening estimate from a state-policy table — verify with the county assessor before closing.
Climate risk First Street
- Flood 1/10 Low FEMA zone X (unshaded) · 0% chance over 30 yrs
- Wildfire 1/10 Low
- Heat 3/10 Moderate 7 d/yr ≥104°F today · 17 d/yr by 30 yrs out
- Wind 2/10 Low 100% chance of damaging wind over 30 yrs
- Air quality 2/10 Low 1 unhealthy d/yr today · 1 by 30 yrs out
Nearby sold comps map
Loading sold comps map…
Walkable amenities ~0.75 mi
Loading nearby amenities…
Taxation est. · year 1
- Rental income
- $12,873
- − Mortgage interest
- −$7,282
- − Property taxes
- −$1,837
- − Insurance
- −$650
- − Repairs & maintenance
- −$1,030
- − Management
- −$1,030
- − Depreciation
- −$3,782
- Taxable loss
- −$2,737
- Est. tax savings @ 24.0%
- +$657
- After-tax cash flow
- $159/yr
For passive investors: Depreciation is non-cash, so a rental often shows a tax loss while cash-flowing — sheltering income. Rental losses are passive: they offset passive income freely, and up to $25,000/yr can offset ordinary (W-2) income if you actively participate and your MAGI is under $100k (phasing out to $0 by $150k); unused losses carry forward. On sale, claimed depreciation is recaptured at up to 25%, and gains may owe capital-gains tax (a 1031 exchange can defer both). Figures are a year-1 estimate at your 24.0% rate — not tax advice; consult a CPA.
Schools (NCES district)
- District
- Milford Area PSD 124
- NCES district ID
- 1701416
- Math proficiency
- 30% ▲ 2.00%
- Reading proficiency
- 26% ▼ -11.00%
- Median HH income
- $44,333
- Composite
- 24.03/100
- National rank
- #7767
- State rank
- #278 of 620 in IL
Livability — Milford
- Score
- 62/100
- State rank
- #854
- US rank
- #16734
Category grades
Schools grade is shown separately in the Schools card above.
Census & demographics
- Census place
- Milford, IL
- City population
- 2,141
- Population (ZIP)
- 2,141
Population outlook (Iroquois County) Hauer SSP2
- Today (2025)
- 26,826 people
- By 2030
- 25,771 · -3.9%
- By 2040
- 23,589 · -12.1%
- By 2050
- 21,523 · -19.8%
- By 2075
- 17,998 · -32.9%
- By 2100
- 14,979 · -44.2%
Race, ethnicity, and origin ACS 2023
- Neighborhood character
- Predominantly White (98%)
- Race & ethnicity
- White 98% Hispanic / Latino 2%
- Common ancestry
- Lithuanian 2% Italian 2% Iranian 2%
- Foreign-born
- 2%
Political lean MEDSL · Iroquois
- 2024 margin
- Solid R (+57.3) · D 20.6% · R 78.0% · Other 1.4%
- 2008→2024 swing
- -27.5pp toward R · 2008: -29.8pp · 2024: -57.3pp
- All cycles
- 2024: R+57.3 2020: R+56.7 2016: R+56.0 2012: R+44.7 2008: R+29.8
Not yet ingested
- Civics
- —
Market trends
- HPI YoY
- ▲ 1.87%
- Current HPI
- 156.755
- Rent YoY
- —
- Metro
- —
- State GDP YoY
- ▲ 1.59%
- F500 in state
- 60
Industry mix (Fortune 500 HQ in IL)
| Industry | F500 HQs | Revenue |
|---|---|---|
| Insurance | 4 | $201B |
|
||
| Consumer Goods | 4 | $87B |
|
||
| Industrial Machinery | 3 | $64B |
|
||
| Healthcare | 2 | $55B |
|
||
| Retail / Pharmacy | 1 | $148B |
|
||
| Agriculture / Food | 1 | $86B |
|
||
Price history
+324.8% since first listed5 events — show timeline
- 2026-01-15 Price Changed $169,900 MRED as Distributed by MLS Grid
- 2025-09-29 Price Changed $179,900 MRED as Distributed by MLS Grid
- 2025-07-22 Listed $189,900 MRED as Distributed by MLS Grid
- 2018-11-16 Sold (Public Records) $30,302 Public Records
- 2009-02-01 Sold (Public Records) $40,000 Public Records
Property tax history
+9.9%/yrLatest (2024): $1,837 · +11.9% YoY. Source: county tax records.
Cash-flow waterfall
monthlySold comps — $/sqft
last 12 mo · ≤1 miLoading sold comps…