 Duplex
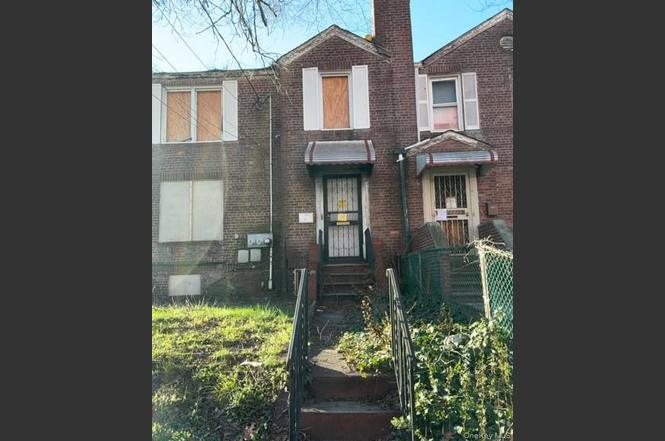
19514 Hollis Ave · New York, NY
Flood risk 6/10 · Moderate
- FEMA flood zone
- X (unshaded)
- Chance of flooding over 30 yrs
- 0.73%
- Est. flood insurance / yr
- $507 – $1,088
Fire risk 1/10 · Minimal
- Est. fire insurance / yr
- $691 – $1,283
Heat risk 6/10 · Moderate
- Hot days now (above 97°F)
- 7 days/yr
- Hot days in 30 yrs
- 15 days/yr
Wind risk 6/10 · Moderate
- Chance of severe wind over 30 yrs
- 54.0%
Air-quality risk 4/10 · Minor
- Unhealthy air days now
- 6 days/yr
- Unhealthy air days in 30 yrs
- 6 days/yr
Risk factors via First Street. Map © Google.
Why this score? — see what drove the B- grade
The composite is a weighted blend of 9 inputs, each scored 0–100. Each bar is that input's sub-score; the figure is the points it added to the 100-point composite (weight × sub-score).
- Cash flow +24.6/30.0
- ARV discount +15.0/15.0
- DSCR +7.9/10.0
- 1% rule +5.9/10.0
- Schools +5.0/10.0
- Livability +3.8/5.0
- Rent growth +2.5/5.0
- Condition / age +2.5/5.0
- Appreciation +0.0/10.0
$572,000
🖨 Deal sheet 📄 Offer letter ✓ Due diligence
Multi-family units
County records classify this as Multi-Family (2-4 Unit). Listing-text estimate: 2 units. confirmed
Listing remarks
Semi detached corner brick two family in poor condition. Fire damaged, no interior access . Please verify all info
Key facts
- 7,980 sq ft lot
- Garage
- Built 1920
Neighborhood map
What this means for you Summary
Snapshot
- This is a 2 × 2-bed/1.0-bath units multifamily listed at $572k.
Deal economics
- At list price, monthly cash flow is $1k ($14k/yr) — positive. Per door: $590/mo.
- The deal already cash-flows at list — no discount required.
- Meets the 1% rule at list price ($6k rent vs $572k).
- Recommended offer: $555k (3.0% below list) — sets the bar for market timing.
- Cap rate 8.8% vs local median 2.6% in New York — top-decile yield for the area; either an underpriced asset or a hidden risk that comps aren't pricing in. Stress-test before assuming the spread holds.
Location & tenants
- Location reads 75/100 on livability (#268 in NY, #4,188 nationally) — a middle-class / working-renter tenant base. Strengths: amenities A+, commute A+, health & safety A; Watch: crime F, cost of living F.
- Market conditions: 145 active listings in the ZIP; 16 comparable units currently listed for rent nearby; rentals at typical pace (median 25d on market — plan ~3-4 weeks tenant-placement turnaround); 5,302 units permitted in Queens County in 2024 (4,918 in 5+ unit buildings).
Forward outlook
- Local home prices are declining (-3.0%/yr); year-one equity from $4k of loan paydown is wiped out by about $17k of value loss. Plan a longer hold.
- Queens County population projected at +16% by 2050 — long-run rental-demand tailwind backs the buy-and-hold thesis.
Negotiation context
- It's been on market 44 days — a 3% lower offer ($555k) is reasonable based on typical stale-listing flexibility.
- 2 sale attempts since 13y ago with the ask held roughly flat each time — persistent listings suggest the price (not the market) is what's stuck; bring a comps-based counter.
- Current owner paid $192k; list at $572k implies a 198% gain — meaningful room to come down on a strong offer.
Risks & watch-outs
- Watch-outs: built in 1920 — expect roof / HVAC / electrical / plumbing capex.
- Climate carrying-cost: major flood risk; major wind risk, 54% chance of damaging wind over 30y; extreme-heat days projected 7→15/yr by 2055 (HVAC capex compounding) — expect insurance premiums to compound above CPI over the hold.
Questions for the listing agent
- It's been on market 44 days. Have you received any prior offers? Is the seller open to a 3% concession, seller financing, or rate buy-down credit?
- Can we see the unit-by-unit rent roll, current vacancy, and any below-market leases? What's the average tenancy length?
- What capital expenditures (roof, boiler, parking lot, exteriors) have been made in the last 5 years, and what's planned in the next 2?
- Built in 1920 — when were the roof, HVAC, electrical panel, plumbing, and water heater last replaced?
- Is there a deadline driving the sale (1031 exchange, divorce, estate, relocation)? That informs how much negotiation room exists.
- Schools are B-rated — typically a magnet for longer-tenancy family renters. What's the average tenant stay here, and is there a school-zone premium baked into asking?
- Crime grade is F in this area — have there been break-ins, vandalism, or insurance claims at this property in the last 3 years? What carrier currently insures it and at what premium?
- What's the average days-on-market for RENTAL listings here right now (not sales)? A rising rental-DOM trend means longer vacancies and softer asking-rent achievability than the comps imply.
- What's the recent tenant-quality profile in this submarket — average credit score on applications, eviction rate, late-payment / NSF rate, and stable-employment percentage? A property-management company in the area should have these aggregated.
- How much new apartment / multifamily construction is in the pipeline within 1–3 miles? Heavy new supply (>2% of stock underway) typically softens rents 12–24 months out; light construction supports rent growth.
Investment metrics
- 1% rule
- 1.09% ✓
- Cap rate
- 8.77%
- Cash-on-cash
- 8.85%
- DSCR
- 1.39
- GRM
- 7.7
CMA / ARV
- ARV (on-the-fly)
- $911,520
- Comps found
- 5
Show comp detail 5 sales within ~0.75 mi
| Address | Dist | Beds/Ba | Sqft | Sold | Price | $/sf | Match |
|---|---|---|---|---|---|---|---|
| 19514 Hollis Ave | 0.00mi | 5/2.0 (+1) | 2,109 (-2%) | 0mo | $572,000 | $271 | 91 |
| 10961 200th St | 0.28mi | 5/4.0 (+1) | 2,070 (-4%) | 10mo | $1,100,000 | $531 | 58 |
| 195-02 Hollis Ave | 0.03mi | 3/3.0 (-1) | 1,932 (-11%) | 18mo | $665,000 | $344 | 57 |
| 18803 Ilion Ave | 0.45mi | 5/2.0 (+1) | 2,370 (+10%) | 9mo | $999,000 | $422 | 50 |
| 112-35 Francis Lewis Blvd | 0.72mi | 4/2.5 | 1,848 (-14%) | 10mo | $890,000 | $482 | 32 |
Match score weights: distance 35% · size 25% · config 20% · recency 20%. Top-matched comps best support the ARV.
Projected returns pro-forma
-3.0% appreciation · 3.0% rent growth · sell at horizon
- IRR
- -2.9%
- Equity multiple
- 0.89×
- Total profit
- $-17,529
- Equity at exit
- $85,287
- IRR
- 6.8%
- Equity multiple
- 1.51×
- Total profit
- $81,395
- Equity at exit
- $49,456
Cash invested: $160,160 (down + closing). Projections, not guarantees.
Landlord ↔ Tenant lean methodology
- Overall (CITY)
- 0 Strongly Tenant-Friendly
- State New York
- 15 Strongly Tenant-Friendly · D+10
- County
- — inherits STATE
- City New York
- 0 Strongly Tenant-Friendly · D+34
ZIP-level market 11412
- Active inventory
- 145
- Price-to-rent
- 15.3×
Monthly cashflow live
- Estimated rent
- $6,215 high interval (Pro) →
- Mortgage (P&I)
- −$3,000
- Tax from tax record
- −$491 /mo · $5,893/yr
- Insurance
- −$238
- HOA
- −$0
- Vacancy / Maint / Mgmt
- −$1,305
- Net cashflow
- $1,181
Break-even live
2-unit breakdown (identical units grouped — click to expand)
| Units | Beds | Baths | Est. rent |
|---|---|---|---|
| 2× units | 2 | 1 | $6,214 |
| #1 | 2 | 1 | $3,107 |
| #2 | 2 | 1 | $3,107 |
| Total (2 units) | $6,215 | ||
UW: 25.0% down · 7.5% · 30yr · 1.5% tax · 5.0% vac · 8.0% maint · 8.0% mgmt
Financing live
Cash to close
- Down payment
- $143,000
- Closing costs
- $17,160
- Reserves months
- —
- Total cash needed
- —
Loan-product check · same deal, 3 products live
Conventional
25% down · 7.5% · 30yr
- Down + closing
- —
- Monthly P&I
- —
- Monthly cashflow
- —
- DSCR
- —
- Eligible?
- —
Personal DTI + credit; lowest rate.
DSCR
20% down · 8.5% · 30yr
- Down + closing
- —
- Monthly P&I
- —
- Monthly cashflow
- —
- DSCR
- —
- Eligible?
- —
No personal income docs; deal must DSCR.
Hard money
10% down · 12.0% · 12mo
- Down + closing
- —
- Monthly P&I
- —
- Monthly cashflow
- —
- DSCR
- —
- Eligible?
- —
Short-term bridge; refi at stabilization.
Rent comps 16 comps
| Address | Beds | Baths | Sqft | Rent | $/sqft | DOM | Units | Dist |
|---|---|---|---|---|---|---|---|---|
| 10031 200th St Hollis, NY | 3.0 | 2.0 | 2691 | $3,000 | $1.11 | 5d | 1 | 0.31mi |
| 205-11 Hollis Ave Unit 2nd Queens, NY | 3.0 | 1.0 | 2020 | $3,777 | $1.87 | 24d | 1 | 0.50mi |
| 10933 Francis Lewis Blvd Queens Village, NY | 3.0 | 1.5 | 1492 | $4,000 | $2.68 | 24d | 1 | 0.58mi |
| 191-28 114th Dr Unit 1 St. Albans, NY | 3.0 | 2.0 | 1767 | $3,150 | $1.78 | 24d | 1 | 0.64mi |
| 9050 Francis Lewis Blvd Queens Village, NY | 3.0 | 1.5 | 2396 | $3,000 | $1.25 | 4d | 1 | 0.80mi |
| 177-47 106th Ave Unit First floor Jamaica, NY | 3.0 | 1.0 | 1600 | $3,300 | $2.06 | 14d | 1 | 0.93mi |
| 17724 106th Ave Jamaica, NY | 3.0 | 1.0 | 1600 | $3,500 | $2.19 | 24d | 1 | 0.96mi |
| 20207 Linden Blvd Saint Albans, NY | 3.0 | 1.0 | 1584 | $3,400 | $2.15 | 24d | 1 | 0.97mi |
| 8679 Palo Alto St Hollis, NY | 4.0 | 3.0 | 2310 | $5,500 | $2.38 | 24d | 1 | 1.05mi |
| 9055 178th St Jamaica, NY | 3.0 | 1.0 | 1664 | $3,500 | $2.10 | 24d | 1 | 1.15mi |
| 11542 175th St Unit 2 Queens, NY | 4.0 | 2.0 | 1650 | $4,200 | $2.55 | 24d | 1 | 1.29mi |
| 175-44 88th Ave Jamaica, NY | 4.0 | 1.5 | 1850 | $4,550 | $2.46 | 3d | 1 | 1.29mi |
| 12032 201st St Saint Albans, NY | 3.0 | 2.0 | 2650 | $3,500 | $1.32 | 24d | 1 | 1.31mi |
| 21923 114th Rd Cambria Heights, NY | 3.0 | 1.0 | 2200 | $3,600 | $1.64 | 4d | 1 | 1.34mi |
| 18015 Dalny Rd Jamaica, NY | 3.0 | 3.5 | 2112 | $5,000 | $2.37 | 24d | 1 | 1.35mi |
| 16847 93rd Ave Jamaica, NY | 3.0 | 1.5 | 1948 | $2,900 | $1.49 | 24d | 1 | 1.46mi |
Listing history 6 events
-
2026-03-20status Pending
-
2026-02-07price $572,000
-
2026-02-04$555,720 Active
-
2013-09-12historical
-
2013-08-17$325,000 New
-
2000-10-04soldstatus $192,000
ⓘ Source: listings_history table (triggers on properties + properties_extension) + one-shot
backfill from property_details.listing_events for pre-trigger history.
Tax reassessment forecast NY · Partial reset (capped growth)
- Current annual tax
- $5,893 · $491/mo
- Projected year-2 tax
- $7,780 · $648/mo
- Expected delta
- +$1,887/yr (+$157/mo · 32.0%)
ⓘ Screening estimate from a state-policy table — verify with the county assessor before closing.
Climate risk First Street
- Flood 6/10 Major FEMA zone X (unshaded) · 73% chance over 30 yrs
- Wildfire 1/10 Low
- Heat 6/10 Major 7 d/yr ≥97°F today · 15 d/yr by 30 yrs out
- Wind 6/10 Major 54% chance of damaging wind over 30 yrs
- Air quality 4/10 Moderate 6 unhealthy d/yr today · 6 by 30 yrs out
Nearby sold comps map
Loading sold comps map…
Walkable amenities ~0.75 mi
Loading nearby amenities…
Taxation est. · year 1
- Rental income
- $74,580
- − Mortgage interest
- −$32,041
- − Property taxes
- −$5,893
- − Insurance
- −$2,860
- − Repairs & maintenance
- −$5,966
- − Management
- −$5,966
- − Depreciation
- −$16,640
- Taxable income
- $5,213
- Est. tax owed @ 24.0%
- −$1,251
- After-tax cash flow
- $12,918/yr
For passive investors: Depreciation is non-cash, so a rental often shows a tax loss while cash-flowing — sheltering income. Rental losses are passive: they offset passive income freely, and up to $25,000/yr can offset ordinary (W-2) income if you actively participate and your MAGI is under $100k (phasing out to $0 by $150k); unused losses carry forward. On sale, claimed depreciation is recaptured at up to 25%, and gains may owe capital-gains tax (a 1031 exchange can defer both). Figures are a year-1 estimate at your 24.0% rate — not tax advice; consult a CPA.
Schools (NCES district)
No district data.
Livability — New York
- Score
- 75/100
- State rank
- #268
- US rank
- #4188
Category grades
Schools grade is shown separately in the Schools card above.
Census & demographics
- Census place
- New York, NY
- City population
- 7,731,280
- Population (ZIP)
- 41,350
Population outlook (Queens County) Hauer SSP2
- Today (2025)
- 2,546,320 people
- By 2030
- 2,643,059 · +3.8%
- By 2040
- 2,815,563 · +10.6%
- By 2050
- 2,944,423 · +15.6%
- By 2075
- 3,123,338 · +22.7%
- By 2100
- 3,098,688 · +21.7%
Race, ethnicity, and origin ACS 2023
- Neighborhood character
- Predominantly Black (78%)
- Race & ethnicity
- Black 78% Hispanic / Latino 9% Two or more races 5% Asian 4% White 1%
- Hispanic origin (detail)
- Puerto Rican 3% Dominican 2%
- Common ancestry
- Hispanic 7%
- Foreign-born
- 42% · Canada
- Languages at home
- 82% English-only · French/Haitian/Cajun 6% Spanish 6% Other Indo-European 3%
Political lean MEDSL · Queens
- 2024 margin
- Strong D (+24.6) · D 62.3% · R 37.7%
- 2008→2024 swing
- -26.2pp toward R · 2008: 50.8pp · 2024: 24.6pp
- All cycles
- 2024: D+24.6 2020: D+45.2 2016: D+53.4 2012: D+58.5 2008: D+50.8
Not yet ingested
- Civics
- —
Market trends
- HPI YoY
- ▼ -413.59%
- Current HPI
- 302.063
- Rent YoY
- —
- Metro
- —
- State GDP YoY
- ▲ 2.60%
- F500 in state
- 92
Industry mix (Fortune 500 HQ in NY)
| Industry | F500 HQs | Revenue |
|---|---|---|
| Financial Services | 10 | $950B |
|
||
| Consumer Goods | 9 | $162B |
|
||
| Insurance | 4 | $225B |
|
||
| Telecommunications | 2 | $144B |
|
||
| Pharmaceuticals | 2 | $112B |
|
||
| Media / Entertainment | 2 | $69B |
|
||
Price history
+197.9% since first listed6 events — show timeline
- 2026-03-20 Pending — OneKey® MLS as Distributed by MLS Grid
- 2026-02-07 Price Changed $572,000 OneKey® MLS as Distributed by MLS Grid
- 2026-02-04 Listed $555,720 OneKey® MLS as Distributed by MLS Grid
- 2013-09-12 Listing Removed — OneKey® MLS as Distributed by MLS Grid
- 2013-08-17 Listed $325,000 OneKey® MLS as Distributed by MLS Grid
- 2000-10-04 Sold (Public Records) $192,000 Public Records
Property tax history
+5.3%/yrLatest (2025): $5,893 · -1.7% YoY. Source: county tax records.
Cash-flow waterfall
monthlySold comps — $/sqft
last 12 mo · ≤1 miLoading sold comps…