 Duplex
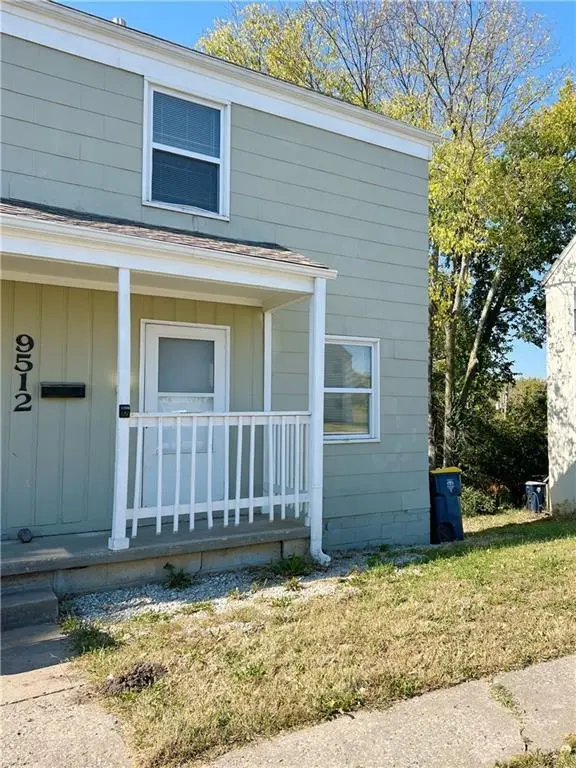
9512 Charlotte St · Kansas City, MO
Flood risk 1/10 · Minimal
- FEMA flood zone
- X (unshaded)
- Chance of flooding over 30 yrs
- 0.0%
- Est. flood insurance / yr
- $507 – $1,088
Fire risk 1/10 · Minimal
- Est. fire insurance / yr
- $1,054 – $1,958
Heat risk 4/10 · Minor
- Hot days now (above 107°F)
- 7 days/yr
- Hot days in 30 yrs
- 17 days/yr
Wind risk 2/10 · Minimal
- Chance of severe wind over 30 yrs
- —
Air-quality risk 3/10 · Minor
- Unhealthy air days now
- 2 days/yr
- Unhealthy air days in 30 yrs
- 4 days/yr
Risk factors via First Street. Map © Google.
Why this score? — see what drove the C- grade
The composite is a weighted blend of 9 inputs, each scored 0–100. Each bar is that input's sub-score; the figure is the points it added to the 100-point composite (weight × sub-score).
- Cash flow +20.8/30.0
- ARV discount +9.6/15.0
- DSCR +6.6/10.0
- 1% rule +5.5/10.0
- Livability +3.9/5.0
- Rent growth +3.5/5.0
- Condition / age +2.5/5.0
- Schools +1.8/10.0
- Appreciation +0.0/10.0
$200,000
🖨 Deal sheet 📄 Offer letter ✓ Due diligence
Multi-family units
County records classify this as Multi-Family (2-4 Unit). Listing-text estimate: 2 units. confirmed
Listing remarks MLS
Check out this duplex. Each unit has two bedrooms and one bathroom. 9514 Charlotte is rented at $875/month, lease ends 3/31/2025. Roof is 4 years old. Water heater in 9512 Charlotte was replaced 5/2022.
Key facts
- 5,546 sq ft lot
- Built 1954
- Listed 41 days
Property features AI
Finance
- Financial info: Gross income reported: $22,275; Operating expenses include maintenance, property management and other expenses; Under 80% current occupancy
- HOA & community: No association fees
Exterior
- Parking: Off-street parking
- Utilities: City/public water (verify); Public sewer; 100 amp electric service; Individual heat and air
- Home design: Duplex residential income property; 2 stories
- Construction: Board & batten siding; Composition roof
- Exterior features: Off-street parking; Lot approximately 5,546 square feet (public records)
Interior
- Kitchen: Dishwasher; Gas range; Refrigerator
- Bedrooms: Two 2-bedroom units
- Bathrooms: Each unit has 1 bathroom
- Heating & cooling: Natural gas heating; Electric cooling
- Interior features: Dishwasher; Refrigerator; Gas range
- Laundry & utility: Indoor laundry; Individual water heaters
Neighborhood map
What this means for you Summary
Snapshot
- This is a 2 × 2-bed/1.0-bath units multifamily listed at $200k.
Deal economics
- At list price, monthly cash flow is $274 ($3k/yr) — positive. Per door: $137/mo.
- The deal already cash-flows at list — no discount required.
- Meets the 1% rule at list price ($2k rent vs $200k).
- Recommended offer: $194k (3.0% below list) — sets the bar for market timing.
- Cap rate 7.9% vs local median 3.9% in Kansas City — top-decile yield for the area; either an underpriced asset or a hidden risk that comps aren't pricing in. Stress-test before assuming the spread holds.
Location & tenants
- Location reads 78/100 on livability (#28 in MO, #2,671 nationally) — a middle-class / working-renter tenant base. Strengths: amenities A+, commute A+, cost of living A+; Watch: schools C-, crime F.
- Center 58 (urban): math 12% / reading 29% proficiency, ranked #301 of 324 in MO (top 93%) — low school quality limits family demand, transient renter base, plan for 1-2y turnover; 63% free/reduced lunch — lower-income household profile, screen leases tightly.
- Market conditions: Rents rising (+4.0%/yr); 131 active listings in the ZIP; 14 comparable units currently listed for rent nearby; rentals at typical pace (median 16d on market — plan ~3-4 weeks tenant-placement turnaround); 4,002 units permitted in Jackson County in 2024 (2,271 in 5+ unit buildings).
- This rent runs 39% of the median local income ($64k/yr) — at the standard rent-burdened threshold; future hikes will face affordability resistance.
Forward outlook
- Local home prices are declining (-3.0%/yr); year-one equity from $1k of loan paydown is wiped out by about $6k of value loss. Plan a longer hold.
- Jackson County population projected at +4% by 2050 — modest demand growth; plan on rents tracking national, not racing it.
Negotiation context
- It's been on market 41 days — a 3% lower offer ($194k) is reasonable based on typical stale-listing flexibility.
- 4 sale attempts since 22y ago; this cycle's ask is 20001% above the opening price — seller raised mid-cycle; expect resistance to lowballs.
Risks & watch-outs
- Watch-outs: built in 1954 — expect roof / HVAC / electrical / plumbing capex.
Questions for the listing agent
- It's been on market 41 days. Have you received any prior offers? Is the seller open to a 3% concession, seller financing, or rate buy-down credit?
- Can we see the unit-by-unit rent roll, current vacancy, and any below-market leases? What's the average tenancy length?
- What capital expenditures (roof, boiler, parking lot, exteriors) have been made in the last 5 years, and what's planned in the next 2?
- Built in 1954 — when were the roof, HVAC, electrical panel, plumbing, and water heater last replaced?
- Is there a deadline driving the sale (1031 exchange, divorce, estate, relocation)? That informs how much negotiation room exists.
- Crime grade is F in this area — have there been break-ins, vandalism, or insurance claims at this property in the last 3 years? What carrier currently insures it and at what premium?
- What's the average days-on-market for RENTAL listings here right now (not sales)? A rising rental-DOM trend means longer vacancies and softer asking-rent achievability than the comps imply.
- What's the recent tenant-quality profile in this submarket — average credit score on applications, eviction rate, late-payment / NSF rate, and stable-employment percentage? A property-management company in the area should have these aggregated.
- How much new apartment / multifamily construction is in the pipeline within 1–3 miles? Heavy new supply (>2% of stock underway) typically softens rents 12–24 months out; light construction supports rent growth.
Investment metrics
- 1% rule
- 1.05% ✓
- Cap rate
- 7.94%
- Cash-on-cash
- 5.88%
- DSCR
- 1.26
- GRM
- 7.9
CMA / ARV
- ARV (median comp)
- $209,793
- List price
- $200,000
- Delta
- -4.67%
- Verdict
- FAIR
- Comps
- 5 within 1.0 mi
Projected returns pro-forma
-3.0% appreciation · 3.97% rent growth · sell at horizon
- IRR
- -6.1%
- Equity multiple
- 0.77×
- Total profit
- $-12,829
- Equity at exit
- $29,821
- IRR
- 4.7%
- Equity multiple
- 1.36×
- Total profit
- $20,115
- Equity at exit
- $17,292
Cash invested: $56,000 (down + closing). Projections, not guarantees.
Landlord ↔ Tenant lean methodology
- Overall (STATE)
- 81 Strongly Landlord-Friendly
- State Missouri
- 81 Strongly Landlord-Friendly · R+10
- County
- — inherits STATE
- City
- — inherits STATE
ZIP-level market 64131
- Rents YoY
- 4.0%
- Active inventory
- 131
- Price-to-rent
- 15.9×
Monthly cashflow live
- Estimated rent
- $2,097 medium interval (Pro) →
- Mortgage (P&I)
- −$1,049
- Tax est. 1.5%
- −$250 /mo · $3,000/yr
- Insurance
- −$83
- HOA
- −$0
- Vacancy / Maint / Mgmt
- −$440
- Net cashflow
- $274
Break-even live
2-unit breakdown (identical units grouped — click to expand)
| Units | Beds | Baths | Est. rent |
|---|---|---|---|
| 2× units | 2 | 1 | $2,098 |
| #1 | 2 | 1 | $1,049 |
| #2 | 2 | 1 | $1,049 |
| Total (2 units) | $2,097 | ||
UW: 25.0% down · 7.5% · 30yr · 1.5% tax · 5.0% vac · 8.0% maint · 8.0% mgmt
Financing live
Cash to close
- Down payment
- $50,000
- Closing costs
- $6,000
- Reserves months
- —
- Total cash needed
- —
Loan-product check · same deal, 3 products live
Conventional
25% down · 7.5% · 30yr
- Down + closing
- —
- Monthly P&I
- —
- Monthly cashflow
- —
- DSCR
- —
- Eligible?
- —
Personal DTI + credit; lowest rate.
DSCR
20% down · 8.5% · 30yr
- Down + closing
- —
- Monthly P&I
- —
- Monthly cashflow
- —
- DSCR
- —
- Eligible?
- —
No personal income docs; deal must DSCR.
Hard money
10% down · 12.0% · 12mo
- Down + closing
- —
- Monthly P&I
- —
- Monthly cashflow
- —
- DSCR
- —
- Eligible?
- —
Short-term bridge; refi at stabilization.
Rent comps 14 comps
| Address | Beds | Baths | Sqft | Rent | $/sqft | DOM | Units | Dist |
|---|---|---|---|---|---|---|---|---|
| 9534 Charlotte St Kansas City, MO | 2.0 | 1.0 | 828 | $795 | $0.96 | 16d | 1 | 0.09mi |
| 9548 Charlotte St Kansas City, MO | 2.0 | 1.0 | 850 | $1,025 | $1.21 | 19d | 1 | 0.13mi |
| 1520 E 97th St Kansas City, MO | 1.0–3.0 | 1.0–2.0 | 1163 | $1,246 | $1.07 | 2d | 7 | 0.61mi |
| 808 E 100 Ter Kansas City, MO | 1.0–2.0 | 1.0 | 660 | $1,170 | $1.77 | 43d | 4 | 0.63mi |
| 808 E 100 Ter Kansas City, MO | 1.0 | 1.0 | 576 | $1,020 | $1.77 | 23d | 1 | 0.63mi |
| 510 E 101st St Kansas City, MO | 1.0–2.0 | 1.0–2.0 | 918 | $1,290 | $1.41 | 4d | 5 | 0.77mi |
| 201 W 99th Ter Kansas City, MO | 1.0–2.0 | 1.0–2.5 | 1262 | $1,962 | $1.55 | 1d | 52 | 0.88mi |
| 8701 Chestnut Cir Kansas City, MO | 1.0–2.0 | 1.0–2.0 | 925 | $1,115 | $1.21 | 1d | 15 | 1.04mi |
| 114 W 103rd St Kansas City, MO | 1.0–2.0 | 1.0–2.0 | 925 | $1,225 | $1.32 | 4d | 9 | 1.09mi |
| 439 W 87 Pl Kansas City, MO | 1.0 | 1.0 | 616 | $795 | $1.29 | 16d | 1 | 1.33mi |
| 8704 Wornall Rd Unit B Kansas City, MO | 2.0 | 1.0 | 820 | $995 | $1.21 | 16d | 1 | 1.33mi |
| 8700 Wornall Rd Kansas City, MO | 1.0–3.0 | 1.0 | 836 | $995 | $1.19 | 14d | 3 | 1.35mi |
| 421 W 87 Pl Kansas City, MO | 3.0 | 1.0 | 1056 | $1,195 | $1.13 | 16d | 1 | 1.37mi |
| 10466 Wornall Rd Kansas City, MO | 1.0–2.0 | 1.0–1.5 | 960 | $1,095 | $1.14 | 20d | 3 | 1.45mi |
Listing history 21 events
-
2026-06-17status $200,000 Pending 41 DOM
-
2026-06-17days on market $200,000 Active Under Contract 41 DOM
-
2026-06-16days on market $200,000 Active Under Contract 40 DOM
-
2026-06-15days on market $200,000 Active Under Contract 39 DOM
-
2026-06-13days on market $200,000 Active Under Contract 37 DOM
-
2026-06-09days on market $200,000 Active Under Contract 33 DOM
-
2026-06-08days on market $200,000 Active Under Contract 32 DOM
-
2026-06-07days on market $200,000 Active Under Contract 31 DOM
-
2026-06-03days on market $200,000 Active Under Contract 27 DOM
-
2026-06-02statusdays on market $200,000 Active Under Contract 26 DOM
-
2026-06-01days on market $200,000 Active 25 DOM
-
2026-05-31days on market $200,000 Active 24 DOM
-
2026-05-12$995
-
2026-05-07$200,000 Active 429-char remark
-
2024-10-07soldstatus Closed 203-char remark
Show marketing remark (203 chars)
Check out this duplex. Each unit has two bedrooms and one bathroom. 9514 Charlotte is rented at $875/month, lease ends 3/31/2025. Roof is 4 years old. Water heater in 9512 Charlotte was replaced 5/2022.
-
2024-09-05historical Active Under Contract 203-char remark
Show marketing remark (203 chars)
Check out this duplex. Each unit has two bedrooms and one bathroom. 9514 Charlotte is rented at $875/month, lease ends 3/31/2025. Roof is 4 years old. Water heater in 9512 Charlotte was replaced 5/2022.
-
2024-08-16$200,000 Active 203-char remark
Show marketing remark (203 chars)
Check out this duplex. Each unit has two bedrooms and one bathroom. 9514 Charlotte is rented at $875/month, lease ends 3/31/2025. Roof is 4 years old. Water heater in 9512 Charlotte was replaced 5/2022.
-
2022-05-12price $795
-
2004-07-30soldstatus
Show marketing remark (63 chars)
occupied duplex selling property "as is" owner/broker
-
2004-05-04$75,000
Show marketing remark (63 chars)
occupied duplex selling property "as is" owner/broker
-
1996-03-18soldstatus
ⓘ Source: listings_history table (triggers on properties + properties_extension) + one-shot
backfill from property_details.listing_events for pre-trigger history.
Climate risk First Street
- Flood 1/10 Low FEMA zone X (unshaded) · 0% chance over 30 yrs
- Wildfire 1/10 Low
- Heat 4/10 Moderate 7 d/yr ≥107°F today · 17 d/yr by 30 yrs out
- Wind 2/10 Low
- Air quality 3/10 Moderate 2 unhealthy d/yr today · 4 by 30 yrs out
Nearby sold comps map
Loading sold comps map…
Walkable amenities ~0.75 mi
Loading nearby amenities…
Taxation est. · year 1
- Rental income
- $25,164
- − Mortgage interest
- −$11,203
- − Property taxes
- −$3,000
- − Insurance
- −$1,000
- − Repairs & maintenance
- −$2,013
- − Management
- −$2,013
- − Depreciation
- −$5,818
- Taxable income
- $116
- Est. tax owed @ 24.0%
- −$28
- After-tax cash flow
- $3,266/yr
For passive investors: Depreciation is non-cash, so a rental often shows a tax loss while cash-flowing — sheltering income. Rental losses are passive: they offset passive income freely, and up to $25,000/yr can offset ordinary (W-2) income if you actively participate and your MAGI is under $100k (phasing out to $0 by $150k); unused losses carry forward. On sale, claimed depreciation is recaptured at up to 25%, and gains may owe capital-gains tax (a 1031 exchange can defer both). Figures are a year-1 estimate at your 24.0% rate — not tax advice; consult a CPA.
Schools (NCES district)
- District
- Center 58
- NCES district ID
- 2908250
- Math proficiency
- 12% ▼ -15.00%
- Reading proficiency
- 29% ▼ -6.00%
- Median HH income
- $43,544
- Composite
- 17.64/100
- National rank
- #9031
- State rank
- #301 of 324 in MO
Livability — Kansas City
- Score
- 78/100
- State rank
- #28
- US rank
- #2671
Category grades
Schools grade is shown separately in the Schools card above.
Census & demographics
- Census place
- Kansas City, MO
- County
- Jackson County · 687,798 people
- City population
- 439,467
- Metro
- Kansas City, MO-KS
- Population (ZIP)
- 21,942
- Household income
- $64,201
- Rent vs Own
- Severe rent burden
- 1249.0
Population outlook (Jackson County) Hauer SSP2
- Today (2025)
- 719,589 people
- By 2030
- 731,456 · +1.6%
- By 2040
- 746,689 · +3.8%
- By 2050
- 749,289 · +4.1%
- By 2075
- 736,227 · +2.3%
- By 2100
- 668,210 · -7.1%
Race, ethnicity, and origin ACS 2023
- Neighborhood character
- Diverse neighborhood (Simpson 0.61)
- Race & ethnicity
- White 48% Black 39% Hispanic / Latino 7% Two or more races 7% Asian 1%
- Hispanic origin (detail)
- Mexican 3%
- Common ancestry
- Italian 5% Slovak 1% Lithuanian 1%
- Foreign-born
- 5% · Canada, Vietnam
- Languages at home
- 93% English-only · Spanish 3% French/Haitian/Cajun 1%
Political lean MEDSL · Jackson
- 2024 margin
- D (+19.3) · D 58.9% · R 39.5% · Other 1.6%
- 2008→2024 swing
- -6.1pp toward R · 2008: 25.4pp · 2024: 19.3pp
- All cycles
- 2024: D+19.3 2020: D+22.0 2016: D+16.6 2012: D+19.0 2008: D+25.4
Not yet ingested
- Civics
- —
Market trends
- HPI YoY
- ▼ -253.25%
- Current HPI
- 340.8202
- Rent YoY
- ▲ 3.97%
- Metro
- Kansas City, MO-KS
- State GDP YoY
- ▲ 1.84%
- F500 in state
- 20
Industry mix (Fortune 500 HQ in MO)
| Industry | F500 HQs | Revenue |
|---|---|---|
| Healthcare | 1 | $163B |
|
||
| Insurance | 1 | $21B |
|
||
| Industrial Technology | 1 | $17B |
|
||
| Retail | 1 | $16B |
|
||
| Industrial Distribution | 1 | $10B |
|
||
| Utilities | 1 | $9B |
|
||
Price history
+166.7% since first listed11 events — show timeline
- 2026-06-17 Pending — Heartland MLS as Distributed by MLS Grid
- 2026-06-02 Contingent — Heartland MLS as Distributed by MLS Grid
- 2026-05-12 Listed for Rent $995 RentEngineListings
- 2026-05-07 Listed $200,000 Heartland MLS as Distributed by MLS Grid
- 2024-10-07 Sold (MLS) — Heartland MLS as Distributed by MLS Grid
- 2024-09-05 Contingent — Heartland MLS as Distributed by MLS Grid
- 2024-08-16 Listed $200,000 Heartland MLS as Distributed by MLS Grid
- 2022-05-12 Price Changed $795 RENT.
- 2004-07-30 Sold (MLS) — Heartland MLS as Distributed by MLS Grid
- 2004-05-04 Listed $75,000 Heartland MLS as Distributed by MLS Grid
- 1996-03-18 Sold (Public Records) — Public Records
Property tax history
+3.6%/yrLatest (2025): $272 · -84.2% YoY. Source: county tax records.
Cash-flow waterfall
monthlySold comps — $/sqft
last 12 mo · ≤1 miLoading sold comps…