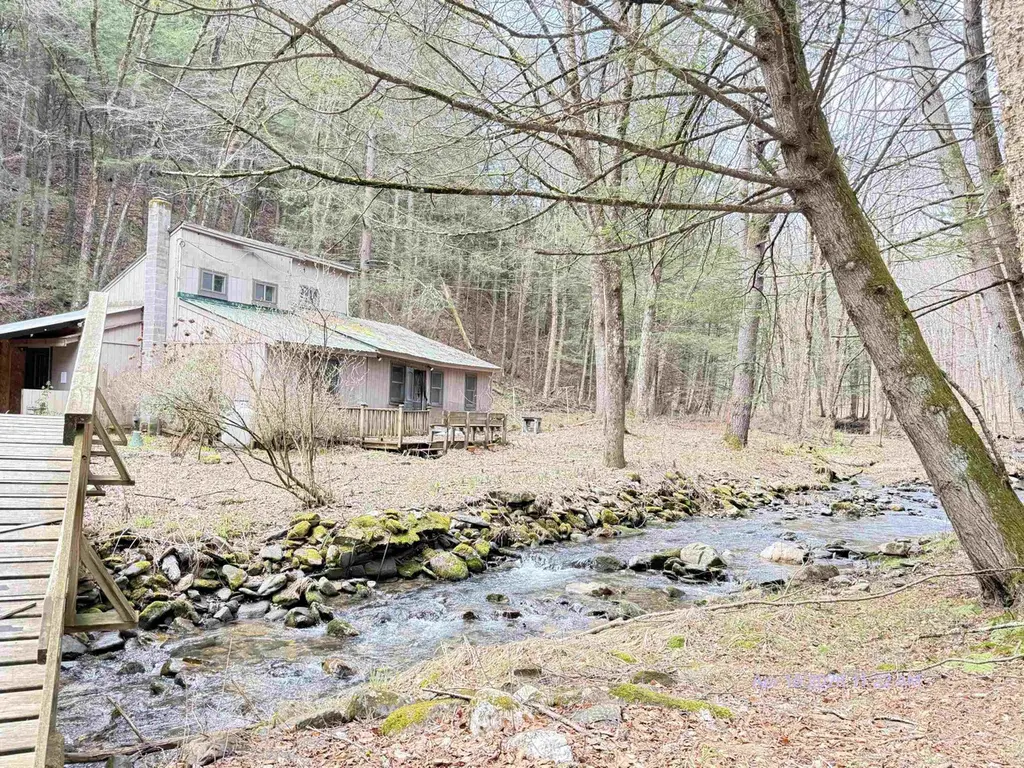
2390 Morse Brook Rd · Westminster, VT
Flood risk 10/10 · Severe
- FEMA flood zone
- X (unshaded)
- Chance of flooding over 30 yrs
- 0.99%
- Est. flood insurance / yr
- $473 – $860
Fire risk 3/10 · Minor
- Est. fire insurance / yr
- $480 – $892
Heat risk 2/10 · Minimal
- Hot days now (above 93°F)
- 7 days/yr
- Hot days in 30 yrs
- 15 days/yr
Wind risk 3/10 · Minor
- Chance of severe wind over 30 yrs
- 7.0%
Air-quality risk 1/10 · Minimal
- Unhealthy air days now
- 0 days/yr
- Unhealthy air days in 30 yrs
- 0 days/yr
Risk factors via First Street. Map © Google.
Why this score? — see what drove the A- grade
The composite is a weighted blend of 9 inputs, each scored 0–100. Each bar is that input's sub-score; the figure is the points it added to the 100-point composite (weight × sub-score).
- Cash flow +30.0/30.0
- 1% rule +10.0/10.0
- DSCR +10.0/10.0
- Appreciation +10.0/10.0
- ARV discount +7.5/15.0
- Schools +5.0/10.0
- Livability +3.2/5.0
- Rent growth +2.5/5.0
- Condition / age +2.5/5.0
$83,200
🖨 Deal sheet 📄 Offer letter ✓ Due diligence
Listing remarks
Opportunity awaits in this serene Westminster Vermont setting! Nestled beside a charming babbling brook, this property offers the perfect backdrop to create your dream getaway or year-round home. The existing cottage is ready for a full renovation or a fresh start—bring your vision and unlock the true potential of this peaceful slice of Vermont. Rare chance to build equity in a highly desirable natural setting! est suited for a cash sale. All information deemed correct, Buyers and Buyer's agent to do their due diligence. No Seller's Report as Seller has never occupied the property. Property is actually in Westminster - has a Putney Zip Code. The seller is asking for highest and best o
Key facts
- 3.5 acre lot
- Garage
- Built 1965
Property features AI
Finance
- Financial info: Property is foreclosed / bank-owned / REO
Exterior
- Parking: 1-car garage
- Utilities: Drilled well for water; Circuit breaker electrical panel; Telephone available; Internet availability unknown
- Home design: Cottage/Camp style; Existing structure; Built in 1965
- Construction: Wood frame construction; Wood exterior; Metal roof; Survey status unknown
- Exterior features: Country setting; On a stream; Wooded lot; Dirt driveway; Public road frontage (approx. 423 ft)
Interior
- Bathrooms: 1 full bathroom
- Heating & cooling: Baseboard heating; Electric heating; Wood stove
- Interior features: 6 total rooms
Neighborhood map
What this means for you Summary
Snapshot
- This is a 3-bed/1.0-bath single-family listed at $83k.
Deal economics
- At list price, monthly cash flow is $374 ($4k/yr) — positive.
- The deal already cash-flows at list — no discount required.
- Meets the 1% rule at list price ($1k rent vs $83k).
- Recommended offer: $82k (1.5% below list) — sets the bar for market timing.
Location & tenants
- Location reads 65/100 on livability (#59 in VT) — a middle-class / working-renter tenant base. Strengths: employment A+, housing A+, crime B; Watch: schools D+, health & safety D, amenities F.
- Market conditions: 19 active listings in the ZIP; 188 units permitted in Windham County in 2024 (0 in 5+ unit buildings).
Forward outlook
- In year one you build about $9k of equity ($575 loan paydown + $8k appreciation (10.0% local appreciation)).
- Windham County population projected at -26% by 2050 — secular population decline; favor cash flow + early exit over multi-decade hold.
- At projected returns (10.0% appreciation + 3.0% rent growth), your $23k cash investment doubles in ~2 years — after that, you're playing with house money.
- By year 4, paydown + projected appreciation supports a ~$32k cash-out refi (75% LTV) — recoverable capital for the next deal without selling this one.
Negotiation context
- It's been on market 29 days — a 2% lower offer ($82k) is reasonable based on typical stale-listing flexibility.
Risks & watch-outs
- Watch-outs: property tax is 3.0% of price; flood insurance adds $56/mo.
- Climate carrying-cost: severe flood risk — expect insurance premiums to compound above CPI over the hold.
Questions for the listing agent
- Built in 1965 — when were the roof, HVAC, electrical panel, plumbing, and water heater last replaced?
- Property tax is high relative to price — has the assessment been appealed recently, and will the sale trigger a re-assessment?
- What's the actual annual flood-insurance premium (NFIP or private), and is the property in a SFHA with mandatory coverage?
- Is there a deadline driving the sale (1031 exchange, divorce, estate, relocation)? That informs how much negotiation room exists.
- Schools are D-rated, which usually means shorter tenancies and higher turnover. Who's the typical renter profile here, and what's been the actual vacancy rate?
- What's the average days-on-market for RENTAL listings here right now (not sales)? A rising rental-DOM trend means longer vacancies and softer asking-rent achievability than the comps imply.
- What's the recent tenant-quality profile in this submarket — average credit score on applications, eviction rate, late-payment / NSF rate, and stable-employment percentage? A property-management company in the area should have these aggregated.
- How much new for-sale + rental construction is in the pipeline within 1–3 miles? Heavy new supply typically softens prices + rents 12–24 months out; constrained supply supports both.
Investment metrics
- 1% rule
- 1.69% ✓
- Cap rate
- 12.48%
- Cash-on-cash
- 22.11%
- DSCR
- 1.98
- GRM
- 4.9
CMA / ARV
No comps found within radius.
Projected returns pro-forma
10.0% appreciation · 3.0% rent growth · sell at horizon
- IRR
- 38.7%
- Equity multiple
- 3.97×
- Total profit
- $69,233
- Equity at exit
- $74,953
- IRR
- 33.3%
- Equity multiple
- 8.96×
- Total profit
- $185,403
- Equity at exit
- $161,639
Cash invested: $23,296 (down + closing). Projections, not guarantees.
Landlord ↔ Tenant lean methodology
- Overall (STATE)
- 41 Moderately Tenant-Leaning
- State Vermont
- 41 Moderately Tenant-Leaning · D+15
- County
- — inherits STATE
- City
- — inherits STATE
ZIP-level market 05346
- Home prices YoY
- 7.1%
- Active inventory
- 19
- Price-to-rent
- 4.9×
Monthly cashflow live
- Estimated rent
- $1,405 medium interval (Pro) →
- Mortgage (P&I)
- −$436
- Tax from tax record
- −$210 /mo · $2,520/yr
- Insurance
- −$35
- Flood insurance flood zone
- −$56 /mo · $666/yr
- HOA
- −$0
- Vacancy / Maint / Mgmt
- −$295
- Net cashflow
- $374
Break-even live
UW: 25.0% down · 7.5% · 30yr · 1.5% tax · 5.0% vac · 8.0% maint · 8.0% mgmt
Financing live
Cash to close
- Down payment
- $20,800
- Closing costs
- $2,496
- Reserves months
- —
- Total cash needed
- —
Loan-product check · same deal, 3 products live
Conventional
25% down · 7.5% · 30yr
- Down + closing
- —
- Monthly P&I
- —
- Monthly cashflow
- —
- DSCR
- —
- Eligible?
- —
Personal DTI + credit; lowest rate.
DSCR
20% down · 8.5% · 30yr
- Down + closing
- —
- Monthly P&I
- —
- Monthly cashflow
- —
- DSCR
- —
- Eligible?
- —
No personal income docs; deal must DSCR.
Hard money
10% down · 12.0% · 12mo
- Down + closing
- —
- Monthly P&I
- —
- Monthly cashflow
- —
- DSCR
- —
- Eligible?
- —
Short-term bridge; refi at stabilization.
Listing history 7 events
-
2026-06-04status $83,200 Pending 29 DOM
-
2026-06-03days on market $83,200 Active 29 DOM
-
2026-06-02days on market $83,200 Active 28 DOM
-
2026-06-01days on market $83,200 Active 27 DOM
-
2026-05-31days on market $83,200 Active 26 DOM
-
2026-05-03$83,200 Active
-
2007-10-04soldstatus $147,000
ⓘ Source: listings_history table (triggers on properties + properties_extension) + one-shot
backfill from property_details.listing_events for pre-trigger history.
Tax reassessment forecast VT · Partial reset (capped growth)
- Current annual tax
- $2,520 · $210/mo
- Projected year-2 tax
- $2,520 · $210/mo
- Expected delta
- $0/yr ($0/mo · 0.0%)
ⓘ Screening estimate from a state-policy table — verify with the county assessor before closing.
Climate risk First Street
- Flood 10/10 Extreme FEMA zone X (unshaded) · 99% chance over 30 yrs
- Wildfire 3/10 Moderate
- Heat 2/10 Low 7 d/yr ≥93°F today · 15 d/yr by 30 yrs out
- Wind 3/10 Moderate 7% chance of damaging wind over 30 yrs
- Air quality 1/10 Low 0 unhealthy d/yr today · 0 by 30 yrs out
Nearby sold comps map
Loading sold comps map…
Walkable amenities ~0.75 mi
Loading nearby amenities…
Taxation est. · year 1
- Rental income
- $16,864
- − Mortgage interest
- −$4,660
- − Property taxes
- −$2,520
- − Insurance
- −$1,082
- − Repairs & maintenance
- −$1,349
- − Management
- −$1,349
- − Depreciation
- −$2,420
- Taxable income
- $3,482
- Est. tax owed @ 24.0%
- −$836
- After-tax cash flow
- $3,648/yr
For passive investors: Depreciation is non-cash, so a rental often shows a tax loss while cash-flowing — sheltering income. Rental losses are passive: they offset passive income freely, and up to $25,000/yr can offset ordinary (W-2) income if you actively participate and your MAGI is under $100k (phasing out to $0 by $150k); unused losses carry forward. On sale, claimed depreciation is recaptured at up to 25%, and gains may owe capital-gains tax (a 1031 exchange can defer both). Figures are a year-1 estimate at your 24.0% rate — not tax advice; consult a CPA.
Schools (NCES district)
No district data.
Livability — Westminster
- Score
- 65/100
- State rank
- #59
- US rank
- #13210
Category grades
Schools grade is shown separately in the Schools card above.
Census & demographics
- Population (ZIP)
- 5,236
Population outlook (Windham County) Hauer SSP2
- Today (2025)
- 40,432 people
- By 2030
- 38,472 · -4.8%
- By 2040
- 33,954 · -16.0%
- By 2050
- 29,774 · -26.4%
- By 2075
- 22,351 · -44.7%
- By 2100
- 15,961 · -60.5%
Race, ethnicity, and origin ACS 2023
- Neighborhood character
- Predominantly White (84%)
- Race & ethnicity
- White 84% Two or more races 8% Hispanic / Latino 6% Black 2%
- Hispanic origin (detail)
- Puerto Rican 4%
- Common ancestry
- Slovak 7% Romanian 4% Lithuanian 4%
- Foreign-born
- 4% · Canada, China
- Languages at home
- 97% English-only · French/Haitian/Cajun 1% Spanish 1%
Political lean MEDSL · Windham
- 2024 margin
- Solid D (+42.7) · D 69.6% · R 26.9% · Other 3.5%
- 2008→2024 swing
- -5.4pp toward R · 2008: 48.1pp · 2024: 42.7pp
- All cycles
- 2024: D+42.7 2020: D+47.3 2016: D+42.0 2012: D+49.2 2008: D+48.1
Not yet ingested
- Civics
- —
Market trends
- HPI YoY
- ▲ 20.34%
- Current HPI
- 307.2938
- Rent YoY
- —
- Metro
- —
- State GDP YoY
- —
- F500 in state
- 0
Price history
-43.4% since first listed2 events — show timeline
- 2026-05-03 Listed $83,200 PrimeMLS
- 2007-10-04 Sold (Public Records) $147,000 Public Records
Property tax history
-1.8%/yrLatest (2024): $2,520 · +7.7% YoY. Source: county tax records.
Cash-flow waterfall
monthlySold comps — $/sqft
last 12 mo · ≤1 miLoading sold comps…