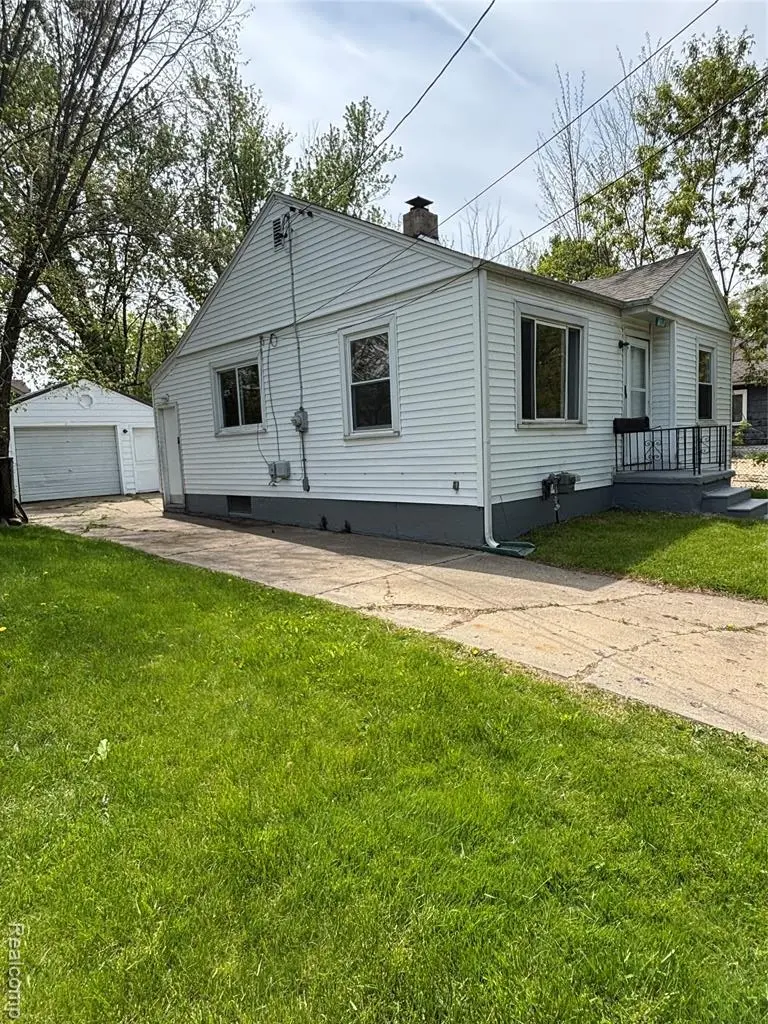
2717 Gibson St · Flint, MI
Flood risk 1/10 · Minimal
- FEMA flood zone
- X (unshaded)
- Chance of flooding over 30 yrs
- 0.0%
- Est. flood insurance / yr
- $473 – $860
Fire risk 1/10 · Minimal
- Est. fire insurance / yr
- $784 – $1,456
Heat risk 2/10 · Minimal
- Hot days now (above 97°F)
- 7 days/yr
- Hot days in 30 yrs
- 15 days/yr
Wind risk 2/10 · Minimal
- Chance of severe wind over 30 yrs
- —
Air-quality risk 3/10 · Minor
- Unhealthy air days now
- 3 days/yr
- Unhealthy air days in 30 yrs
- 4 days/yr
Risk factors via First Street. Map © Google.
Why this score? — see what drove the C+ grade
The composite is a weighted blend of 9 inputs, each scored 0–100. Each bar is that input's sub-score; the figure is the points it added to the 100-point composite (weight × sub-score).
- Cash flow +30.0/30.0
- 1% rule +10.0/10.0
- DSCR +10.0/10.0
- Rent growth +5.0/5.0
- Livability +3.7/5.0
- Condition / age +2.5/5.0
- Schools +1.1/10.0
- ARV discount +0.0/15.0
- Appreciation +0.0/10.0
$54,900
🖨 Deal sheet (PDF) 📄 Offer letter ✓ Due diligence
Listing remarks MLS
Charming, totally remodeled 2-bedroom home with a full basement and garage with a brand new metal roof. All priced to sell at this reasonable price. Just turn the key and move in. Down payment assistance can easily be obtained on this home.
Key facts
- 3,920 sq ft lot
- Garage
- Built 1950
Property features AI
Exterior
- Parking: Detached 1-car garage
- Utilities: Public water; Public sewer
- Home design: Single-family residence; One level; Ground-level entry with steps
- Construction: Aluminum siding; Block foundation
- Exterior features: Paved road access; Lot approximately 40 x 100 (0.09 acres)
Interior
- Bedrooms: Total of 4 rooms (bedrooms included)
- Bathrooms: 1 full bathroom
- Heating & cooling: Forced air heating (natural gas); No central cooling
- Interior features: Unfinished basement
Neighborhood map
What this means for you Summary
Snapshot
- This is a 2-bed/1.0-bath single-family listed at $55k.
Deal economics
- At list price, monthly cash flow is $346 ($4k/yr) — positive.
- The deal already cash-flows at list — no discount required.
- Meets the 1% rule at list price ($926 rent vs $55k).
- Recommended offer: $54k (1.5% below list) — sets the bar for market timing.
- Cap rate 13.9% vs local median 11.5% in Flint — meaningfully above typical; check what's discounted (condition, days-on-market, listing class) to confirm the premium yield is real.
Location & tenants
- Location reads 74/100 on livability (#196 in MI, #4,946 nationally) — a middle-class / working-renter tenant base. Strengths: commute A+, cost of living A+, housing A+; Watch: crime F, employment F.
- Flint School District (urban): math 7% / reading 13% proficiency, ranked #714 of 760 in MI (top 94%) — low school quality limits family demand, transient renter base, plan for 1-2y turnover; 83% free/reduced lunch — lower-income household profile, screen leases tightly.
- Zoned schools: Holmes Stem Middle School Academy (math 10% / reading 30%, grade F, #420 of 493 statewide, top 86%, 324 students, 90% FRL).
- Market conditions: Rents rising fast (+12.3%/yr); 137 active listings in the ZIP; 2 comparable units currently listed for rent nearby; lower-income renter base — watch delinquency; 419 units permitted in Genesee County in 2024 (68 in 5+ unit buildings).
Forward outlook
- Local home prices are declining (-3.0%/yr); year-one equity from $380 of loan paydown is wiped out by about $2k of value loss. Plan a longer hold.
- Genesee County population projected at -27% by 2050 — secular population decline; favor cash flow + early exit over multi-decade hold.
- At projected returns (-3.0% appreciation + 8.0% rent growth), your $15k cash investment doubles in ~4 years — after that, you're playing with house money.
Negotiation context
- It's been on market 19 days — a 2% lower offer ($54k) is reasonable based on typical stale-listing flexibility.
- 7 sale attempts since 13y ago with the ask held roughly flat each time — persistent listings suggest the price (not the market) is what's stuck; bring a comps-based counter.
- Current owner paid $22k; list at $55k implies a 144% gain — meaningful room to come down on a strong offer.
Risks & watch-outs
- Watch-outs: built in 1950 — expect roof / HVAC / electrical / plumbing capex.
Questions for the listing agent
- Built in 1950 — when were the roof, HVAC, electrical panel, plumbing, and water heater last replaced?
- Is there a deadline driving the sale (1031 exchange, divorce, estate, relocation)? That informs how much negotiation room exists.
- Schools are F-rated, which usually means shorter tenancies and higher turnover. Who's the typical renter profile here, and what's been the actual vacancy rate?
- Crime grade is F in this area — have there been break-ins, vandalism, or insurance claims at this property in the last 3 years? What carrier currently insures it and at what premium?
- What's the average days-on-market for RENTAL listings here right now (not sales)? A rising rental-DOM trend means longer vacancies and softer asking-rent achievability than the comps imply.
- What's the recent tenant-quality profile in this submarket — average credit score on applications, eviction rate, late-payment / NSF rate, and stable-employment percentage? A property-management company in the area should have these aggregated.
- How much new for-sale + rental construction is in the pipeline within 1–3 miles? Heavy new supply typically softens prices + rents 12–24 months out; constrained supply supports both.
Investment metrics
- 1% rule
- 1.69% ✓
- Cap rate
- 13.85%
- Cash-on-cash
- 27.00%
- DSCR
- 2.20
- GRM
- 4.9
CMA / ARV
- ARV (on-the-fly)
- $39,846
- Comps found
- 12
Show comp detail 12 sales within ~0.75 mi
| Address | Dist | Beds/Ba | Sqft | Sold | Price | $/sf | Match |
|---|---|---|---|---|---|---|---|
| 2717 Gibson St | 0.00mi | 2/1.0 | 687 (0%) | 1mo | $50,000 | $73 | 99 |
| 2805 Reynolds St | 0.05mi | 2/1.0 | 704 (+2%) | 3mo | $35,000 | $50 | 91 |
| 2913 Gibson St | 0.11mi | 2/1.0 | 680 (-1%) | 6mo | $45,000 | $66 | 88 |
| 2710 Reynolds St | 0.03mi | 2/1.0 | 751 (+9%) | 5mo | $56,500 | $75 | 78 |
| 3310 Larchmont St | 0.56mi | 2/1.0 | 688 (+0%) | 2mo | $18,000 | $26 | 72 |
| 916 Mann St | 0.35mi | 2/1.0 | 647 (-6%) | 3mo | $35,000 | $54 | 71 |
| 2641 Brown St | 0.21mi | 2/1.0 | 783 (+14%) | 2mo | $36,500 | $47 | 65 |
| 3214 Clairmont St | 0.50mi | 2/1.0 | 720 (+5%) | 4mo | $30,500 | $42 | 65 |
| 3317 Arlene Ave | 0.46mi | 2/1.0 | 600 (-13%) | 1mo | $34,500 | $58 | 57 |
| 3305 Larchmont St | 0.59mi | 2/1.0 | 736 (+7%) | 5mo | $45,000 | $61 | 56 |
| 3609 Larchmont St | 0.69mi | 2/1.0 | 650 (-5%) | 7mo | $60,000 | $92 | 53 |
| 959 Tacken St | 0.70mi | 2/1.0 | 748 (+9%) | 4mo | $24,900 | $33 | 49 |
Match score weights: distance 35% · size 25% · config 20% · recency 20%. Top-matched comps best support the ARV.
Projected returns pro-forma
-3.0% appreciation · 8.0% rent growth · sell at horizon
- IRR
- 26.5%
- Equity multiple
- 2.17×
- Total profit
- $18,048
- Equity at exit
- $8,186
- IRR
- 37.1%
- Equity multiple
- 5.32×
- Total profit
- $66,436
- Equity at exit
- $4,747
Cash invested: $15,372 (down + closing). Projections, not guarantees.
Landlord ↔ Tenant lean methodology
- Overall (STATE)
- 62 Landlord-Friendly
- State Michigan
- 62 Landlord-Friendly · EVEN
- County
- — inherits STATE
- City
- — inherits STATE
ZIP-level market 48503
- Home prices YoY
- -27.7%
- Rents YoY
- 12.3%
- Active inventory
- 137
- Price-to-rent
- 4.9×
Monthly cashflow live
- Estimated rent
- $926 medium interval (Pro) →
- Mortgage (P&I)
- −$288
- Tax from tax record
- −$75 /mo · $901/yr
- Insurance
- −$23
- HOA
- −$0
- Vacancy / Maint / Mgmt
- −$195
- Net cashflow
- $346
Break-even live
Sensitivity live
| Price | -10% $377 | -5% $361 | +0% $346 | +5% $330 | +10% $315 |
|---|---|---|---|---|---|
| Rent | -10% $273 | -5% $309 | +0% $346 | +5% $382 | +10% $419 |
| Rate | -1.0pp $374 | -0.5pp $360 | base $346 | +0.5pp $332 | +1.0pp $317 |
UW: 25.0% down · 7.5% · 30yr · 1.5% tax · 5.0% vac · 8.0% maint · 8.0% mgmt
Financing live
Cash to close
- Down payment
- $13,725
- Closing costs
- $1,647
- Reserves months
- —
- Total cash needed
- —
Loan-product check · same deal, 3 products live
Conventional
25% down · 7.5% · 30yr
- Down + closing
- —
- Monthly P&I
- —
- Monthly cashflow
- —
- DSCR
- —
- Eligible?
- —
Personal DTI + credit; lowest rate.
DSCR
20% down · 8.5% · 30yr
- Down + closing
- —
- Monthly P&I
- —
- Monthly cashflow
- —
- DSCR
- —
- Eligible?
- —
No personal income docs; deal must DSCR.
Hard money
10% down · 12.0% · 12mo
- Down + closing
- —
- Monthly P&I
- —
- Monthly cashflow
- —
- DSCR
- —
- Eligible?
- —
Short-term bridge; refi at stabilization.
Rent comps 2 comps
| Address | Beds | Baths | Sqft | Rent | $/sqft | DOM | Units | Dist |
|---|---|---|---|---|---|---|---|---|
| 352 Bradley Ave Unit 343 Sheffield Ave-Apt C Flint, MI | 1.0 | 1.0 | 564 | $900 | $1.60 | 23d | 1 | 0.49mi |
| 343 Sheffield Apt. C Ave heuristic Flint, MI | 1.0 | 1.0 | 564 | $900 | $1.60 | 27d | 1 | 0.53mi |
Listing history 14 events
-
2026-05-08$54,900 Active
Show marketing remark (240 chars)
Charming, totally remodeled 2-bedroom home with a full basement and garage with a brand new metal roof. All priced to sell at this reasonable price. Just turn the key and move in. Down payment assistance can easily be obtained on this home.
-
2026-05-08$54,900 Active 240-char remark
Show marketing remark (240 chars)
Charming, totally remodeled 2-bedroom home with a full basement and garage with a brand new metal roof. All priced to sell at this reasonable price. Just turn the key and move in. Down payment assistance can easily be obtained on this home.
-
2024-01-09historical $800
-
2023-12-05$800
-
2013-06-20soldstatus $22,500 25-char remark
Show marketing remark (25 chars)
Great investment property
-
2013-06-20soldstatus $22,500
Show marketing remark (25 chars)
Great investment property
-
2013-06-17$22,500 25-char remark
Show marketing remark (25 chars)
Great investment property
-
2013-06-17historical
Show marketing remark (25 chars)
Great investment property
-
2013-06-17$22,500
Show marketing remark (25 chars)
Great investment property
-
2013-05-09soldstatus $7,171
-
2013-05-09soldstatus $7,171
-
2013-03-27historical
-
2013-03-22$6,000
-
2013-03-22$6,000
ⓘ Source: listings_history table (triggers on properties + properties_extension) + one-shot
backfill from property_details.listing_events for pre-trigger history.
Tax reassessment forecast MI · Partial reset (capped growth)
- Current annual tax
- $901 · $75/mo
- Projected year-2 tax
- $901 · $75/mo
- Expected delta
- $0/yr ($0/mo · 0.0%)
ⓘ Screening estimate from a state-policy table — verify with the county assessor before closing.
Climate risk First Street
- Flood 1/10 Low FEMA zone X (unshaded) · 0% chance over 30 yrs
- Wildfire 1/10 Low
- Heat 2/10 Low 7 d/yr ≥97°F today · 15 d/yr by 30 yrs out
- Wind 2/10 Low
- Air quality 3/10 Moderate 3 unhealthy d/yr today · 4 by 30 yrs out
Nearby sold comps map
Loading sold comps map…
Walkable amenities ~0.75 mi
Loading nearby amenities…
Taxation est. · year 1
- Rental income
- $11,115
- − Mortgage interest
- −$3,075
- − Property taxes
- −$901
- − Insurance
- −$274
- − Repairs & maintenance
- −$889
- − Management
- −$889
- − Depreciation
- −$1,597
- Taxable income
- $3,489
- Est. tax owed @ 24.0%
- −$837
- After-tax cash flow
- $3,313/yr
For passive investors: Depreciation is non-cash, so a rental often shows a tax loss while cash-flowing — sheltering income. Rental losses are passive: they offset passive income freely, and up to $25,000/yr can offset ordinary (W-2) income if you actively participate and your MAGI is under $100k (phasing out to $0 by $150k); unused losses carry forward. On sale, claimed depreciation is recaptured at up to 25%, and gains may owe capital-gains tax (a 1031 exchange can defer both). Figures are a year-1 estimate at your 24.0% rate — not tax advice; consult a CPA.
Schools (NCES district)
- District
- Flint School District
- NCES district ID
- 2614520
- Math proficiency
- 7% ▬ 0.00%
- Reading proficiency
- 13% ▲ 3.00%
- Median HH income
- $25,954
- Composite
- 10.97/100
- National rank
- #14642
- State rank
- #714 of 760 in MI
Livability — Flint
- Score
- 74/100
- State rank
- #196
- US rank
- #4946
Category grades
Schools grade is shown separately in the Schools card above.
Census & demographics
- Census place
- Flint, MI
- County
- Genesee County · 221,329 people
- City population
- 93,814
- Metro
- Flint, MI
- Population (ZIP)
- 22,347
- Household income
- $44,411
- Rent vs Own
- Severe rent burden
- 1293.0
Population outlook (Genesee County) Hauer SSP2
- Today (2025)
- 381,312 people
- By 2030
- 362,731 · -4.9%
- By 2040
- 321,550 · -15.7%
- By 2050
- 279,212 · -26.8%
- By 2075
- 193,336 · -49.3%
- By 2100
- 128,118 · -66.4%
Race, ethnicity, and origin ACS 2023
- Neighborhood character
- Diverse neighborhood (Simpson 0.56)
- Race & ethnicity
- Black 55% White 36% Two or more races 4% Hispanic / Latino 3%
- Common ancestry
- Romanian 2% Lithuanian 2% Slovak 1%
- Foreign-born
- 5% · China, Canada
- Languages at home
- 93% English-only · Arabic 4% Spanish 1% Chinese 1%
Political lean MEDSL · Genesee
- 2024 margin
- Toss-up / Even · D 51.4% · R 47.2% · Other 1.4%
- 2008→2024 swing
- -28.3pp toward R · 2008: 32.5pp · 2024: 4.2pp
- All cycles
- 2024: D+4.2 2020: D+9.3 2016: D+9.5 2012: D+28.2 2008: D+32.5
Not yet ingested
- Civics
- —
Market trends
- HPI YoY
- ▼ -49.84%
- Current HPI
- 130.1152
- Rent YoY
- ▲ 12.35%
- Metro
- Flint, MI
- State GDP YoY
- ▲ 1.37%
- F500 in state
- 28
Industry mix (Fortune 500 HQ in MI)
| Industry | F500 HQs | Revenue |
|---|---|---|
| Automotive Parts | 3 | $48B |
|
||
| Automotive | 2 | $372B |
|
||
| Chemicals | 1 | $45B |
|
||
| Automotive Retail | 1 | $29B |
|
||
| Healthcare / Medical Devices | 1 | $23B |
|
||
| Automotive Technology | 1 | $20B |
|
||
Price history
+815.0% since first listed14 events — show timeline
- 2026-05-08 Listed $54,900 MiRealSource-MiMLS
- 2026-05-08 Listed $54,900 REALCOMP
- 2024-01-09 Rental Removed $800 REALSOURCE
- 2023-12-05 Listed for Rent $800 REALSOURCE
- 2013-06-20 Sold (MLS) $22,500 MiRealSource-MiMLS
- 2013-06-20 Sold (MLS) $22,500 REALCOMP
- 2013-06-17 Listed $22,500 MiRealSource-MiMLS
- 2013-06-17 Listing Removed — MiRealSource-MiMLS
- 2013-06-17 Listed $22,500 REALCOMP
- 2013-05-09 Sold (MLS) $7,171 REALCOMP
- 2013-05-09 Sold (MLS) $7,171 MiRealSource-MiMLS
- 2013-03-27 Listing Removed — MiRealSource-MiMLS
- 2013-03-22 Listed $6,000 REALCOMP
- 2013-03-22 Listed $6,000 MiRealSource-MiMLS
Property tax history
+4.6%/yrLatest (2025): $901 · +1.6% YoY. Source: county tax records.
Cash-flow waterfall
monthlySold comps — $/sqft
last 12 mo · ≤1 miLoading sold comps…