2501 Ransdell St · Indianapolis city (balance), IN
Flood risk 4/10 · Minor
- FEMA flood zone
- X (unshaded)
- Chance of flooding over 30 yrs
- 0.23%
- Est. flood insurance / yr
- $507 – $1,088
Fire risk 1/10 · Minimal
- Est. fire insurance / yr
- $717 – $1,331
Heat risk 4/10 · Minor
- Hot days now (above 101°F)
- 7 days/yr
- Hot days in 30 yrs
- 19 days/yr
Wind risk 2/10 · Minimal
- Chance of severe wind over 30 yrs
- 0.0%
Air-quality risk 3/10 · Minor
- Unhealthy air days now
- 2 days/yr
- Unhealthy air days in 30 yrs
- 3 days/yr
Risk factors via First Street. Map © Google.
Why this score? — see what drove the B+ grade
The composite is a weighted blend of 9 inputs, each scored 0–100. Each bar is that input's sub-score; the figure is the points it added to the 100-point composite (weight × sub-score).
- Cash flow +30.0/30.0
- ARV discount +15.0/15.0
- DSCR +10.0/10.0
- 1% rule +9.2/10.0
- Rent growth +5.0/5.0
- Livability +2.5/5.0
- Condition / age +2.5/5.0
- Schools +1.4/10.0
- Appreciation +0.0/10.0
$99,900
🖨 Deal sheet (PDF) 📄 Offer letter ✓ Due diligence
Listing remarks
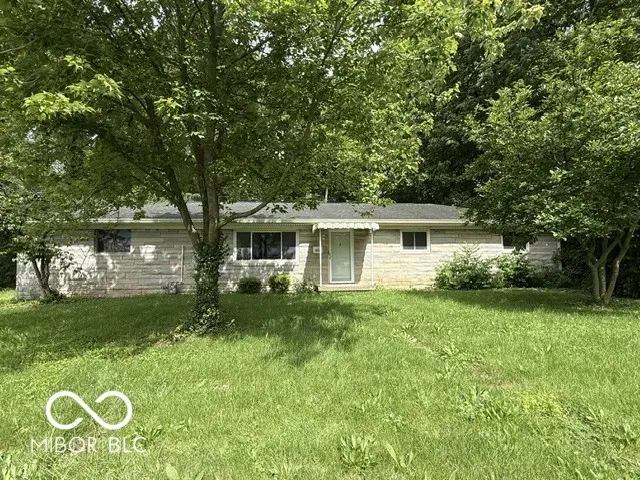
Opportunity knocks in this limestone three bedroom, one and a have bath ranch home. Sitting on a . 25 acre lot. The home is being sold AS IS. Renovation work started and now the new owner can step in with a head start: some kitchen cabinets are on site and ready for installation, and new doors have already been hung in the bedrooms. Features include hardwood floors in several rooms, a spacious living area, attached 480 sq foot garage. Cedar lined closet in the third bedroom. Convenient Indianapolis location approximately seven minutes from the University of Indianapolis and next door to Christel House at Manual. Ideal for investors, rehabbers, or buyers looking for a project with potential.
Key facts
- New doors hung
- Limestone ranch home
- Cedar lined closet
Tags
Property features AI
Finance
- Other: Lot under 1/4 acre (approx. 0.15 acre)
- HOA & community: Not low-maintenance lifestyle
Exterior
- Parking: Attached garage (2 spaces, approx. 480 sq ft)
- Utilities: Public water; Municipal sewer connected; Sewer connected; Water connected; Net meter electric; Solid waste service available
- Home design: Single-family residence; Fixer condition; One story
- Construction: Stone construction; Crawl space foundation
- Exterior features: City lot
Interior
- Kitchen: No appliances listed
- Bedrooms: 3 bedrooms on the main level
- Flooring: Hardwood floors
- Bathrooms: 1 full bath; 1 half bath
- Heating & cooling: No heating listed; No cooling listed
- Interior features: Hardwood floors; Woodwork painted; Bedroom other on main; Laundry in unit
- Laundry & utility: Main-level laundry room (6x6)
Neighborhood map
What this means for you Summary
Snapshot
- This is a 3-bed/1.5-bath single-family listed at $100k.
Deal economics
- At list price, monthly cash flow is $459 ($6k/yr) — positive.
- The deal already cash-flows at list — no discount required.
- Meets the 1% rule at list price ($1k rent vs $100k).
- Cap rate 11.8% vs local median 4.4% in Indianapolis city (balance) — top-decile yield for the area; either an underpriced asset or a hidden risk that comps aren't pricing in. Stress-test before assuming the spread holds.
Location & tenants
- Location reads: area grade B — affects rentability + tenant quality, not the cash-flow math above.
- Indianapolis Public Schools (urban): math 14% / reading 20% proficiency, ranked #286 of 301 in IN (top 95%) — low school quality limits family demand, transient renter base, plan for 1-2y turnover; 77% free/reduced lunch — lower-income household profile, screen leases tightly.
- Zoned schools: Frederick Douglass School 19 (math 9% / reading 13%, grade F, #909 of 994 statewide, top 92%, 444 students, 81% FRL); H L Harshman Middle School (math 3% / reading 16%, grade F, #316 of 330 statewide, top 96%, 549 students, 84% FRL).
- Market conditions: Rents rising fast (+11.0%/yr); 131 active listings in the ZIP; 40 comparable units currently listed for rent nearby; rentals at typical pace (median 25d on market — plan ~3-4 weeks tenant-placement turnaround); 1,906 units permitted in Marion County in 2024 (621 in 5+ unit buildings).
- This rent runs 31% of the median local income ($55k/yr) — at the standard rent-burdened threshold; future hikes will face affordability resistance.
Forward outlook
- Local home prices are declining (-3.0%/yr); year-one equity from $691 of loan paydown is wiped out by about $3k of value loss. Plan a longer hold.
- Marion County population projected at +18% by 2050 — long-run rental-demand tailwind backs the buy-and-hold thesis.
- At projected returns (-3.0% appreciation + 8.0% rent growth), your $28k cash investment doubles in ~5 years — after that, you're playing with house money.
Negotiation context
- Only 4 days on market — expect competitive offers; lowballing is unlikely to land.
Questions for the listing agent
- Built in 1960 — when were the roof, HVAC, electrical panel, plumbing, and water heater last replaced?
- Is there a deadline driving the sale (1031 exchange, divorce, estate, relocation)? That informs how much negotiation room exists.
- What's the average days-on-market for RENTAL listings here right now (not sales)? A rising rental-DOM trend means longer vacancies and softer asking-rent achievability than the comps imply.
- What's the recent tenant-quality profile in this submarket — average credit score on applications, eviction rate, late-payment / NSF rate, and stable-employment percentage? A property-management company in the area should have these aggregated.
- How much new for-sale + rental construction is in the pipeline within 1–3 miles? Heavy new supply typically softens prices + rents 12–24 months out; constrained supply supports both.
Investment metrics
- 1% rule
- 1.42% ✓
- Cap rate
- 11.81%
- Cash-on-cash
- 19.70%
- DSCR
- 1.88
- GRM
- 5.9
CMA / ARV
- ARV (on-the-fly)
- $164,496
- Comps found
- 12
Show comp detail 12 sales within ~0.75 mi
| Address | Dist | Beds/Ba | Sqft | Sold | Price | $/sf | Match |
|---|---|---|---|---|---|---|---|
| 2501 Ransdell St | 0.00mi | 3/1.5 | 1,104 (0%) | 0mo | $108,000 | $98 | 100 |
| 32 Bakemeyer St | 0.48mi | 3/1.5 | 1,104 (0%) | 2mo | $165,000 | $149 | 76 |
| 44 Bakemeyer St | 0.49mi | 3/2.0 | 1,104 (0%) | 6mo | $177,500 | $161 | 70 |
| 110 Pennsylvania Ct | 0.29mi | 3/1.0 | 1,202 (+9%) | 4mo | $115,000 | $96 | 66 |
| 2825 S Delaware St | 0.46mi | 3/1.0 | 1,035 (-6%) | 6mo | $200,000 | $193 | 61 |
| 806 Cameron St | 0.49mi | 2/1.0 (-1) | 1,034 (-6%) | 1mo | $210,000 | $203 | 58 |
| 2828 S Illinois St | 0.57mi | 3/1.0 | 1,224 (+11%) | 2mo | $182,000 | $149 | 52 |
| 121 W Gimber St | 0.64mi | 3/1.5 | 1,008 (-9%) | 5mo | $193,000 | $191 | 52 |
| 611 Knox St | 0.70mi | 2/1.0 (-1) | 1,125 (+2%) | 7mo | $46,000 | $41 | 52 |
| 321 Gimber Ct | 0.74mi | 3/1.5 | 1,200 (+9%) | 6mo | $182,500 | $152 | 46 |
| 2117 S Pennsylvania St | 0.57mi | 2/1.0 (-1) | 1,229 (+11%) | 4mo | $87,500 | $71 | 44 |
| 532 Bacon St | 0.73mi | 2/2.0 (-1) | 1,208 (+9%) | 4mo | $75,000 | $62 | 40 |
Match score weights: distance 35% · size 25% · config 20% · recency 20%. Top-matched comps best support the ARV.
Projected returns pro-forma
-3.0% appreciation · 8.0% rent growth · sell at horizon
- IRR
- 17.2%
- Equity multiple
- 1.74×
- Total profit
- $20,572
- Equity at exit
- $14,895
- IRR
- 29.0%
- Equity multiple
- 4.21×
- Total profit
- $89,764
- Equity at exit
- $8,638
Cash invested: $27,972 (down + closing). Projections, not guarantees.
Landlord ↔ Tenant lean methodology
- Overall (STATE)
- 90 Strongly Landlord-Friendly
- State Indiana
- 90 Strongly Landlord-Friendly · R+11
- County
- — inherits STATE
- City
- — inherits STATE
ZIP-level market 46225
- Home prices YoY
- -8.2%
- Rents YoY
- 11.0%
- Active inventory
- 131
- Price-to-rent
- 5.9×
Monthly cashflow live
- Estimated rent
- $1,421 high interval (Pro) →
- Mortgage (P&I)
- −$524
- Tax from tax record
- −$98 /mo · $1,171/yr
- Insurance
- −$42
- HOA
- −$0
- Vacancy / Maint / Mgmt
- −$298
- Net cashflow
- $459
Break-even live
Sensitivity live
| Price | -10% $516 | -5% $487 | +0% $459 | +5% $431 | +10% $403 |
|---|---|---|---|---|---|
| Rent | -10% $347 | -5% $403 | +0% $459 | +5% $515 | +10% $571 |
| Rate | -1.0pp $510 | -0.5pp $485 | base $459 | +0.5pp $433 | +1.0pp $407 |
UW: 25.0% down · 7.5% · 30yr · 1.5% tax · 5.0% vac · 8.0% maint · 8.0% mgmt
Financing live
Cash to close
- Down payment
- $24,975
- Closing costs
- $2,997
- Reserves months
- —
- Total cash needed
- —
Loan-product check · same deal, 3 products live
Conventional
25% down · 7.5% · 30yr
- Down + closing
- —
- Monthly P&I
- —
- Monthly cashflow
- —
- DSCR
- —
- Eligible?
- —
Personal DTI + credit; lowest rate.
DSCR
20% down · 8.5% · 30yr
- Down + closing
- —
- Monthly P&I
- —
- Monthly cashflow
- —
- DSCR
- —
- Eligible?
- —
No personal income docs; deal must DSCR.
Hard money
10% down · 12.0% · 12mo
- Down + closing
- —
- Monthly P&I
- —
- Monthly cashflow
- —
- DSCR
- —
- Eligible?
- —
Short-term bridge; refi at stabilization.
Rent comps 40 comps
| Address | Beds | Baths | Sqft | Rent | $/sqft | DOM | Units | Dist |
|---|---|---|---|---|---|---|---|---|
| 265 E Southern Ave Indianapolis, IN | 1.0–2.0 | 1.0 | 800 | $1,150 | $1.44 | 4d | 2 | 0.15mi |
| 110 Pennsylvania Ct Indianapolis, IN | 3.0 | 2.0 | 1202 | $1,700 | $1.41 | 6d | 1 | 0.30mi |
| 2760 S East St Indianapolis, IN | 2.0–3.0 | 2.0 | 1072 | $1,045 | $0.97 | 5d | 3 | 0.33mi |
| 2770 S East St Apt 103 Indianapolis, IN | 3.0 | 2.0 | 1190 | $1,045 | $0.88 | 16d | 1 | 0.34mi |
| 2770 South East St Unit 302 Indianapolis, IN | 3.0 | 2.0 | 1158 | $1,015 | $0.88 | 4d | 1 | 0.34mi |
| 2236 Ransdell St Indianapolis, IN | 2.0 | 1.0 | 850 | $1,150 | $1.35 | 45d | 1 | 0.35mi |
| 2209 Ransdell St Indianapolis, IN | 2.0 | 1.0 | 710 | $900 | $1.27 | 45d | 1 | 0.40mi |
| 2314 Union St Indianapolis, IN | 3.0 | 2.0 | 892 | $1,295 | $1.45 | 45d | 1 | 0.44mi |
| 2859 S Meridian St Indianapolis, IN | 1.0–2.0 | 1.0 | 771 | $906 | $1.17 | 45d | 2 | 0.56mi |
| 2859 S Meridian St Indianapolis, IN | 1.0–2.0 | 1.0 | 771 | $906 | $1.17 | 25d | 2 | 0.56mi |
| 2109 Singleton St Indianapolis, IN | 3.0 | 2.0 | 1340 | $2,100 | $1.57 | 9d | 1 | 0.58mi |
| 1011 E Raymond St Indianapolis, IN | 2.0 | 2.0 | 1100 | $1,350 | $1.23 | 25d | 1 | 0.65mi |
| 438 E Beecher St Indianapolis, IN | 3.0 | 2.5 | 1500 | $1,450 | $0.97 | 25d | 1 | 0.75mi |
| 620 E Beecher St Indianapolis, IN | 3.0 | 2.0 | 1072 | $1,639 | $1.53 | 21d | 1 | 0.77mi |
| 1144 McDougal St Indianapolis, IN | 3.0 | 1.0 | 876 | $1,500 | $1.71 | 23d | 1 | 0.77mi |
| 2948 Shelby St Unit D Indianapolis, IN | 2.0 | 1.0 | 750 | $1,025 | $1.37 | 45d | 1 | 0.80mi |
| 1833 Orleans St Unit 1 Indianapolis, IN | 3.0 | 1.0 | 1260 | $1,350 | $1.07 | 45d | 1 | 0.85mi |
| 1819 Union St Unit 1817 Indianapolis, IN | 3.0 | 2.0 | 1020 | $1,199 | $1.18 | 45d | 1 | 0.86mi |
| 1756 Delaware St Indianapolis, IN | 3.0 | 2.0 | 1014 | $1,300 | $1.28 | 45d | 1 | 0.87mi |
| 1756 S Delaware St Unit 1754 Indianapolis, IN | 3.0 | 2.0 | 1014 | $1,300 | $1.28 | 16d | 1 | 0.87mi |
| 224 Iowa St Indianapolis, IN | 3.0 | 1.0 | 1254 | $1,450 | $1.16 | 25d | 1 | 0.88mi |
| 823 Iowa St Indianapolis, IN | 2.0 | 1.0 | 812 | $1,100 | $1.35 | 45d | 1 | 0.93mi |
| 823 Iowa St Indianapolis, IN | 2.0 | 1.0 | 812 | $1,100 | $1.35 | 0d | 1 | 0.93mi |
| 1861 Barth Ave Unit 1861 Indianapolis, IN | 2.0 | 1.0 | 1300 | $1,600 | $1.23 | 25d | 1 | 0.95mi |
| 11 Iowa St Indianapolis, IN | 2.0 | 1.0 | 1176 | $1,595 | $1.36 | 0d | 1 | 0.96mi |
| 512 E Minnesota St Unit 203 Indianapolis, IN | 2.0 | 1.0 | 903 | $1,195 | $1.32 | 25d | 1 | 0.97mi |
| 1549 Nelson Ave Indianapolis, IN | 3.0 | 1.0 | 950 | $1,380 | $1.45 | 45d | 1 | 0.98mi |
| 1117 E Naomi St Indianapolis, IN | 2.0 | 1.5 | 976 | $1,450 | $1.49 | 0d | 1 | 1.01mi |
| 2020 Boyd Ave Indianapolis, IN | 3.0 | 1.5 | 1160 | $1,450 | $1.25 | 25d | 1 | 1.03mi |
| 2018 Boyd Ave Indianapolis, IN | 3.0 | 1.5 | 1160 | $1,350 | $1.16 | 45d | 1 | 1.03mi |
| 1604 E Kelly St Indianapolis, IN | 2.0 | 1.0 | 750 | $1,025 | $1.37 | 19d | 1 | 1.05mi |
| 1604 E Kelly St Indianapolis, IN | 2.0 | 1.0 | 800 | $1,025 | $1.28 | 12d | 1 | 1.05mi |
| 944 E Minnesota St Indianapolis, IN | 2.0 | 2.0 | 944 | $1,299 | $1.38 | 45d | 1 | 1.06mi |
| 1637 Hoefgen St Indianapolis, IN | 2.0 | 1.0 | 780 | $1,000 | $1.28 | 45d | 1 | 1.07mi |
| 1436 S New Jersey St Unit A Indianapolis, IN | 3.0 | 2.5 | 1300 | $2,100 | $1.62 | 25d | 1 | 1.11mi |
| 1439 South East St Indianapolis, IN | 2.0 | 2.0 | 1114 | $1,425 | $1.28 | 22d | 1 | 1.11mi |
| 1439 South East St Indianapolis, IN | 2.0 | 2.0 | 1114 | $1,425 | $1.28 | 0d | 1 | 1.11mi |
| 1437 S East St Indianapolis, IN | 2.0 | 2.0 | 1114 | $1,425 | $1.28 | 45d | 1 | 1.12mi |
| 835 Weghorst St Unit 837 Indianapolis, IN | 3.0 | 1.5 | 1500 | $1,399 | $0.93 | 25d | 1 | 1.13mi |
| 3312 Olive St Indianapolis, IN | 3.0 | 2.0 | 1000 | $1,395 | $1.40 | 25d | 1 | 1.13mi |
Listing history 4 events
-
2026-06-02status $99,900 Pending 4 DOM
-
2026-06-01days on market $99,900 Active 4 DOM
-
2026-05-31days on market $99,900 Active 3 DOM
-
2026-05-27$99,900 Active
ⓘ Source: listings_history table (triggers on properties + properties_extension) + one-shot
backfill from property_details.listing_events for pre-trigger history.
Tax reassessment forecast IN · Partial reset (capped growth)
- Current annual tax
- $1,171 · $98/mo
- Projected year-2 tax
- $1,171 · $98/mo
- Expected delta
- $0/yr ($0/mo · 0.0%)
ⓘ Screening estimate from a state-policy table — verify with the county assessor before closing.
Climate risk First Street
- Flood 4/10 Moderate FEMA zone X (unshaded) · 23% chance over 30 yrs
- Wildfire 1/10 Low
- Heat 4/10 Moderate 7 d/yr ≥101°F today · 19 d/yr by 30 yrs out
- Wind 2/10 Low 0% chance of damaging wind over 30 yrs
- Air quality 3/10 Moderate 2 unhealthy d/yr today · 3 by 30 yrs out
Nearby sold comps map
Loading sold comps map…
Walkable amenities ~0.75 mi
Loading nearby amenities…
Taxation est. · year 1
- Rental income
- $17,047
- − Mortgage interest
- −$5,596
- − Property taxes
- −$1,171
- − Insurance
- −$500
- − Repairs & maintenance
- −$1,364
- − Management
- −$1,364
- − Depreciation
- −$2,906
- Taxable income
- $4,147
- Est. tax owed @ 24.0%
- −$995
- After-tax cash flow
- $4,515/yr
For passive investors: Depreciation is non-cash, so a rental often shows a tax loss while cash-flowing — sheltering income. Rental losses are passive: they offset passive income freely, and up to $25,000/yr can offset ordinary (W-2) income if you actively participate and your MAGI is under $100k (phasing out to $0 by $150k); unused losses carry forward. On sale, claimed depreciation is recaptured at up to 25%, and gains may owe capital-gains tax (a 1031 exchange can defer both). Figures are a year-1 estimate at your 24.0% rate — not tax advice; consult a CPA.
Schools (NCES district)
- District
- Indianapolis Public Schools
- NCES district ID
- 1804770
- Math proficiency
- 14% ▼ -7.00%
- Reading proficiency
- 20% ▼ -3.00%
- Median HH income
- $32,034
- Composite
- 13.69/100
- National rank
- #9499
- State rank
- #286 of 301 in IN
Livability — Indianapolis city (balance)
No livability data for this city. (Only ~50 U.S. cities are tracked.)
Census & demographics
- Census place
- Indianapolis city (balance), IN
- County
- Marion County · 998,460 people
- City population
- 881,119
- Metro
- Indianapolis-Carmel-Anderson, IN
- Population (ZIP)
- 6,037
- Household income
- $55,190
- Rent vs Own
- Severe rent burden
- 311.0
Population outlook (Marion County) Hauer SSP2
- Today (2025)
- 1,025,572 people
- By 2030
- 1,065,727 · +3.9%
- By 2040
- 1,141,577 · +11.3%
- By 2050
- 1,208,920 · +17.9%
- By 2075
- 1,367,288 · +33.3%
- By 2100
- 1,438,201 · +40.2%
Race, ethnicity, and origin ACS 2023
- Neighborhood character
- Predominantly White (68%)
- Race & ethnicity
- White 68% Two or more races 12% Black 11% Hispanic / Latino 10% Asian 2%
- Hispanic origin (detail)
- Mexican 6%
- Common ancestry
- Romanian 2% Italian 2% Slovak 1%
- Foreign-born
- 9% · Canada
- Languages at home
- 88% English-only · Spanish 10% German/W. Germanic 1%
Political lean MEDSL · Marion
- 2024 margin
- Strong D (+27.7) · D 63.0% · R 35.3% · Other 1.7%
- 2008→2024 swing
- -0.7pp no change · 2008: 28.4pp · 2024: 27.7pp
- All cycles
- 2024: D+27.7 2020: D+29.1 2016: D+22.8 2012: D+22.2 2008: D+28.4
Not yet ingested
- Civics
- —
Market trends
- HPI YoY
- ▼ -36.19%
- Current HPI
- 403.9271
- Rent YoY
- ▲ 10.98%
- Metro
- Indianapolis-Carmel-Anderson, IN
- State GDP YoY
- ▲ 2.90%
- F500 in state
- 18
Industry mix (Fortune 500 HQ in IN)
| Industry | F500 HQs | Revenue |
|---|---|---|
| Industrial Machinery | 2 | $37B |
|
||
| Healthcare | 1 | $177B |
|
||
| Pharmaceuticals | 1 | $45B |
|
||
| Metals / Steel | 1 | $18B |
|
||
| Agriculture | 1 | $17B |
|
||
| Packaging | 1 | $12B |
|
||
Price history
1 event — show timeline
- 2026-05-27 Listed $99,900 MIBOR as Distributed by MLS Grid
Property tax history
+8.1%/yrLatest (2025): $1,171 · +2.3% YoY. Source: county tax records.
Cash-flow waterfall
monthlySold comps — $/sqft
last 12 mo · ≤1 miLoading sold comps…