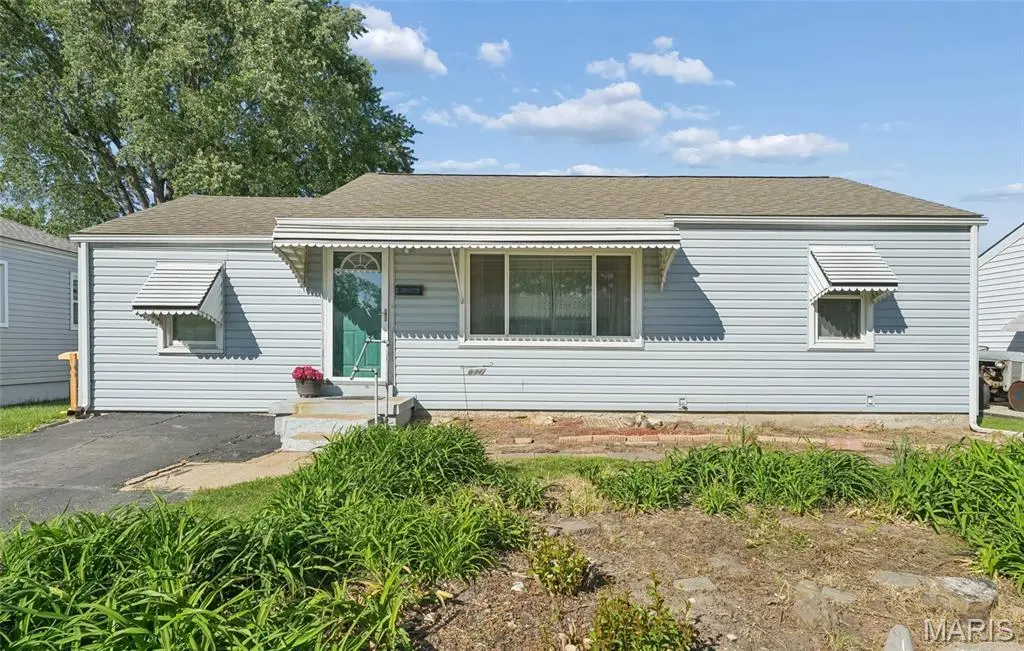
831 Loekes Dr · Florissant, MO
Flood risk 1/10 · Minimal
- FEMA flood zone
- X (unshaded)
- Chance of flooding over 30 yrs
- 0.0%
- Est. flood insurance / yr
- $473 – $860
Fire risk 1/10 · Minimal
- Est. fire insurance / yr
- $1,054 – $1,958
Heat risk 4/10 · Minor
- Hot days now (above 105°F)
- 7 days/yr
- Hot days in 30 yrs
- 21 days/yr
Wind risk 2/10 · Minimal
- Chance of severe wind over 30 yrs
- 1.0%
Air-quality risk 3/10 · Minor
- Unhealthy air days now
- 3 days/yr
- Unhealthy air days in 30 yrs
- 5 days/yr
Risk factors via First Street. Map © Google.
Why this score? — see what drove the B grade
The composite is a weighted blend of 9 inputs, each scored 0–100. Each bar is that input's sub-score; the figure is the points it added to the 100-point composite (weight × sub-score).
- Cash flow +29.4/30.0
- ARV discount +15.0/15.0
- DSCR +10.0/10.0
- 1% rule +8.1/10.0
- Livability +3.7/5.0
- Rent growth +3.6/5.0
- Condition / age +2.5/5.0
- Schools +1.7/10.0
- Appreciation +0.0/10.0
$115,000
🖨 Deal sheet 📄 Offer letter ✓ Due diligence
Listing remarks
A wonderful opportunity for an owner-occupant or investor, this 3-bedroom 1-bath home has much to offer. A functional layout with some hardwood floors, eat-in kitchen and a spacious, unfinished basement just to name a few. There is a deck conveniently located off the kitchen, providing access to the flat and fenced backyard – a perfect place to unwind, entertain and enjoy the day. The shed protects and stores all your lawn equipment and is included with the sale. Close to shopping, restaurants, parks and highways – everything you need is close by! Come make this home yours or add to your portfolio. Fantastic value for buyers looking to build equity with minor improvements. House
Key facts
- Unfinished basement
- Flat backyard
- Deck
Tags
Property features AI
Finance
- Other: No home warranty indicated
- Financial info: Lease not considered
Exterior
- Utilities: Public water; Public sewer; Electric service by Ameren; Natural gas available; Phone available; Electricity available; Water available
- Home design: Single family residence; One level
- Construction: Unknown construction materials; Basement (unfinished, 8 ft+ pour)
- Exterior features: Deck; Awnings; Back yard; Chain link fenced yard
Interior
- Kitchen: Eat-in kitchen
- Bedrooms: 3 bedrooms, all on the main level
- Flooring: Laminate flooring; Wood flooring
- Bathrooms: 1 full bathroom (main level)
- Heating & cooling: Natural gas heating; Central air conditioning; Ceiling fan(s)
- Interior features: Bookcases; Ceiling fans; Eat-in kitchen
- Laundry & utility: Laundry in basement
Neighborhood map
What this means for you Summary
Snapshot
- This is a 3-bed/1.0-bath single-family listed at $115k.
Deal economics
- At list price, monthly cash flow is $407 ($5k/yr) — positive.
- The deal already cash-flows at list — no discount required.
- Meets the 1% rule at list price ($2k rent vs $115k).
- Recommended offer: $113k (1.5% below list) — sets the bar for market timing.
- Cap rate 10.5% vs local median 6.3% in Florissant — top-decile yield for the area; either an underpriced asset or a hidden risk that comps aren't pricing in. Stress-test before assuming the spread holds.
Location & tenants
- Location reads 73/100 on livability (#82 in MO) — a middle-class / working-renter tenant base. Strengths: cost of living A+, housing A+, health & safety B+; Watch: crime C-, amenities D+, commute F.
- Hazelwood (suburban): math 11% / reading 26% proficiency, ranked #306 of 324 in MO (top 94%) — low school quality limits family demand, transient renter base, plan for 1-2y turnover.
- Zoned schools: Mccurdy Elem. (math 12% / reading 27%, grade F, #941 of 1,115 statewide, top 86%, 329 students, 67% FRL); Hazelwood West High (math 16% / reading 42%, grade F, #407 of 521 statewide, top 78%, 2,042 students, 54% FRL).
- Market conditions: Rents rising fast (+4.3%/yr); 271 active listings in the ZIP; 40 comparable units currently listed for rent nearby; rentals at typical pace (median 16d on market — plan ~3-4 weeks tenant-placement turnaround); 920 units permitted in St. Louis County in 2024 (250 in 5+ unit buildings).
Forward outlook
- Local home prices are declining (-3.0%/yr); year-one equity from $795 of loan paydown is wiped out by about $3k of value loss. Plan a longer hold.
- At projected returns (-3.0% appreciation + 4.3% rent growth), your $32k cash investment doubles in ~8 years — after that, you're playing with house money.
Negotiation context
- It's been on market 29 days — a 2% lower offer ($113k) is reasonable based on typical stale-listing flexibility.
Risks & watch-outs
- Watch-outs: built in 1955 — expect roof / HVAC / electrical / plumbing capex.
Questions for the listing agent
- Built in 1955 — when were the roof, HVAC, electrical panel, plumbing, and water heater last replaced?
- Is there a deadline driving the sale (1031 exchange, divorce, estate, relocation)? That informs how much negotiation room exists.
- Schools are D-rated, which usually means shorter tenancies and higher turnover. Who's the typical renter profile here, and what's been the actual vacancy rate?
- What's the average days-on-market for RENTAL listings here right now (not sales)? A rising rental-DOM trend means longer vacancies and softer asking-rent achievability than the comps imply.
- What's the recent tenant-quality profile in this submarket — average credit score on applications, eviction rate, late-payment / NSF rate, and stable-employment percentage? A property-management company in the area should have these aggregated.
- How much new for-sale + rental construction is in the pipeline within 1–3 miles? Heavy new supply typically softens prices + rents 12–24 months out; constrained supply supports both.
Investment metrics
- 1% rule
- 1.31% ✓
- Cap rate
- 10.54%
- Cash-on-cash
- 15.18%
- DSCR
- 1.68
- GRM
- 6.3
CMA / ARV
- ARV (median comp)
- $146,332
- List price
- $115,000
- Delta
- -21.41%
- Verdict
- UNDERPRICED
- Comps
- 20 within 1.0 mi
Show comp detail 12 sales within ~0.75 mi
| Address | Dist | Beds/Ba | Sqft | Sold | Price | $/sf | Match |
|---|---|---|---|---|---|---|---|
| 19 Blanchette Dr | 0.23mi | 3/2.0 | 1,118 (+8%) | 2mo | $169,900 | $152 | 70 |
| 737 Charbonier Rd | 0.17mi | 3/2.0 | 1,171 (+14%) | 2mo | $79,900 | $68 | 64 |
| 1065 Keeven Ln | 0.39mi | 3/1.0 | 888 (-14%) | 1mo | $198,575 | $224 | 58 |
| 290 Francisca Dr | 0.68mi | 3/1.5 | 1,092 (+6%) | 1mo | $145,000 | $133 | 55 |
| 1370 Flicker Dr | 0.75mi | 3/2.0 | 1,008 (-2%) | 3mo | $150,000 | $149 | 55 |
| 715 Gonzaga Ln | 0.61mi | 3/2.5 | 1,092 (+6%) | 2mo | $200,000 | $183 | 54 |
| 85 Ruth Dr | 0.43mi | 2/1.0 (-1) | 912 (-12%) | 2mo | $144,900 | $159 | 54 |
| 720 Babler Dr | 0.45mi | 3/1.0 | 892 (-14%) | 3mo | $145,000 | $163 | 54 |
| 695 Mullanphy Rd | 0.65mi | 3/1.0 | 927 (-10%) | 1mo | $185,000 | $200 | 52 |
| 715 Tyson Dr | 0.60mi | 3/1.5 | 927 (-10%) | 3mo | $179,900 | $194 | 51 |
| 10 Garnier Ct | 0.71mi | 3/1.5 | 960 (-7%) | 3mo | $125,000 | $130 | 51 |
| 1435 Aspen Dr | 0.72mi | 3/1.0 | 912 (-12%) | 1mo | $134,000 | $147 | 46 |
Match score weights: distance 35% · size 25% · config 20% · recency 20%. Top-matched comps best support the ARV.
Projected returns pro-forma
-3.0% appreciation · 4.27% rent growth · sell at horizon
- IRR
- 7.3%
- Equity multiple
- 1.29×
- Total profit
- $9,291
- Equity at exit
- $17,147
- IRR
- 17.7%
- Equity multiple
- 2.55×
- Total profit
- $49,819
- Equity at exit
- $9,943
Cash invested: $32,200 (down + closing). Projections, not guarantees.
Landlord ↔ Tenant lean methodology
- Overall (STATE)
- 81 Strongly Landlord-Friendly
- State Missouri
- 81 Strongly Landlord-Friendly · R+10
- County
- — inherits STATE
- City
- — inherits STATE
ZIP-level market 63031
- Rents YoY
- 4.3%
- Active inventory
- 271
- Price-to-rent
- 6.3×
Monthly cashflow live
- Estimated rent
- $1,512 high interval (Pro) →
- Mortgage (P&I)
- −$603
- Tax from tax record
- −$136 /mo · $1,633/yr
- Insurance
- −$48
- HOA
- −$0
- Vacancy / Maint / Mgmt
- −$318
- Net cashflow
- $407
Break-even live
UW: 25.0% down · 7.5% · 30yr · 1.5% tax · 5.0% vac · 8.0% maint · 8.0% mgmt
Financing live
Cash to close
- Down payment
- $28,750
- Closing costs
- $3,450
- Reserves months
- —
- Total cash needed
- —
Loan-product check · same deal, 3 products live
Conventional
25% down · 7.5% · 30yr
- Down + closing
- —
- Monthly P&I
- —
- Monthly cashflow
- —
- DSCR
- —
- Eligible?
- —
Personal DTI + credit; lowest rate.
DSCR
20% down · 8.5% · 30yr
- Down + closing
- —
- Monthly P&I
- —
- Monthly cashflow
- —
- DSCR
- —
- Eligible?
- —
No personal income docs; deal must DSCR.
Hard money
10% down · 12.0% · 12mo
- Down + closing
- —
- Monthly P&I
- —
- Monthly cashflow
- —
- DSCR
- —
- Eligible?
- —
Short-term bridge; refi at stabilization.
Rent comps 40 comps
| Address | Beds | Baths | Sqft | Rent | $/sqft | DOM | Units | Dist |
|---|---|---|---|---|---|---|---|---|
| 1015 Lindsay Ln Florissant, MO | 3.0 | 2.0 | 988 | $1,600 | $1.62 | 23d | 1 | 0.38mi |
| 9 Charlotte Dr Florissant, MO | 3.0 | 1.5 | 1404 | $1,641 | $1.17 | 4d | 1 | 0.39mi |
| 765 Babler Dr Florissant, MO | 3.0 | 2.0 | 888 | $1,700 | $1.91 | 7d | 1 | 0.45mi |
| 13 Bruce Dr Unit Bruce 13-2 Florissant, MO | 2.0 | 1.0 | 880 | $975 | $1.11 | 43d | 1 | 0.48mi |
| 13 Bruce Dr Florissant, MO | 2.0 | 1.0 | 880 | $975 | $1.11 | 23d | 1 | 0.48mi |
| 14 Bruce Dr Unit Bruce 14-4 Florissant, MO | 2.0 | 1.0 | 880 | $975 | $1.11 | 43d | 1 | 0.49mi |
| 785 Florland Dr Florissant, MO | 3.0 | 1.0 | 1100 | $1,700 | $1.55 | 17d | 1 | 0.50mi |
| 855 Daniel Boone Dr Florissant, MO | 3.0 | 1.0 | 964 | $1,400 | $1.45 | 43d | 1 | 0.50mi |
| 4 Sharon Ct Florissant, MO | 3.0 | 2.0 | 1108 | $1,800 | $1.62 | 2d | 1 | 0.51mi |
| 1145 Swallow Ln Florissant, MO | 3.0 | 2.0 | 1288 | $1,645 | $1.28 | 3d | 1 | 0.73mi |
| 470 Hundley Dr Florissant, MO | 3.0 | 2.0 | 962 | $1,595 | $1.66 | 43d | 1 | 0.74mi |
| 155 Reeb Ln Apt 2 Florissant, MO | 2.0 | 1.0 | 850 | $995 | $1.17 | 43d | 1 | 0.75mi |
| 1540 Aspen Dr Florissant, MO | 3.0 | 2.0 | 912 | $1,395 | $1.53 | 7d | 1 | 0.76mi |
| 167 Reeb Ln Florissant, MO | 1.0–2.0 | 1.0 | 850 | $1,300 | $1.53 | 2d | 4 | 0.78mi |
| 21 Quick Dr Apt 1 Florissant, MO | 2.0 | 1.0 | 850 | $1,100 | $1.29 | 43d | 1 | 0.83mi |
| 21 Quick Dr Apt 3 Florissant, MO | 2.0 | 1.0 | 850 | $995 | $1.17 | 23d | 1 | 0.83mi |
| 1395 Bluebird Dr Florissant, MO | 3.0 | 2.0 | 1168 | $1,599 | $1.37 | 16d | 1 | 0.84mi |
| 23 Quick Dr Apt 2 Florissant, MO | 2.0 | 1.0 | 850 | $1,100 | $1.29 | 43d | 1 | 0.84mi |
| 858 Hazelvalley Dr Hazelwood, MO | 3.0 | 1.5 | 912 | $1,450 | $1.59 | 43d | 1 | 0.87mi |
| 1095 Humes Ln Florissant, MO | 3.0 | 1.5 | 1100 | $1,650 | $1.50 | 4d | 1 | 1.01mi |
| 3 Champlain Ct Florissant, MO | 3.0 | 1.0 | 1100 | $1,600 | $1.45 | 43d | 1 | 1.06mi |
| 240 Chez Vant Ct Hazelwood, MO | 2.0 | 1.5 | 1440 | $1,350 | $0.94 | 43d | 1 | 1.10mi |
| 9 Saint Celeste Dr Florissant, MO | 3.0 | 1.0 | 992 | $1,450 | $1.46 | 43d | 1 | 1.10mi |
| 10 Saint Celeste Dr Florissant, MO | 2.0 | 1.0 | 716 | $1,290 | $1.80 | 12d | 1 | 1.11mi |
| 305 S Lafayette St Florissant, MO | 3.0 | 1.0 | 864 | $1,409 | $1.63 | 16d | 1 | 1.16mi |
| 446 Olian Dr Hazelwood, MO | 2.0 | 1.0 | 880 | $975 | $1.11 | 2d | 1 | 1.17mi |
| 1315 Bobolink Dr Florissant, MO | 3.0 | 2.0 | 1025 | $1,700 | $1.66 | 12d | 1 | 1.18mi |
| 2245 Lindsay Ln Florissant, MO | 4.0 | 2.0 | 1466 | $1,800 | $1.23 | 16d | 1 | 1.20mi |
| 2400 Teakwood Manor Dr Florissant, MO | 3.0 | 2.0 | 1380 | $1,725 | $1.25 | 43d | 1 | 1.24mi |
| 2160 Splendor Dr Florissant, MO | 3.0 | 2.0 | 1100 | $1,800 | $1.64 | 3d | 1 | 1.25mi |
| 7404 Olian Dr Hazelwood, MO | 2.0 | 1.0 | 870 | $925 | $1.06 | 43d | 1 | 1.25mi |
| 1710 Kay Dr Florissant, MO | 3.0 | 1.0 | 960 | $1,500 | $1.56 | 2d | 1 | 1.26mi |
| 2280 Keeven Ln Florissant, MO | 1.0–3.0 | 1.0–1.5 | 805 | $1,290 | $1.60 | 1d | 14 | 1.31mi |
| 1095 Cedar Pl Florissant, MO | 3.0 | 1.5 | 1107 | $1,710 | $1.54 | 1d | 1 | 1.32mi |
| 2485 Jenkee Dr Florissant, MO | 3.0 | 1.0 | 960 | $1,376 | $1.43 | 1d | 1 | 1.35mi |
| 1045 N New Florissant Rd Florissant, MO | 2.0 | 1.0 | 783 | $1,250 | $1.60 | 14d | 1 | 1.39mi |
| 1004 N New Florissant Rd Florissant, MO | 2.0 | 1.0 | 719 | $1,375 | $1.91 | 23d | 1 | 1.41mi |
| 7437 Hazelcrest Dr Unit H Hazelwood, MO | 3.0 | 1.0 | 1000 | $1,000 | $1.00 | 7d | 1 | 1.43mi |
| 330 Moule Dr Florissant, MO | 3.0 | 1.0 | 1014 | $1,575 | $1.55 | 43d | 1 | 1.44mi |
| 1545 Swan Dr Florissant, MO | 3.0 | 1.0 | 1064 | $1,590 | $1.49 | 7d | 1 | 1.46mi |
Listing history 2 events
-
2026-05-14price $115,000 784-char remark
-
2026-04-23$125,000 Active 784-char remark
ⓘ Source: listings_history table (triggers on properties + properties_extension) + one-shot
backfill from property_details.listing_events for pre-trigger history.
Tax reassessment forecast MO · Resets to sale price
- Current annual tax
- $1,633 · $136/mo
- Projected year-2 tax
- $1,633 · $136/mo
- Expected delta
- $0/yr ($0/mo · 0.0%)
ⓘ Screening estimate from a state-policy table — verify with the county assessor before closing.
Climate risk First Street
- Flood 1/10 Low FEMA zone X (unshaded) · 0% chance over 30 yrs
- Wildfire 1/10 Low
- Heat 4/10 Moderate 7 d/yr ≥105°F today · 21 d/yr by 30 yrs out
- Wind 2/10 Low 100% chance of damaging wind over 30 yrs
- Air quality 3/10 Moderate 3 unhealthy d/yr today · 5 by 30 yrs out
Nearby sold comps map
Loading sold comps map…
Walkable amenities ~0.75 mi
Loading nearby amenities…
Taxation est. · year 1
- Rental income
- $18,145
- − Mortgage interest
- −$6,442
- − Property taxes
- −$1,633
- − Insurance
- −$575
- − Repairs & maintenance
- −$1,452
- − Management
- −$1,452
- − Depreciation
- −$3,345
- Taxable income
- $3,246
- Est. tax owed @ 24.0%
- −$779
- After-tax cash flow
- $4,110/yr
For passive investors: Depreciation is non-cash, so a rental often shows a tax loss while cash-flowing — sheltering income. Rental losses are passive: they offset passive income freely, and up to $25,000/yr can offset ordinary (W-2) income if you actively participate and your MAGI is under $100k (phasing out to $0 by $150k); unused losses carry forward. On sale, claimed depreciation is recaptured at up to 25%, and gains may owe capital-gains tax (a 1031 exchange can defer both). Figures are a year-1 estimate at your 24.0% rate — not tax advice; consult a CPA.
Schools (NCES district)
- District
- Hazelwood
- NCES district ID
- 2913830
- Math proficiency
- 11% ▼ -13.00%
- Reading proficiency
- 26% ▼ -6.00%
- Median HH income
- $51,621
- Composite
- 16.77/100
- National rank
- #9156
- State rank
- #306 of 324 in MO
Livability — Florissant
- Score
- 73/100
- State rank
- #82
- US rank
- #5406
Category grades
Schools grade is shown separately in the Schools card above.
Census & demographics
- Census place
- Florissant, MO
- County
- Saint Louis County · 888,823 people
- City population
- 69,104
- Metro
- St. Louis, MO-IL
- Population (ZIP)
- 50,196
- Household income
- $70,811
- Rent vs Own
- Severe rent burden
- 1279.0
Population outlook (St. Louis County) Hauer SSP2
- Today (2025)
- 1,025,227 people
- By 2030
- 1,028,023 · +0.3%
- By 2040
- 1,020,940 · -0.4%
- By 2050
- 1,007,280 · -1.8%
- By 2075
- 987,277 · -3.7%
- By 2100
- 921,984 · -10.1%
Race, ethnicity, and origin ACS 2023
- Neighborhood character
- Diverse neighborhood (Simpson 0.58)
- Race & ethnicity
- White 49% Black 41% Two or more races 7% Hispanic / Latino 2%
- Common ancestry
- Romanian 3% Lithuanian 3% Swedish 1%
- Foreign-born
- 5% · Canada, Jamaica
- Languages at home
- 94% English-only · Spanish 2% Arabic 1%
Political lean MEDSL · St. Louis
- 2024 margin
- Strong D (+23.4) · D 60.8% · R 37.4% · Other 1.7%
- 2008→2024 swing
- +3.5pp toward D · 2008: 19.9pp · 2024: 23.4pp
- All cycles
- 2024: D+23.4 2020: D+24.0 2016: D+16.2 2012: D+13.7 2008: D+19.9
Not yet ingested
- Civics
- —
Market trends
- HPI YoY
- ▼ -223.57%
- Current HPI
- 202.7192
- Rent YoY
- ▲ 4.27%
- Metro
- St. Louis, MO-IL
- State GDP YoY
- ▲ 1.84%
- F500 in state
- 20
Industry mix (Fortune 500 HQ in MO)
| Industry | F500 HQs | Revenue |
|---|---|---|
| Healthcare | 1 | $163B |
|
||
| Insurance | 1 | $21B |
|
||
| Industrial Technology | 1 | $17B |
|
||
| Retail | 1 | $16B |
|
||
| Industrial Distribution | 1 | $10B |
|
||
| Utilities | 1 | $9B |
|
||
Price history
-8.0% since first listed3 events — show timeline
- 2026-05-22 Pending — MARIS as Distributed by MLS Grid
- 2026-05-14 Price Changed $115,000 MARIS as Distributed by MLS Grid
- 2026-04-23 Listed $125,000 MARIS as Distributed by MLS Grid
Property tax history
+0.6%/yrLatest (2022): $1,633 · +2.6% YoY. Source: county tax records.
Cash-flow waterfall
monthlySold comps — $/sqft
last 12 mo · ≤1 miLoading sold comps…