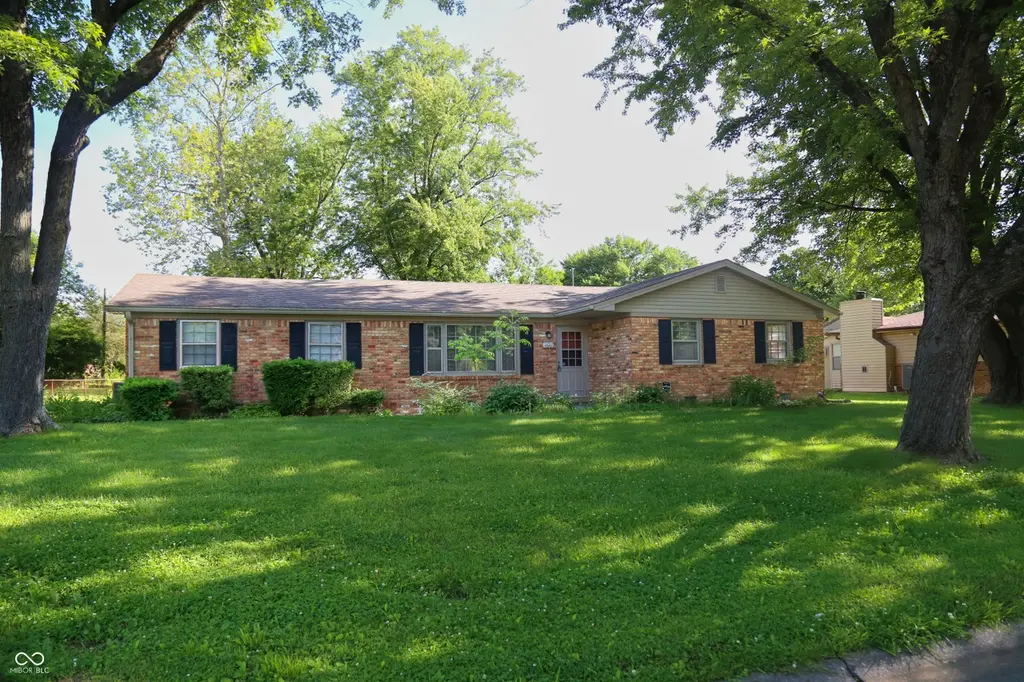
4365 Windsor Rd · Brownsburg, IN
Flood risk 1/10 · Minimal
- FEMA flood zone
- X (unshaded)
- Chance of flooding over 30 yrs
- 0.0%
- Est. flood insurance / yr
- $507 – $1,088
Fire risk 1/10 · Minimal
- Est. fire insurance / yr
- $717 – $1,331
Heat risk 3/10 · Minor
- Hot days now (above 100°F)
- 7 days/yr
- Hot days in 30 yrs
- 19 days/yr
Wind risk 2/10 · Minimal
- Chance of severe wind over 30 yrs
- 1.0%
Air-quality risk 4/10 · Minor
- Unhealthy air days now
- 4 days/yr
- Unhealthy air days in 30 yrs
- 5 days/yr
Risk factors via First Street. Map © Google.
Why this score? — see what drove the C grade
The composite is a weighted blend of 9 inputs, each scored 0–100. Each bar is that input's sub-score; the figure is the points it added to the 100-point composite (weight × sub-score).
- Cash flow +17.1/30.0
- ARV discount +12.1/15.0
- Schools +6.3/10.0
- DSCR +5.3/10.0
- 1% rule +4.6/10.0
- Rent growth +4.1/5.0
- Livability +3.8/5.0
- Condition / age +2.5/5.0
- Appreciation +0.0/10.0
$199,500
🖨 Deal sheet 📄 Offer letter ✓ Due diligence
Listing remarks
A charming custom home, desirable neighborhood, mature trees, Brownsburg schools! All brick home with amazing opportunity to buy- home is move in ready with great original features + opportunity to put in your own personal cosmetic touches and priced accordingly to do so! Upon entry, original hardwoods through main living space & bedrms, built in shelving, natural light throughout! Kitchen has original character but potential for modern touch if buyer chooses. From kitchen, access to oversized garage with space to park + room for storage or a workshop. Expansive, private setting backyard with private back patio! Primary bedroom + full en suite and 2 additional bedrooms, good closet sp
Key facts
- Original hardwoods
- Built in shelving
- Custom home
Tags
Property features AI
Finance
- Other: Approximately 0.34-acre lot (about 1/4–1/2 acre)
Exterior
- Parking: Attached garage with garage door opener (1-car); Asphalt driveway
- Utilities: Public water; Municipal sewer connected; Electricity connected; Cable available
- Home design: Single-family residence; One-level (single story)
- Construction: Brick and wood siding exterior; Crawl space foundation
- Exterior features: Patio; Mature trees and small trees; Street lights
Interior
- Kitchen: Dishwasher; Disposal; Electric oven; Refrigerator; Breakfast room adjacent to kitchen
- Bedrooms: 3 bedrooms on the main level
- Flooring: Hardwood floors
- Bathrooms: 2 full bathrooms; Primary bathroom with full tub
- Heating & cooling: Electric forced-air heating; Central air conditioning
- Interior features: Attic access; Breakfast bar; Built-in features; Hardwood floors; Smoke alarm
Neighborhood map
What this means for you Summary
Snapshot
- This is a 3-bed/2.0-bath single-family listed at $200k.
Deal economics
- At list price, monthly cash flow is $140 ($2k/yr) — positive.
- The deal already cash-flows at list — no discount required.
- To meet the 1% rule (rent ≥ 1% of price), the offer needs to be $191k (4.5% below list).
- Recommended offer: $191k (4.5% below list) — sets the bar for 1% rule.
- Cap rate 7.1% vs local median 3.8% in Brownsburg — top-decile yield for the area; either an underpriced asset or a hidden risk that comps aren't pricing in. Stress-test before assuming the spread holds.
Location & tenants
- Location reads 75/100 on livability (#61 in IN, #4,105 nationally) — a middle-class / working-renter tenant base. Strengths: schools A+, crime A+, employment A+; Watch: amenities F, commute F, health & safety F.
- Brownsburg Community School Corporation (suburban): math 72% / reading 72% proficiency, ranked #2 of 301 in IN (top 1%) — strong family-tenant draw, lease renewals of 3-5y typical; only 17% free/reduced lunch — higher-income household profile.
- Market conditions: Rents rising fast (+6.3%/yr); 328 active listings in the ZIP; 1 comparable units currently listed for rent nearby; high-income renter base; 1,294 units permitted in Hendricks County in 2024 (18 in 5+ unit buildings).
Forward outlook
- Local home prices are declining (-3.0%/yr); year-one equity from $1k of loan paydown is wiped out by about $6k of value loss. Plan a longer hold.
- Hendricks County population projected at +35% by 2050 — long-run rental-demand tailwind backs the buy-and-hold thesis.
Negotiation context
- Only 3 days on market — expect competitive offers; lowballing is unlikely to land.
Questions for the listing agent
- Built in 1968 — when were the roof, HVAC, electrical panel, plumbing, and water heater last replaced?
- Is there a deadline driving the sale (1031 exchange, divorce, estate, relocation)? That informs how much negotiation room exists.
- Schools are A-rated — typically a magnet for longer-tenancy family renters. What's the average tenant stay here, and is there a school-zone premium baked into asking?
- What's the average days-on-market for RENTAL listings here right now (not sales)? A rising rental-DOM trend means longer vacancies and softer asking-rent achievability than the comps imply.
- What's the recent tenant-quality profile in this submarket — average credit score on applications, eviction rate, late-payment / NSF rate, and stable-employment percentage? A property-management company in the area should have these aggregated.
- How much new for-sale + rental construction is in the pipeline within 1–3 miles? Heavy new supply typically softens prices + rents 12–24 months out; constrained supply supports both.
Investment metrics
- 1% rule
- 0.96% ✗
- Cap rate
- 7.13%
- Cash-on-cash
- 3.00%
- DSCR
- 1.13
- GRM
- 8.7
CMA / ARV
- ARV (on-the-fly)
- $222,336
- Comps found
- 12
Show comp detail 12 sales within ~0.75 mi
| Address | Dist | Beds/Ba | Sqft | Sold | Price | $/sf | Match |
|---|---|---|---|---|---|---|---|
| 4471 Stuart Dr | 0.16mi | 3/1.0 | 1,092 (-5%) | 4mo | $223,000 | $204 | 76 |
| 4358 Windsor Rd | 0.04mi | 3/1.5 | 1,131 (-2%) | 22mo | $227,000 | $201 | 75 |
| 4419 Charles Dr | 0.54mi | 3/1.0 | 1,152 (0%) | 1mo | $185,000 | $161 | 70 |
| 10685 E County Road 450 N | 0.14mi | 3/1.5 | 1,184 (+3%) | 22mo | $175,000 | $148 | 69 |
| 4232 Clifford Rd | 0.14mi | 3/2.0 | 1,296 (+12%) | 5mo | $200,000 | $154 | 69 |
| 4430 Chatham Dr | 0.07mi | 3/2.5 | 1,316 (+14%) | 7mo | $275,000 | $209 | 65 |
| 4325 Aspen Dr | 0.29mi | 3/2.0 | 1,298 (+13%) | 5mo | $257,500 | $198 | 61 |
| 4125 Outer Bank Rd | 0.25mi | 3/2.0 | 1,218 (+6%) | 23mo | $235,000 | $193 | 59 |
| 4315 Raintree Rd | 0.21mi | 3/2.0 | 1,270 (+10%) | 17mo | $250,000 | $197 | 59 |
| 4333 N County Road 1000 E | 0.60mi | 3/1.0 | 1,086 (-6%) | 5mo | $195,000 | $180 | 54 |
| 4389 Allen Dr | 0.47mi | 4/1.0 (+1) | 1,308 (+14%) | 6mo | $164,000 | $125 | 41 |
| 4357 N County Road 1000 E | 0.60mi | 3/1.0 | 1,292 (+12%) | 20mo | $179,900 | $139 | 31 |
Match score weights: distance 35% · size 25% · config 20% · recency 20%. Top-matched comps best support the ARV.
Projected returns pro-forma
-3.0% appreciation · 6.31% rent growth · sell at horizon
- IRR
- -7.9%
- Equity multiple
- 0.70×
- Total profit
- $-16,847
- Equity at exit
- $29,746
- IRR
- 5.4%
- Equity multiple
- 1.46×
- Total profit
- $25,678
- Equity at exit
- $17,249
Cash invested: $55,860 (down + closing). Projections, not guarantees.
Landlord ↔ Tenant lean methodology
- Overall (STATE)
- 90 Strongly Landlord-Friendly
- State Indiana
- 90 Strongly Landlord-Friendly · R+11
- County
- — inherits STATE
- City
- — inherits STATE
ZIP-level market 46112
- Rents YoY
- 6.3%
- Active inventory
- 328
- Price-to-rent
- 8.7×
Monthly cashflow live
- Estimated rent
- $1,905 medium interval (Pro) →
- Mortgage (P&I)
- −$1,046
- Tax from tax record
- −$236 /mo · $2,834/yr
- Insurance
- −$83
- HOA
- −$0
- Vacancy / Maint / Mgmt
- −$400
- Net cashflow
- $140
Break-even live
UW: 25.0% down · 7.5% · 30yr · 1.5% tax · 5.0% vac · 8.0% maint · 8.0% mgmt
Financing live
Cash to close
- Down payment
- $49,875
- Closing costs
- $5,985
- Reserves months
- —
- Total cash needed
- —
Loan-product check · same deal, 3 products live
Conventional
25% down · 7.5% · 30yr
- Down + closing
- —
- Monthly P&I
- —
- Monthly cashflow
- —
- DSCR
- —
- Eligible?
- —
Personal DTI + credit; lowest rate.
DSCR
20% down · 8.5% · 30yr
- Down + closing
- —
- Monthly P&I
- —
- Monthly cashflow
- —
- DSCR
- —
- Eligible?
- —
No personal income docs; deal must DSCR.
Hard money
10% down · 12.0% · 12mo
- Down + closing
- —
- Monthly P&I
- —
- Monthly cashflow
- —
- DSCR
- —
- Eligible?
- —
Short-term bridge; refi at stabilization.
Rent comps 1 comps
| Address | Beds | Baths | Sqft | Rent | $/sqft | DOM | Units | Dist |
|---|---|---|---|---|---|---|---|---|
| 10251-10705 US Highway 136 Indianapolis, IN | 2.0 | 1.0–2.0 | 625 | $1,350 | $2.16 | 20d | 1 | 0.59mi |
Listing history 3 events
-
2026-06-02status $199,500 Pending 3 DOM
-
2026-06-01days on market $199,500 Active 3 DOM
-
2026-05-31days on market $199,500 Active 2 DOM
ⓘ Source: listings_history table (triggers on properties + properties_extension) + one-shot
backfill from property_details.listing_events for pre-trigger history.
Tax reassessment forecast IN · Partial reset (capped growth)
- Current annual tax
- $2,834 · $236/mo
- Projected year-2 tax
- $2,834 · $236/mo
- Expected delta
- $0/yr ($0/mo · 0.0%)
ⓘ Screening estimate from a state-policy table — verify with the county assessor before closing.
Climate risk First Street
- Flood 1/10 Low FEMA zone X (unshaded) · 0% chance over 30 yrs
- Wildfire 1/10 Low
- Heat 3/10 Moderate 7 d/yr ≥100°F today · 19 d/yr by 30 yrs out
- Wind 2/10 Low 100% chance of damaging wind over 30 yrs
- Air quality 4/10 Moderate 4 unhealthy d/yr today · 5 by 30 yrs out
Nearby sold comps map
Loading sold comps map…
Walkable amenities ~0.75 mi
Loading nearby amenities…
Taxation est. · year 1
- Rental income
- $22,865
- − Mortgage interest
- −$11,175
- − Property taxes
- −$2,834
- − Insurance
- −$998
- − Repairs & maintenance
- −$1,829
- − Management
- −$1,829
- − Depreciation
- −$5,804
- Taxable loss
- −$1,604
- Est. tax savings @ 24.0%
- +$385
- After-tax cash flow
- $2,062/yr
For passive investors: Depreciation is non-cash, so a rental often shows a tax loss while cash-flowing — sheltering income. Rental losses are passive: they offset passive income freely, and up to $25,000/yr can offset ordinary (W-2) income if you actively participate and your MAGI is under $100k (phasing out to $0 by $150k); unused losses carry forward. On sale, claimed depreciation is recaptured at up to 25%, and gains may owe capital-gains tax (a 1031 exchange can defer both). Figures are a year-1 estimate at your 24.0% rate — not tax advice; consult a CPA.
Schools (NCES district)
- District
- Brownsburg Community School Corporation
- NCES district ID
- 1801020
- Math proficiency
- 72% ▼ -5.00%
- Reading proficiency
- 72% ▼ -4.00%
- Median HH income
- $75,304
- Composite
- 63.45/100
- National rank
- #616
- State rank
- #2 of 301 in IN
Livability — Brownsburg
- Score
- 75/100
- State rank
- #61
- US rank
- #4105
Category grades
Schools grade is shown separately in the Schools card above.
Census & demographics
- County
- Hendricks County · 143,373 people
- City population
- 44,220
- Metro
- Indianapolis-Carmel-Anderson, IN
- Population (ZIP)
- 44,220
- Household income
- $112,565
- Rent vs Own
- Severe rent burden
- 614.0
Population outlook (Hendricks County) Hauer SSP2
- Today (2025)
- 187,418 people
- By 2030
- 201,494 · +7.5%
- By 2040
- 228,487 · +21.9%
- By 2050
- 253,068 · +35.0%
- By 2075
- 308,920 · +64.8%
- By 2100
- 336,510 · +79.6%
Race, ethnicity, and origin ACS 2023
- Neighborhood character
- Predominantly White (83%)
- Race & ethnicity
- White 83% Black 10% Two or more races 4% Hispanic / Latino 4%
- Common ancestry
- Slovak 3% Iranian 2% Romanian 2%
- Foreign-born
- 6% · Canada, China
- Languages at home
- 93% English-only · Spanish 2% French/Haitian/Cajun 1%
Political lean MEDSL · Hendricks
- 2024 margin
- Strong R (+21.5) · D 38.4% · R 59.9% · Other 1.7%
- 2008→2024 swing
- +1.9pp toward D · 2008: -23.4pp · 2024: -21.5pp
- All cycles
- 2024: R+21.5 2020: R+23.9 2016: R+34.2 2012: R+34.9 2008: R+23.4
Not yet ingested
- Civics
- —
Market trends
- HPI YoY
- ▼ -135.99%
- Current HPI
- 217.3787
- Rent YoY
- ▲ 6.31%
- Metro
- Indianapolis-Carmel-Anderson, IN
- State GDP YoY
- ▲ 2.90%
- F500 in state
- 18
Industry mix (Fortune 500 HQ in IN)
| Industry | F500 HQs | Revenue |
|---|---|---|
| Industrial Machinery | 2 | $37B |
|
||
| Healthcare | 1 | $177B |
|
||
| Pharmaceuticals | 1 | $45B |
|
||
| Metals / Steel | 1 | $18B |
|
||
| Agriculture | 1 | $17B |
|
||
| Packaging | 1 | $12B |
|
||
Price history
1 event — show timeline
- 2026-05-29 Listed $199,500 MIBOR as Distributed by MLS Grid
Property tax history
+2.7%/yrLatest (2025): $2,834 · +0.0% YoY. Source: county tax records.
Cash-flow waterfall
monthlySold comps — $/sqft
last 12 mo · ≤1 miLoading sold comps…