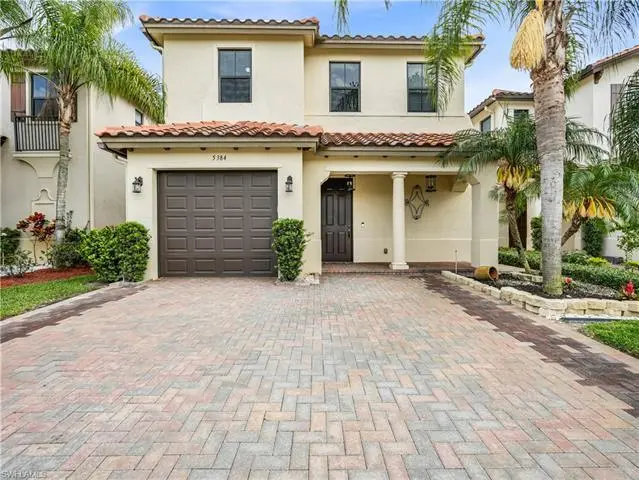
5384 Brin Way · Ave Maria, FL
Flood risk 1/10 · Minimal
- FEMA flood zone
- X (unshaded)
- Chance of flooding over 30 yrs
- 0.0%
- Est. flood insurance / yr
- $507 – $1,088
Fire risk 3/10 · Minor
- Est. fire insurance / yr
- $947 – $1,759
Heat risk 10/10 · Severe
- Hot days now (above 111°F)
- 7 days/yr
- Hot days in 30 yrs
- 29 days/yr
Wind risk 10/10 · Severe
- Chance of severe wind over 30 yrs
- 99.0%
Air-quality risk 2/10 · Minimal
- Unhealthy air days now
- 0 days/yr
- Unhealthy air days in 30 yrs
- 1 days/yr
Risk factors via First Street. Map © Google.
Why this score? — see what drove the B grade
The composite is a weighted blend of 9 inputs, each scored 0–100. Each bar is that input's sub-score; the figure is the points it added to the 100-point composite (weight × sub-score).
- Cash flow +28.9/30.0
- DSCR +10.0/10.0
- 1% rule +8.3/10.0
- ARV discount +7.5/15.0
- Schools +5.0/10.0
- Appreciation +4.5/10.0
- Rent growth +3.2/5.0
- Livability +2.5/5.0
- Condition / age +2.5/5.0
$349,900
🖨 Deal sheet 📄 Offer letter ✓ Due diligence
Listing remarks
Welcome to Lake views, walking distance to the heart of Ave Maria to a beautifully kept home, where everyday living is elevated by comfort, abundant natural light, and serene water views in the heart of Ave Maria. This home features 3-bedroom, 2.5-bath that offers a thoughtfully designed layout that feels both open and inviting. The main living areas flow effortlessly, creating a warm space for gathering, relaxing, and making lasting family memories. Upstairs, you’ll find generously sized bedrooms filled with natural light, including a serene primary suite designed for comfort. Tile flooring throughout the main living areas and laminate floors upstairs offer a seamless blen
Key facts
- Spacious kitchen
- Private back patio
- Steps from shopping
Tags
Property features AI
Finance
- Other: Part of Coquina at Maple Ridge subdivision (35 units in complex); Possession at closing
- HOA & community: Mandatory HOA (Non-gated community); Quarterly HOA fee of $212; Monthly master association fee of $94.55; HOA covers cable, internet/WiFi, irrigation water, lawn/land maintenance, management, pest control (interior & exterior), sewer, trash removal, legal/accounting; Community amenities include clubhouse, community pool, community spa/hot tub, exercise room, community park, community room, bike and jog path; Developer-managed; Total annual recurring fees: $1,988
Exterior
- Parking: Attached 1-car garage; Detached 2-space carport
- Utilities: Central water; Central sewer; Cable available
- Home design: Single-family residence; Two-story design; Located in Ave Maria community
- Construction: Concrete block construction; Stucco exterior finish; Tile roof; Built in 2016; Single hung windows
- Exterior features: Patio; Lake view / waterfront on a lake; Rear exposure faces south
Interior
- Kitchen: Dishwasher; Disposal; Microwave; Refrigerator/Freezer
- Bedrooms: 3 bedrooms
- Flooring: Laminate; Tile
- Bathrooms: 2 full bathrooms; 1 half bathroom; Master bath with dual sinks and shower (no tub)
- Heating & cooling: Central electric heating; Central electric cooling
- Interior features: Built-in cabinets; Smoke detectors; Open porch/lanai; See remarks for additional interior details
- Laundry & utility: Washer; Dryer; Auto garage door opener
Neighborhood map
What this means for you Summary
Snapshot
- This is a 3-bed/2.5-bath single-family listed at $350k.
Deal economics
- At list price, monthly cash flow is $1k ($14k/yr) — positive.
- The deal already cash-flows at list — no discount required.
- Meets the 1% rule at list price ($5k rent vs $350k).
- Recommended offer: $339k (3.0% below list) — sets the bar for market timing.
Location & tenants
- Location reads: area grade B — affects rentability + tenant quality, not the cash-flow math above.
- Collier (suburban): math 60% / reading 56% proficiency, ranked #16 of 73 in FL (top 22%) — acceptable for families but not a draw, mixed tenant base, ~2y average lease.
- Market conditions: Rents rising (+3.0%/yr); 449 active listings in the ZIP; 13 comparable units currently listed for rent nearby; rentals at typical pace (median 23d on market — plan ~3-4 weeks tenant-placement turnaround); 3,520 units permitted in Collier County in 2024 (959 in 5+ unit buildings).
- At $4,656/mo this rent would consume 90% of the median local household income ($62k/yr) (locally 1093% of renters already pay >50% of income on rent) — very limited rent-growth headroom before tenants either downsize or default.
Forward outlook
- Local home prices are declining (-1.1%/yr); year-one equity from $2k of loan paydown is wiped out by about $4k of value loss. Plan a longer hold.
- Collier County population projected at +30% by 2050 — long-run rental-demand tailwind backs the buy-and-hold thesis.
- At projected returns (-1.1% appreciation + 3.0% rent growth), your $98k cash investment doubles in ~6 years — after that, you're playing with house money.
Negotiation context
- It's been on market 35 days — a 3% lower offer ($339k) is reasonable based on typical stale-listing flexibility.
Risks & watch-outs
- Climate carrying-cost: severe wind risk, 99% chance of damaging wind over 30y; extreme-heat days projected 7→29/yr by 2055 (HVAC capex compounding) — expect insurance premiums to compound above CPI over the hold.
Questions for the listing agent
- It's been on market 35 days. Have you received any prior offers? Is the seller open to a 3% concession, seller financing, or rate buy-down credit?
- What does the HOA fee cover, when was the last increase, and are there any pending special assessments or reserve-fund shortfalls?
- Is there a deadline driving the sale (1031 exchange, divorce, estate, relocation)? That informs how much negotiation room exists.
- What's the average days-on-market for RENTAL listings here right now (not sales)? A rising rental-DOM trend means longer vacancies and softer asking-rent achievability than the comps imply.
- What's the recent tenant-quality profile in this submarket — average credit score on applications, eviction rate, late-payment / NSF rate, and stable-employment percentage? A property-management company in the area should have these aggregated.
- How much new for-sale + rental construction is in the pipeline within 1–3 miles? Heavy new supply typically softens prices + rents 12–24 months out; constrained supply supports both.
Investment metrics
- 1% rule
- 1.33% ✓
- Cap rate
- 10.35%
- Cash-on-cash
- 14.50%
- DSCR
- 1.65
- GRM
- 6.3
CMA / ARV
No comps found within radius.
Projected returns pro-forma
-1.05% appreciation · 2.95% rent growth · sell at horizon
- IRR
- 11.0%
- Equity multiple
- 1.49×
- Total profit
- $48,165
- Equity at exit
- $83,652
- IRR
- 17.1%
- Equity multiple
- 2.70×
- Total profit
- $166,250
- Equity at exit
- $87,153
Cash invested: $97,972 (down + closing). Projections, not guarantees.
Landlord ↔ Tenant lean methodology
- Overall (STATE)
- 87 Strongly Landlord-Friendly
- State Florida
- 87 Strongly Landlord-Friendly · R+3
- County
- — inherits STATE
- City
- — inherits STATE
ZIP-level market 34142
- Home prices YoY
- -0.5%
- Rents YoY
- 3.0%
- Active inventory
- 449
- Price-to-rent
- 6.3×
Monthly cashflow live
- Estimated rent
- $4,656 high interval (Pro) →
- Mortgage (P&I)
- −$1,835
- Tax from tax record
- −$349 /mo · $4,191/yr
- Insurance
- −$146
- HOA
- −$165
- Vacancy / Maint / Mgmt
- −$978
- Net cashflow
- $1,184
Break-even live
UW: 25.0% down · 7.5% · 30yr · 1.5% tax · 5.0% vac · 8.0% maint · 8.0% mgmt
Financing live
Cash to close
- Down payment
- $87,475
- Closing costs
- $10,497
- Reserves months
- —
- Total cash needed
- —
Loan-product check · same deal, 3 products live
Conventional
25% down · 7.5% · 30yr
- Down + closing
- —
- Monthly P&I
- —
- Monthly cashflow
- —
- DSCR
- —
- Eligible?
- —
Personal DTI + credit; lowest rate.
DSCR
20% down · 8.5% · 30yr
- Down + closing
- —
- Monthly P&I
- —
- Monthly cashflow
- —
- DSCR
- —
- Eligible?
- —
No personal income docs; deal must DSCR.
Hard money
10% down · 12.0% · 12mo
- Down + closing
- —
- Monthly P&I
- —
- Monthly cashflow
- —
- DSCR
- —
- Eligible?
- —
Short-term bridge; refi at stabilization.
Rent comps 13 comps
| Address | Beds | Baths | Sqft | Rent | $/sqft | DOM | Units | Dist |
|---|---|---|---|---|---|---|---|---|
| 5360 Brin Way Ave Maria, FL | 4.0 | 2.5 | 1088 | $2,495 | $2.29 | 23d | 1 | 0.04mi |
| 5527 Double Eagle Cir Unit 3815 Ave Maria, FL | 2.0 | 2.0 | 1120 | $5,795 | $5.17 | 23d | 1 | 0.77mi |
| 5555 Double Eagle Cir #3914 Ave Maria, FL | 2.0 | 2.0 | 1120 | $5,795 | $5.17 | 23d | 1 | 0.83mi |
| 5583 Double Eagle Cir Unit 4143 Ave Maria, FL | 2.0 | 2.0 | 1120 | $5,795 | $5.17 | 23d | 1 | 0.90mi |
| 5583 Double Eagle Cir #4135 Ave Maria, FL | 2.0 | 2.0 | 1120 | $2,195 | $1.96 | 23d | 1 | 0.90mi |
| 5629 Double Eagle Cir Ave Maria, FL | 2.0 | 2.0 | 1120 | $5,495 | $4.91 | 23d | 1 | 0.95mi |
| 5835 Double Eagle CIR #4714 Ave Maria, FL | 2.0 | 2.0 | 1120 | $1,895 | $1.69 | 23d | 1 | 0.97mi |
| 5715 Double Eagle Cir Ave Maria, FL | 2.0 | 2.0 | 1120 | $3,295 | $2.94 | 23d | 1 | 1.03mi |
| 5807 Double Eagle Cir #4635 Ave Maria, FL | 2.0 | 2.0 | 1120 | $5,195 | $4.64 | 23d | 1 | 1.04mi |
| 5749 Double Eagle Cir #4515 Ave Maria, FL | 2.0 | 2.0 | 1120 | $1,995 | $1.78 | 21d | 1 | 1.05mi |
| 6058 National Blvd Ave Maria, FL | 2.0–3.0 | 2.0 | 1210 | $5,795 | $4.79 | 23d | 2 | 1.11mi |
| 6058 National Blvd #335 Ave Maria, FL | 2.0 | 2.0 | 1120 | $5,795 | $5.17 | 13d | 1 | 1.11mi |
| 6034 National Blvd Ave Maria, FL | 2.0 | 2.0 | 1137 | $4,046 | $3.56 | 13d | 3 | 1.13mi |
HOA detail
- Monthly dues
- $165 · $1,980/yr
- Likely covers
- water
Listing history 15 events
-
2026-06-18days on market $349,900 Active 35 DOM
-
2026-06-17days on market $349,900 Active 34 DOM
-
2026-06-16days on market $349,900 Active 33 DOM
-
2026-06-15days on market $349,900 Active 32 DOM
-
2026-06-14days on market $349,900 Active 30 DOM
-
2026-06-10days on market $349,900 Active 27 DOM
-
2026-06-09days on market $349,900 Active 26 DOM
-
2026-06-08days on market $349,900 Active 25 DOM
-
2026-06-07pricedays on market $349,900 Active 24 DOM
-
2026-06-03days on market $369,900 Active 20 DOM
-
2026-06-02days on market $369,900 Active 19 DOM
-
2026-06-01days on market $369,900 Active 18 DOM
-
2026-05-31days on market $369,900 Active 17 DOM
-
2026-05-30days on market $369,900 Active 16 DOM
-
2026-05-14$369,900 Active
ⓘ Source: listings_history table (triggers on properties + properties_extension) + one-shot
backfill from property_details.listing_events for pre-trigger history.
Tax reassessment forecast FL · Resets to sale price
- Current annual tax
- $4,191 · $349/mo
- Projected year-2 tax
- $4,191 · $349/mo
- Expected delta
- $0/yr ($0/mo · 0.0%)
ⓘ Screening estimate from a state-policy table — verify with the county assessor before closing.
Climate risk First Street
- Flood 1/10 Low FEMA zone X (unshaded) · 0% chance over 30 yrs
- Wildfire 3/10 Moderate
- Heat 10/10 Extreme 7 d/yr ≥111°F today · 29 d/yr by 30 yrs out
- Wind 10/10 Extreme 99% chance of damaging wind over 30 yrs
- Air quality 2/10 Low 0 unhealthy d/yr today · 1 by 30 yrs out
Nearby sold comps map
Loading sold comps map…
Walkable amenities ~0.75 mi
Loading nearby amenities…
Taxation est. · year 1
- Rental income
- $55,878
- − Mortgage interest
- −$19,600
- − Property taxes
- −$4,191
- − Insurance
- −$1,750
- − Repairs & maintenance
- −$4,470
- − Management
- −$4,470
- − HOA
- −$1,980
- − Depreciation
- −$10,179
- Taxable income
- $9,238
- Est. tax owed @ 24.0%
- −$2,217
- After-tax cash flow
- $11,987/yr
For passive investors: Depreciation is non-cash, so a rental often shows a tax loss while cash-flowing — sheltering income. Rental losses are passive: they offset passive income freely, and up to $25,000/yr can offset ordinary (W-2) income if you actively participate and your MAGI is under $100k (phasing out to $0 by $150k); unused losses carry forward. On sale, claimed depreciation is recaptured at up to 25%, and gains may owe capital-gains tax (a 1031 exchange can defer both). Figures are a year-1 estimate at your 24.0% rate — not tax advice; consult a CPA.
Schools (NCES district)
- District
- Collier
- NCES district ID
- 1200330
- Math proficiency
- 60% ▼ -4.00%
- Reading proficiency
- 56% ▼ -2.00%
- Median HH income
- $58,275
- Composite
- 50.23/100
- National rank
- #1892
- State rank
- #16 of 73 in FL
Livability — Ave Maria
No livability data for this city. (Only ~50 U.S. cities are tracked.)
Census & demographics
- Census place
- Ave Maria, FL
- County
- Collier County · 396,295 people
- Metro
- Naples-Marco Island, FL
- Population (ZIP)
- 35,149
- Household income
- $62,333
- Rent vs Own
- Severe rent burden
- 1093.0
Population outlook (Collier County) Hauer SSP2
- Today (2025)
- 420,858 people
- By 2030
- 450,054 · +6.9%
- By 2040
- 502,232 · +19.3%
- By 2050
- 544,932 · +29.5%
- By 2075
- 627,203 · +49.0%
- By 2100
- 659,015 · +56.6%
Race, ethnicity, and origin ACS 2023
- Neighborhood character
- Majority Hispanic (63%)
- Race & ethnicity
- Hispanic / Latino 63% Two or more races 39% Black 19% White 16% Native American 7%
- Hispanic origin (detail)
- Mexican 43% Puerto Rican 3% Cuban 2% Dominican 1%
- Common ancestry
- Hispanic 8% Slovak 1% Serbian 1%
- Foreign-born
- 32% · Canada, Jamaica
- Languages at home
- 34% English-only · Spanish 53% French/Haitian/Cajun 12%
Political lean MEDSL · Collier
- 2024 margin
- Solid R (+33.1) · D 33.1% · R 66.2%
- 2008→2024 swing
- -10.6pp toward R · 2008: -22.5pp · 2024: -33.1pp
- All cycles
- 2024: R+33.1 2020: R+24.7 2016: R+26.0 2012: R+30.1 2008: R+22.5
Not yet ingested
- Civics
- —
Market trends
- HPI YoY
- ▼ -1.05%
- Current HPI
- 226.9105
- Rent YoY
- ▲ 2.95%
- Metro
- Naples-Marco Island, FL
- State GDP YoY
- ▲ 3.28%
- F500 in state
- 36
Industry mix (Fortune 500 HQ in FL)
| Industry | F500 HQs | Revenue |
|---|---|---|
| Industrial Technology | 2 | $29B |
|
||
| Insurance | 2 | $17B |
|
||
| Retail | 1 | $60B |
|
||
| Technology Distribution | 1 | $58B |
|
||
| Homebuilding | 1 | $35B |
|
||
| Technology Manufacturing | 1 | $35B |
|
||
Price history
1 event — show timeline
- 2026-05-14 Listed $369,900 NAPLESMLS
Property tax history
+8.4%/yrLatest (2025): $4,191 · +8.7% YoY. Source: county tax records.
Cash-flow waterfall
monthlySold comps — $/sqft
last 12 mo · ≤1 miLoading sold comps…