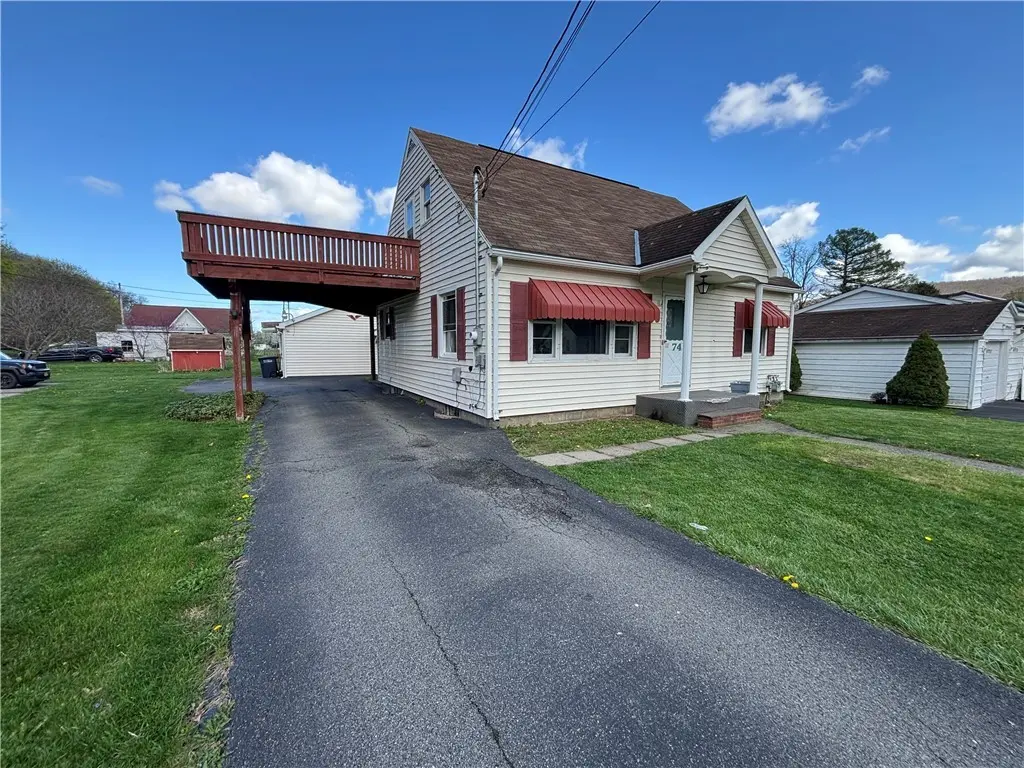
74 Dalrymple Ave · Southport, NY
Flood risk 7/10 · Major
- FEMA flood zone
- X
- Chance of flooding over 30 yrs
- 0.76%
- Est. flood insurance / yr
- $473 – $860
Fire risk 2/10 · Minimal
- Est. fire insurance / yr
- $691 – $1,283
Heat risk 3/10 · Minor
- Hot days now (above 94°F)
- 7 days/yr
- Hot days in 30 yrs
- 16 days/yr
Wind risk 2/10 · Minimal
- Chance of severe wind over 30 yrs
- 1.0%
Air-quality risk 1/10 · Minimal
- Unhealthy air days now
- 0 days/yr
- Unhealthy air days in 30 yrs
- 0 days/yr
Risk factors via First Street. Map © Google.
Why this score? — see what drove the D grade
The composite is a weighted blend of 9 inputs, each scored 0–100. Each bar is that input's sub-score; the figure is the points it added to the 100-point composite (weight × sub-score).
- Cash flow +11.5/30.0
- Appreciation +10.0/10.0
- ARV discount +4.0/15.0
- 1% rule +3.6/10.0
- DSCR +3.4/10.0
- Livability +3.2/5.0
- Rent growth +2.5/5.0
- Condition / age +2.5/5.0
- Schools +2.4/10.0
$179,900
🖨 Deal sheet 📄 Offer letter ✓ Due diligence
Listing remarks MLS
You won’t find properties like this everyday! This charming cape cod in the heart of Pine City has been extremely well maintained, along with having an updated kitchen and bathroom on the first floor. Sitting on a double, corner lot, with a detached garage (currently finished to a studio apartment and is being rented), and has a fenced in backyard. There’s a back deck, and a deck off of the upstairs bedroom giving you perfect options to enjoy the summer weather! The basement is partially finished, so you will never run out of room for guests. The second floor also has a kitchenette, and a half bath, making it a perfect set up to have the second floor as it’s own master suite or even an apartment to bring in more income!
Key facts
- Double corner lot
- Fenced in backyard
- Updated kitchen
Tags
Neighborhood map
What this means for you Summary
Snapshot
- This is a 3-bed/1.5-bath single-family listed at $180k.
Deal economics
- At list price, monthly cash flow is $-115 ($-1k/yr) — negative.
- To cash-flow at today's rent, offer at most $160k (11.3% below list).
- To meet the 1% rule (rent ≥ 1% of price), the offer needs to be $155k (13.9% below list).
- Recommended offer: $155k (13.9% below list) — sets the bar for 1% rule.
Location & tenants
- Location reads 65/100 on livability (#690 in NY) — a middle-class / working-renter tenant base. Strengths: cost of living A+, housing A; Watch: schools D+, employment D, health & safety D.
- Elmira City School District (urban): math 23% / reading 35% proficiency, ranked #580 of 590 in NY (top 98%) — low school quality limits family demand, transient renter base, plan for 1-2y turnover.
- Market conditions: 25 active listings in the ZIP; 2 comparable units currently listed for rent nearby; 91 units permitted in Chemung County in 2024 (63 in 5+ unit buildings).
Forward outlook
- In year one you build about $19k of equity ($1k loan paydown + $18k appreciation (10.0% local appreciation)).
- Chemung County population projected at -17% by 2050 — secular population decline; favor cash flow + early exit over multi-decade hold.
- By year 2, paydown + projected appreciation supports a ~$31k cash-out refi (75% LTV) — recoverable capital for the next deal without selling this one.
Negotiation context
- It's been on market 58 days — a 3% lower offer ($175k) is reasonable based on typical stale-listing flexibility.
Risks & watch-outs
- Watch-outs: flood insurance adds $56/mo; built in 1958 — expect roof / HVAC / electrical / plumbing capex.
- Climate carrying-cost: major flood risk — expect insurance premiums to compound above CPI over the hold.
Questions for the listing agent
- What do current leases actually rent for vs. the listed asking? Can we see a recent rent roll and the last 12 months of T-12 income?
- It's been on market 58 days. Have you received any prior offers? Is the seller open to a 14% concession, seller financing, or rate buy-down credit?
- Built in 1958 — when were the roof, HVAC, electrical panel, plumbing, and water heater last replaced?
- What's the actual annual flood-insurance premium (NFIP or private), and is the property in a SFHA with mandatory coverage?
- Is there a deadline driving the sale (1031 exchange, divorce, estate, relocation)? That informs how much negotiation room exists.
- Schools are D-rated, which usually means shorter tenancies and higher turnover. Who's the typical renter profile here, and what's been the actual vacancy rate?
- Crime grade is D in this area — have there been break-ins, vandalism, or insurance claims at this property in the last 3 years? What carrier currently insures it and at what premium?
- The area grade is low — what's the realistic commute time and amenity access for the typical tenant pool here? Any planned neighborhood developments (good or bad) we should know about?
- What's the average days-on-market for RENTAL listings here right now (not sales)? A rising rental-DOM trend means longer vacancies and softer asking-rent achievability than the comps imply.
- What's the recent tenant-quality profile in this submarket — average credit score on applications, eviction rate, late-payment / NSF rate, and stable-employment percentage? A property-management company in the area should have these aggregated.
- How much new for-sale + rental construction is in the pipeline within 1–3 miles? Heavy new supply typically softens prices + rents 12–24 months out; constrained supply supports both.
Investment metrics
- 1% rule
- 0.86% ✗
- Cap rate
- 5.90%
- Cash-on-cash
- -1.41%
- DSCR
- 0.94
- GRM
- 9.7
CMA / ARV
- ARV (median comp)
- $167,044
- List price
- $179,900
- Delta
- 7.70%
- Verdict
- FAIR
- Comps
- 20 within 1.0 mi
Show comp detail 11 sales within ~0.75 mi
| Address | Dist | Beds/Ba | Sqft | Sold | Price | $/sf | Match |
|---|---|---|---|---|---|---|---|
| 34 Crestview Dr W | 0.45mi | 4/1.5 (+1) | 1,640 (-1%) | 8mo | $160,000 | $98 | 65 |
| 1234 Pennsylvania Ave | 0.37mi | 3/1.0 | 1,575 (-5%) | 11mo | $175,000 | $111 | 63 |
| 1003 Sycamore Cir | 0.57mi | 3/1.0 | 1,740 (+5%) | 2mo | $180,900 | $104 | 62 |
| 825 Hazel St | 0.54mi | 3/1.5 | 1,500 (-10%) | 4mo | $150,000 | $100 | 55 |
| 766 Laurel St | 0.73mi | 3/1.5 | 1,680 (+1%) | 12mo | $127,000 | $76 | 54 |
| 810 Sycamore St | 0.46mi | 2/1.0 (-1) | 1,544 (-7%) | 7mo | $125,000 | $81 | 54 |
| 957 Sebring Ave | 0.19mi | 3/1.0 | 1,416 (-15%) | 20mo | $179,900 | $127 | 48 |
| 26 Greatsinger Dr | 0.62mi | 3/2.0 | 1,456 (-12%) | 1mo | $240,000 | $165 | 47 |
| 760 Spruce St | 0.62mi | 3/1.0 | 1,523 (-8%) | 10mo | $112,000 | $74 | 46 |
| 752 Thompson St | 0.70mi | 3/2.0 | 1,488 (-11%) | 12mo | $25,000 | $17 | 38 |
| 1113 Country Ln | 0.69mi | 3/2.0 | 1,774 (+7%) | 23mo | $231,000 | $130 | 36 |
Match score weights: distance 35% · size 25% · config 20% · recency 20%. Top-matched comps best support the ARV.
Projected returns pro-forma
10.0% appreciation · 3.0% rent growth · sell at horizon
- IRR
- 22.4%
- Equity multiple
- 2.80×
- Total profit
- $90,763
- Equity at exit
- $162,068
- IRR
- 20.1%
- Equity multiple
- 6.42×
- Total profit
- $273,184
- Equity at exit
- $349,506
Cash invested: $50,372 (down + closing). Projections, not guarantees.
Landlord ↔ Tenant lean methodology
- Overall (STATE)
- 15 Strongly Tenant-Friendly
- State New York
- 15 Strongly Tenant-Friendly · D+10
- County
- — inherits STATE
- City
- — inherits STATE
ZIP-level market 14871
- Home prices YoY
- 9.9%
- Active inventory
- 25
- Price-to-rent
- 9.7×
Monthly cashflow live
- Estimated rent
- $1,550 medium interval (Pro) →
- Mortgage (P&I)
- −$943
- Tax from tax record
- −$265 /mo · $3,178/yr
- Insurance
- −$75
- Flood insurance flood zone
- −$56 /mo · $666/yr
- HOA
- −$0
- Vacancy / Maint / Mgmt
- −$325
- Net cashflow
- $-115
Break-even live
UW: 25.0% down · 7.5% · 30yr · 1.5% tax · 5.0% vac · 8.0% maint · 8.0% mgmt
Financing live
Cash to close
- Down payment
- $44,975
- Closing costs
- $5,397
- Reserves months
- —
- Total cash needed
- —
Loan-product check · same deal, 3 products live
Conventional
25% down · 7.5% · 30yr
- Down + closing
- —
- Monthly P&I
- —
- Monthly cashflow
- —
- DSCR
- —
- Eligible?
- —
Personal DTI + credit; lowest rate.
DSCR
20% down · 8.5% · 30yr
- Down + closing
- —
- Monthly P&I
- —
- Monthly cashflow
- —
- DSCR
- —
- Eligible?
- —
No personal income docs; deal must DSCR.
Hard money
10% down · 12.0% · 12mo
- Down + closing
- —
- Monthly P&I
- —
- Monthly cashflow
- —
- DSCR
- —
- Eligible?
- —
Short-term bridge; refi at stabilization.
Rent comps 2 comps
| Address | Beds | Baths | Sqft | Rent | $/sqft | DOM | Units | Dist |
|---|---|---|---|---|---|---|---|---|
| 550 Spruce St Unit 303 Elmira, NY | 2.0 | 2.0 | 1350 | $1,350 | $1.00 | 43d | 1 | 0.75mi |
| 419 Jefferson St Unit A Elmira, NY | 2.0 | 2.0 | 1100 | $1,995 | $1.81 | 43d | 1 | 1.36mi |
Listing history 17 events
-
2026-06-19days on market $179,900 Active 58 DOM
-
2026-06-18days on market $179,900 Active 57 DOM
-
2026-06-17days on market $179,900 Active 56 DOM
-
2026-06-16days on market $179,900 Active 55 DOM
-
2026-06-15days on market $179,900 Active 54 DOM
-
2026-06-14days on market $179,900 Active 52 DOM
-
2026-06-12days on market $179,900 Active 51 DOM
-
2026-06-09days on market $179,900 Active 48 DOM
-
2026-06-08days on market $179,900 Active 47 DOM
-
2026-06-07days on market $179,900 Active 46 DOM
-
2026-06-05days on market $179,900 Active 43 DOM
-
2026-06-03days on market $179,900 Active 42 DOM
-
2026-06-02days on market $179,900 Active 41 DOM
-
2026-06-01days on market $179,900 Active 40 DOM
-
2026-05-31days on market $179,900 Active 39 DOM
-
2026-05-30days on market $179,900 Active 38 DOM
-
2026-04-22$179,900 Active 747-char remark
Show marketing remark (747 chars)
You won’t find properties like this everyday! This charming cape cod in the heart of Pine City has been extremely well maintained, along with having an updated kitchen and bathroom on the first floor. Sitting on a double, corner lot, with a detached garage (currently finished to a studio apartment and is being rented), and has a fenced in backyard. There’s a back deck, and a deck off of the upstairs bedroom giving you perfect options to enjoy the summer weather! The basement is partially finished, so you will never run out of room for guests. The second floor also has a kitchenette, and a half bath, making it a perfect set up to have the second floor as it’s own master suite or even an apartment to bring in more income!
ⓘ Source: listings_history table (triggers on properties + properties_extension) + one-shot
backfill from property_details.listing_events for pre-trigger history.
Tax reassessment forecast NY · Partial reset (capped growth)
- Current annual tax
- $3,178 · $265/mo
- Projected year-2 tax
- $3,178 · $265/mo
- Expected delta
- $0/yr ($0/mo · 0.0%)
ⓘ Screening estimate from a state-policy table — verify with the county assessor before closing.
Climate risk First Street
- Flood 7/10 Severe FEMA zone X · 76% chance over 30 yrs
- Wildfire 2/10 Low
- Heat 3/10 Moderate 7 d/yr ≥94°F today · 16 d/yr by 30 yrs out
- Wind 2/10 Low 100% chance of damaging wind over 30 yrs
- Air quality 1/10 Low 0 unhealthy d/yr today · 0 by 30 yrs out
Nearby sold comps map
Loading sold comps map…
Walkable amenities ~0.75 mi
Loading nearby amenities…
Taxation est. · year 1
- Rental income
- $18,595
- − Mortgage interest
- −$10,077
- − Property taxes
- −$3,178
- − Insurance
- −$1,566
- − Repairs & maintenance
- −$1,488
- − Management
- −$1,488
- − Depreciation
- −$5,233
- Taxable loss
- −$4,435
- Est. tax savings @ 24.0%
- +$1,064
- After-tax cash flow
- $-311/yr
For passive investors: Depreciation is non-cash, so a rental often shows a tax loss while cash-flowing — sheltering income. Rental losses are passive: they offset passive income freely, and up to $25,000/yr can offset ordinary (W-2) income if you actively participate and your MAGI is under $100k (phasing out to $0 by $150k); unused losses carry forward. On sale, claimed depreciation is recaptured at up to 25%, and gains may owe capital-gains tax (a 1031 exchange can defer both). Figures are a year-1 estimate at your 24.0% rate — not tax advice; consult a CPA.
Schools (NCES district)
- District
- Elmira City School District
- NCES district ID
- 3610560
- Math proficiency
- 23% ▼ -7.00%
- Reading proficiency
- 35% ▲ 7.00%
- Median HH income
- $40,180
- Composite
- 24.39/100
- National rank
- #7688
- State rank
- #580 of 590 in NY
Livability — Southport
- Score
- 65/100
- State rank
- #690
- US rank
- #13026
Category grades
Schools grade is shown separately in the Schools card above.
Census & demographics
- Census place
- Southport, NY
- Population (ZIP)
- 4,497
Population outlook (Chemung County) Hauer SSP2
- Today (2025)
- 82,931 people
- By 2030
- 80,356 · -3.1%
- By 2040
- 74,745 · -9.9%
- By 2050
- 69,012 · -16.8%
- By 2075
- 55,689 · -32.8%
- By 2100
- 41,428 · -50.0%
Race, ethnicity, and origin ACS 2023
- Neighborhood character
- Predominantly White (98%)
- Race & ethnicity
- White 98% Two or more races 2%
- Common ancestry
- Romanian 7% Italian 2% Iranian 2%
- Foreign-born
- 1% · Canada
Political lean MEDSL · Chemung
- 2024 margin
- R (+16.8) · D 41.6% · R 58.4%
- 2008→2024 swing
- -15.6pp toward R · 2008: -1.2pp · 2024: -16.8pp
- All cycles
- 2024: R+16.8 2020: R+13.4 2016: R+20.0 2012: R+2.9 2008: R+1.2
Not yet ingested
- Civics
- —
Market trends
- HPI YoY
- ▲ 23.69%
- Current HPI
- 262.1655
- Rent YoY
- —
- Metro
- —
- State GDP YoY
- ▲ 2.60%
- F500 in state
- 92
Industry mix (Fortune 500 HQ in NY)
| Industry | F500 HQs | Revenue |
|---|---|---|
| Financial Services | 10 | $950B |
|
||
| Consumer Goods | 9 | $162B |
|
||
| Insurance | 4 | $225B |
|
||
| Telecommunications | 2 | $144B |
|
||
| Pharmaceuticals | 2 | $112B |
|
||
| Media / Entertainment | 2 | $69B |
|
||
Price history
1 event — show timeline
- 2026-04-22 Listed $179,900 UNYREIS
Property tax history
+4.7%/yrLatest (2025): $3,178 · -1.3% YoY. Source: county tax records.
Cash-flow waterfall
monthlySold comps — $/sqft
last 12 mo · ≤1 miLoading sold comps…