 🏗️ New Construction
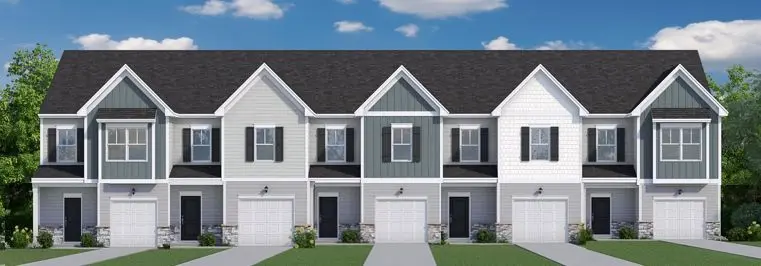
Ashford Townhome Plan · Roebuck, SC
Flood risk No data
- FEMA flood zone
- —
- Chance of flooding over 30 yrs
- —
- Est. flood insurance / yr
- —
Fire risk No data
- Est. fire insurance / yr
- —
Heat risk No data
- Hot days now (above threshold)
- —
- Hot days in 30 yrs
- —
Wind risk No data
- Chance of severe wind over 30 yrs
- —
Air-quality risk No data
- Unhealthy air days now
- —
- Unhealthy air days in 30 yrs
- —
Risk factors via First Street. Map © Google.
Why this score? — see what drove the D+ grade
The composite is a weighted blend of 9 inputs, each scored 0–100. Each bar is that input's sub-score; the figure is the points it added to the 100-point composite (weight × sub-score).
- Cash flow +17.7/30.0
- ARV discount +7.5/15.0
- DSCR +5.5/10.0
- 1% rule +4.8/10.0
- Schools +3.2/10.0
- Livability +3.2/5.0
- Rent growth +2.5/5.0
- Condition / age +2.5/5.0
- Appreciation +0.0/10.0
$225,900
🖨 Deal sheet 📄 Offer letter ✓ Due diligence
Listing remarks
The Ashford floor plan features a modern, open-concept layout designed for both comfort and functionality. The first floor welcomes you with a charming front porch and foyer that lead into a spacious family room, perfect for relaxing or entertaining. The adjoining kitchen includes a large island, pantry, and breakfast area that opens to the back patio, creating an easy flow between indoor and outdoor living. A convenient powder room and attached garage complete the main level. Upstairs, the owner's suite offers a peaceful retreat with a private bath and generous walk-in closet. Two additional bedrooms share a full bath, providing ideal space for family, guests, or a home office. With though
Key facts
- Parking
- Listed 251 days
Property features AI
Finance
- Financial info: List price $225,900
Exterior
- Parking: 1 parking space
- Home design: Townhome; Plan inventory (new construction plan)
- Exterior features: Living area of 1562
Interior
- Bedrooms: 3 bedrooms
- Bathrooms: 2 full bathrooms and 1 half bathroom
- Interior features: Plan home — Ashford Townhome
Neighborhood map
What this means for you Summary
Snapshot
- This is a 3-bed/2.5-bath townhouse listed at $226k.
Deal economics
- At list price, monthly cash flow is $163 ($2k/yr) — positive.
- The deal already cash-flows at list — no discount required.
- To meet the 1% rule (rent ≥ 1% of price), the offer needs to be $198k (12.2% below list).
- Recommended offer: $198k (12.2% below list) — sets the bar for 1% rule.
- Cap rate 7.3% vs local median 4.7% in Roebuck — top-decile yield for the area; either an underpriced asset or a hidden risk that comps aren't pricing in. Stress-test before assuming the spread holds.
Location & tenants
- Location reads 64/100 on livability (#147 in SC) — a middle-class / working-renter tenant base. Strengths: crime A+, cost of living A+, housing A+; Watch: schools D, amenities F, commute F.
- Spartanburg 06 (suburban): math 33% / reading 42% proficiency, ranked #35 of 80 in SC (top 44%) — families likely to look elsewhere, expect single-tenant / working-renter base with shorter leases.
- Market conditions: 141 active listings in the ZIP; 2 comparable units currently listed for rent nearby; 3,129 units permitted in Spartanburg County in 2024 (40 in 5+ unit buildings).
Forward outlook
- Local home prices are declining (-3.0%/yr); year-one equity from $1k of loan paydown is wiped out by about $6k of value loss. Plan a longer hold.
- Spartanburg County population projected at +18% by 2050 — long-run rental-demand tailwind backs the buy-and-hold thesis.
Negotiation context
- It's been on market 252 days — a 12% lower offer ($199k) is reasonable based on typical stale-listing flexibility.
Questions for the listing agent
- It's been on market 252 days. Have you received any prior offers? Is the seller open to a 12% concession, seller financing, or rate buy-down credit?
- Why hasn't it sold? Are there any deal-killer items the seller is aware of (foundation, flood, title, zoning, code violations)?
- Is there a deadline driving the sale (1031 exchange, divorce, estate, relocation)? That informs how much negotiation room exists.
- Schools are D-rated, which usually means shorter tenancies and higher turnover. Who's the typical renter profile here, and what's been the actual vacancy rate?
- The area grade is low — what's the realistic commute time and amenity access for the typical tenant pool here? Any planned neighborhood developments (good or bad) we should know about?
- What's the average days-on-market for RENTAL listings here right now (not sales)? A rising rental-DOM trend means longer vacancies and softer asking-rent achievability than the comps imply.
- What's the recent tenant-quality profile in this submarket — average credit score on applications, eviction rate, late-payment / NSF rate, and stable-employment percentage? A property-management company in the area should have these aggregated.
- How much new for-sale + rental construction is in the pipeline within 1–3 miles? Heavy new supply typically softens prices + rents 12–24 months out; constrained supply supports both.
Investment metrics
- 1% rule
- 0.98% ✗
- Cap rate
- 7.26%
- Cash-on-cash
- 3.45%
- DSCR
- 1.15
- GRM
- 8.5
CMA / ARV
- ARV (on-the-fly)
- $203,060
- Comps found
- 10
Show comp detail 10 sales within ~0.75 mi
| Address | Dist | Beds/Ba | Sqft | Sold | Price | $/sf | Match |
|---|---|---|---|---|---|---|---|
| 2011 Hillman Way | 0.00mi | 3/2.5 | 1,562 (0%) | 4mo | $189,900 | $122 | 97 |
| 2043 Hillman Way | 0.06mi | 3/2.5 | 1,570 (+0%) | 1mo | $212,900 | $136 | 96 |
| 2035 Hillman Way | 0.04mi | 3/2.5 | 1,562 (0%) | 3mo | $202,900 | $130 | 96 |
| 2015 Hillman Way | 0.00mi | 3/2.5 | 1,570 (+0%) | 5mo | $189,000 | $120 | 95 |
| 2013 Hillman Way | 0.00mi | 3/2.5 | 1,570 (+0%) | 5mo | $189,900 | $121 | 95 |
| 2037 Hillman Way | 0.04mi | 3/2.5 | 1,570 (+0%) | 2mo | $206,900 | $132 | 95 |
| 2039 Hillman Way | 0.05mi | 3/2.5 | 1,562 (0%) | 4mo | $199,900 | $128 | 95 |
| 2033 Hillman Way | 0.04mi | 3/2.5 | 1,570 (+0%) | 4mo | $204,990 | $131 | 94 |
| 2041 Hillman Way | 0.05mi | 3/2.5 | 1,570 (+0%) | 3mo | $207,900 | $132 | 94 |
| 2009 Hillman Way | 0.01mi | 3/2.5 | 1,570 (+0%) | 5mo | $195,900 | $125 | 94 |
Match score weights: distance 35% · size 25% · config 20% · recency 20%. Top-matched comps best support the ARV.
Projected returns pro-forma
-3.0% appreciation · 3.0% rent growth · sell at horizon
- IRR
- -10.9%
- Equity multiple
- 0.60×
- Total profit
- $-22,467
- Equity at exit
- $30,277
- IRR
- -1.6%
- Equity multiple
- 0.89×
- Total profit
- $-6,041
- Equity at exit
- $17,557
Cash invested: $56,857 (down + closing). Projections, not guarantees.
Landlord ↔ Tenant lean methodology
- Overall (STATE)
- 90 Strongly Landlord-Friendly
- State South Carolina
- 90 Strongly Landlord-Friendly · R+6
- County
- — inherits STATE
- City
- — inherits STATE
ZIP-level market 29376
- Home prices YoY
- -25.6%
- Active inventory
- 141
- Price-to-rent
- 9.5×
Monthly cashflow live
- Estimated rent
- $1,983 medium interval (Pro) →
- Mortgage (P&I)
- −$1,065
- Tax est. 1.5%
- −$254 /mo · $3,046/yr
- Insurance
- −$85
- HOA
- −$0
- Vacancy / Maint / Mgmt
- −$416
- Net cashflow
- $163
Break-even live
UW: 25.0% down · 7.5% · 30yr · 1.5% tax · 5.0% vac · 8.0% maint · 8.0% mgmt
Financing live
Cash to close
- Down payment
- $50,765
- Closing costs
- $6,092
- Reserves months
- —
- Total cash needed
- —
Loan-product check · same deal, 3 products live
Conventional
25% down · 7.5% · 30yr
- Down + closing
- —
- Monthly P&I
- —
- Monthly cashflow
- —
- DSCR
- —
- Eligible?
- —
Personal DTI + credit; lowest rate.
DSCR
20% down · 8.5% · 30yr
- Down + closing
- —
- Monthly P&I
- —
- Monthly cashflow
- —
- DSCR
- —
- Eligible?
- —
No personal income docs; deal must DSCR.
Hard money
10% down · 12.0% · 12mo
- Down + closing
- —
- Monthly P&I
- —
- Monthly cashflow
- —
- DSCR
- —
- Eligible?
- —
Short-term bridge; refi at stabilization.
Rent comps 2 comps
| Address | Beds | Baths | Sqft | Rent | $/sqft | DOM | Units | Dist |
|---|---|---|---|---|---|---|---|---|
| 6039 Haddington Dr Roebuck, SC | 3.0 | 2.5 | 1913 | $1,975 | $1.03 | 21d | 1 | 0.38mi |
| 2180 Davenport Ct Moore, SC | 3.0 | 2.0 | 1456 | $2,000 | $1.37 | 14d | 1 | 0.90mi |
Listing history 14 events
-
2026-06-18days on market $225,900 Active 252 DOM
-
2026-06-17days on market $225,900 Active 251 DOM
-
2026-06-16days on market $225,900 Active 250 DOM
-
2026-06-15days on market $225,900 Active 249 DOM
-
2026-06-14days on market $225,900 Active 247 DOM
-
2026-06-13days on market $225,900 Active 246 DOM
-
2026-06-10days on market $225,900 Active 244 DOM
-
2026-06-09days on market $225,900 Active 243 DOM
-
2026-06-08days on market $225,900 Active 242 DOM
-
2026-06-07days on market $225,900 Active 241 DOM
-
2026-06-02days on market $225,900 Active 236 DOM
-
2026-06-01days on market $225,900 Active 235 DOM
-
2026-05-31days on market $225,900 Active 234 DOM
-
2026-05-30days on market $225,900 Active 233 DOM
ⓘ Source: listings_history table (triggers on properties + properties_extension) + one-shot
backfill from property_details.listing_events for pre-trigger history.
Nearby sold comps map
Loading sold comps map…
Walkable amenities ~0.75 mi
Loading nearby amenities…
Taxation est. · year 1
- Rental income
- $23,798
- − Mortgage interest
- −$11,375
- − Property taxes
- −$3,046
- − Insurance
- −$1,015
- − Repairs & maintenance
- −$1,904
- − Management
- −$1,904
- − Depreciation
- −$5,907
- Taxable loss
- −$1,352
- Est. tax savings @ 24.0%
- +$325
- After-tax cash flow
- $2,286/yr
For passive investors: Depreciation is non-cash, so a rental often shows a tax loss while cash-flowing — sheltering income. Rental losses are passive: they offset passive income freely, and up to $25,000/yr can offset ordinary (W-2) income if you actively participate and your MAGI is under $100k (phasing out to $0 by $150k); unused losses carry forward. On sale, claimed depreciation is recaptured at up to 25%, and gains may owe capital-gains tax (a 1031 exchange can defer both). Figures are a year-1 estimate at your 24.0% rate — not tax advice; consult a CPA.
Schools (NCES district)
- District
- Spartanburg 06
- NCES district ID
- 4503630
- Math proficiency
- 33% ▼ -8.00%
- Reading proficiency
- 42% ▼ -2.00%
- Median HH income
- $46,110
- Composite
- 32.02/100
- National rank
- #5827
- State rank
- #35 of 80 in SC
Livability — Roebuck
- Score
- 64/100
- State rank
- #147
- US rank
- #13929
Category grades
Schools grade is shown separately in the Schools card above.
Census & demographics
- Census place
- Roebuck, SC
- Population (ZIP)
- 8,722
Population outlook (Spartanburg County) Hauer SSP2
- Today (2025)
- 325,495 people
- By 2030
- 338,800 · +4.1%
- By 2040
- 363,471 · +11.7%
- By 2050
- 384,156 · +18.0%
- By 2075
- 430,137 · +32.1%
- By 2100
- 442,733 · +36.0%
Race, ethnicity, and origin ACS 2023
- Neighborhood character
- Predominantly White (70%)
- Race & ethnicity
- White 70% Black 20% Hispanic / Latino 6% Two or more races 6% Asian 1%
- Hispanic origin (detail)
- Mexican 2% Puerto Rican 2% Cuban 2%
- Common ancestry
- Lithuanian 3% Romanian 2% Scottish 1%
- Foreign-born
- 4% · Canada
- Languages at home
- 93% English-only · Spanish 4% German/W. Germanic 2% Other Indo-European 1%
Political lean MEDSL · Spartanburg
- 2024 margin
- Solid R (+33.6) · D 32.6% · R 66.2% · Other 1.2%
- 2008→2024 swing
- -12.0pp toward R · 2008: -21.6pp · 2024: -33.6pp
- All cycles
- 2024: R+33.6 2020: R+27.3 2016: R+30.0 2012: R+23.1 2008: R+21.6
Not yet ingested
- Civics
- —
Market trends
- HPI YoY
- ▼ -77.54%
- Current HPI
- 225.2259
- Rent YoY
- —
- Metro
- —
- State GDP YoY
- ▲ 4.51%
- F500 in state
- 2
Industry mix (Fortune 500 HQ in SC)
| Industry | F500 HQs | Revenue |
|---|---|---|
| Packaging | 1 | $7B |
|
||
Cash-flow waterfall
monthlySold comps — $/sqft
last 12 mo · ≤1 miLoading sold comps…