4430 Dixie · Haskell, AR
Flood risk 1/10 · Minimal
- FEMA flood zone
- X (unshaded)
- Chance of flooding over 30 yrs
- 0.0%
- Est. flood insurance / yr
- $507 – $1,088
Fire risk 5/10 · Moderate
- Est. fire insurance / yr
- $1,499 – $2,785
Heat risk 6/10 · Moderate
- Hot days now (above 110°F)
- 7 days/yr
- Hot days in 30 yrs
- 18 days/yr
Wind risk 4/10 · Minor
- Chance of severe wind over 30 yrs
- 9.0%
Air-quality risk 2/10 · Minimal
- Unhealthy air days now
- 0 days/yr
- Unhealthy air days in 30 yrs
- 1 days/yr
Risk factors via First Street. Map © Google.
Why this score? — see what drove the B- grade
The composite is a weighted blend of 9 inputs, each scored 0–100. Each bar is that input's sub-score; the figure is the points it added to the 100-point composite (weight × sub-score).
- Cash flow +30.0/30.0
- 1% rule +10.0/10.0
- DSCR +10.0/10.0
- ARV discount +7.5/15.0
- Schools +4.1/10.0
- Livability +3.9/5.0
- Rent growth +2.7/5.0
- Condition / age +1.0/5.0
- Appreciation +0.0/10.0
$69,000
🖨 Deal sheet 📄 Offer letter ✓ Due diligence
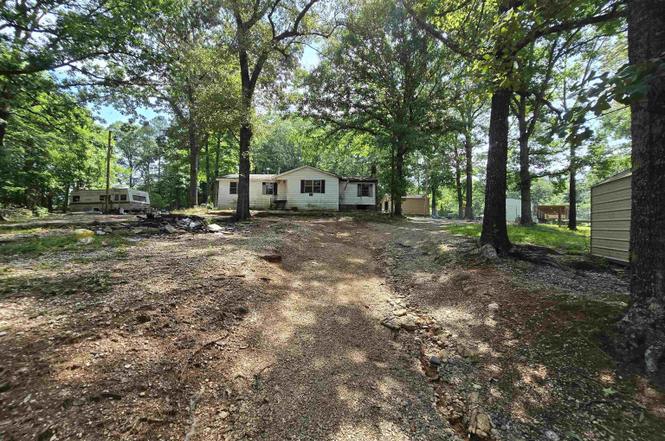
Listing remarks
Home is in need of renovation but can be your dream property with sweat equity. Property has two storage buildings and is located in a country setting. Agents see remarks
Key facts
- 1.5 acre lot
- Built 1975
- Listed 9 days
Property features AI
Finance
- Other: Lot approximately 1.5 acres (65,340 sqft), acreage source: tax records; Square footage source: tax records; Will not subdivide
Exterior
- Parking: Other parking (see remarks)
- Utilities: Septic system; Public water; Electricity from municipal service and Entergy
- Home design: Single-family property (see remarks for details); Approximately 1,364 square feet
- Construction: Crawl space foundation
- Exterior features: Metal or vinyl siding; Additional exterior features (see remarks); 3-tab shingle roof; Paved road access; Sloped lot
Interior
- Kitchen: Kitchen equipment details: other (see remarks)
- Flooring: Other flooring (see remarks)
- Bathrooms: 1 full bathroom
- Heating & cooling: Other heating and cooling (see remarks)
- Interior features: Other interior finishes (see remarks); Fireplace (see remarks)
Neighborhood map
What this means for you Summary
Snapshot
- This is a 3-bed/1.0-bath manufactured listed at $69k. Condition is rated poor.
Deal economics
- At list price, monthly cash flow is $817 ($10k/yr) — positive.
- The deal already cash-flows at list — no discount required.
- Meets the 1% rule at list price ($2k rent vs $69k).
- Cap rate 20.5% vs local median 3.7% in Haskell — top-decile yield for the area; either an underpriced asset or a hidden risk that comps aren't pricing in. Stress-test before assuming the spread holds.
Location & tenants
- Location reads 77/100 on livability (#12 in AR, #3,200 nationally) — a middle-class / working-renter tenant base. Strengths: crime A+, cost of living A+, housing A+; Watch: amenities F, commute F.
- Benton School District (suburban): math 51% / reading 43% proficiency, ranked #25 of 238 in AR (top 10%) — families likely to look elsewhere, expect single-tenant / working-renter base with shorter leases.
- Market conditions: Rents flat; 195 active listings in the ZIP; 1 comparable units currently listed for rent nearby; 446 units permitted in Saline County in 2024 (0 in 5+ unit buildings).
Forward outlook
- Local home prices are declining (-3.0%/yr); year-one equity from $477 of loan paydown is wiped out by about $2k of value loss. Plan a longer hold.
- Saline County population projected at +39% by 2050 — long-run rental-demand tailwind backs the buy-and-hold thesis.
- At projected returns (-3.0% appreciation + 0.7% rent growth), your $19k cash investment doubles in ~3 years — after that, you're playing with house money.
Negotiation context
- Only 9 days on market — expect competitive offers; lowballing is unlikely to land.
Risks & watch-outs
- Climate carrying-cost: moderate wildfire risk; extreme-heat days projected 7→18/yr by 2055 (HVAC capex compounding) — expect insurance premiums to compound above CPI over the hold.
Questions for the listing agent
- Have any recent inspections been done? Can we get a copy of the seller's disclosures and any deferred-maintenance estimates?
- Built in 1975 — when were the roof, HVAC, electrical panel, plumbing, and water heater last replaced?
- Is there a deadline driving the sale (1031 exchange, divorce, estate, relocation)? That informs how much negotiation room exists.
- Schools are A-rated — typically a magnet for longer-tenancy family renters. What's the average tenant stay here, and is there a school-zone premium baked into asking?
- What's the average days-on-market for RENTAL listings here right now (not sales)? A rising rental-DOM trend means longer vacancies and softer asking-rent achievability than the comps imply.
- What's the recent tenant-quality profile in this submarket — average credit score on applications, eviction rate, late-payment / NSF rate, and stable-employment percentage? A property-management company in the area should have these aggregated.
- How much new for-sale + rental construction is in the pipeline within 1–3 miles? Heavy new supply typically softens prices + rents 12–24 months out; constrained supply supports both.
Investment metrics
- 1% rule
- 2.37% ✓
- Cap rate
- 20.49%
- Cash-on-cash
- 50.72%
- DSCR
- 3.26
- GRM
- 3.5
CMA / ARV
- ARV (on-the-fly)
- $190,960
- Comps found
- 1
Show comp detail 1 sale within ~0.75 mi
| Address | Dist | Beds/Ba | Sqft | Sold | Price | $/sf | Match |
|---|---|---|---|---|---|---|---|
| 10503 Carnell Cir | 0.49mi | 3/2.0 | 1,536 (+13%) | 13mo | $214,500 | $140 | 41 |
Match score weights: distance 35% · size 25% · config 20% · recency 20%. Top-matched comps best support the ARV.
Projected returns pro-forma
-3.0% appreciation · 0.73% rent growth · sell at horizon
- IRR
- 45.9%
- Equity multiple
- 2.93×
- Total profit
- $37,196
- Equity at exit
- $10,288
- IRR
- 50.7%
- Equity multiple
- 5.41×
- Total profit
- $85,123
- Equity at exit
- $5,966
Cash invested: $19,320 (down + closing). Projections, not guarantees.
Landlord ↔ Tenant lean methodology
- Overall (STATE)
- 92 Strongly Landlord-Friendly
- State Arkansas
- 92 Strongly Landlord-Friendly · R+14
- County
- — inherits STATE
- City
- — inherits STATE
ZIP-level market 72015
- Home prices YoY
- -11.1%
- Rents YoY
- 0.7%
- Active inventory
- 195
- Price-to-rent
- 3.5×
Monthly cashflow live
- Estimated rent
- $1,637 medium interval (Pro) →
- Mortgage (P&I)
- −$362
- Tax est. 1.5%
- −$86 /mo · $1,035/yr
- Insurance
- −$29
- HOA
- −$0
- Vacancy / Maint / Mgmt
- −$344
- Net cashflow
- $817
Break-even live
UW: 25.0% down · 7.5% · 30yr · 1.5% tax · 5.0% vac · 8.0% maint · 8.0% mgmt
Financing live
Cash to close
- Down payment
- $17,250
- Closing costs
- $2,070
- Reserves months
- —
- Total cash needed
- —
Loan-product check · same deal, 3 products live
Conventional
25% down · 7.5% · 30yr
- Down + closing
- —
- Monthly P&I
- —
- Monthly cashflow
- —
- DSCR
- —
- Eligible?
- —
Personal DTI + credit; lowest rate.
DSCR
20% down · 8.5% · 30yr
- Down + closing
- —
- Monthly P&I
- —
- Monthly cashflow
- —
- DSCR
- —
- Eligible?
- —
No personal income docs; deal must DSCR.
Hard money
10% down · 12.0% · 12mo
- Down + closing
- —
- Monthly P&I
- —
- Monthly cashflow
- —
- DSCR
- —
- Eligible?
- —
Short-term bridge; refi at stabilization.
Rent comps 1 comps
| Address | Beds | Baths | Sqft | Rent | $/sqft | DOM | Units | Dist |
|---|---|---|---|---|---|---|---|---|
| 8705 Wingate Dr Benton, AR | 4.0 | 2.0 | 1813 | $2,150 | $1.19 | 43d | 1 | 1.03mi |
Listing history 9 events
-
2026-06-18days on market $69,000 Active 9 DOM
-
2026-06-17days on market $69,000 Active 8 DOM
-
2026-06-16days on market $69,000 Active 7 DOM
-
2026-06-16status $69,000 Active 6 DOM
-
2026-06-15days on market $69,000 New Listing 6 DOM
-
2026-06-14days on market $69,000 New Listing 4 DOM
-
2026-06-13days on market $69,000 New Listing 3 DOM
-
2026-06-10remarks 170-char remark
-
2026-06-10$69,000 New Listing 1 DOM
ⓘ Source: listings_history table (triggers on properties + properties_extension) + one-shot
backfill from property_details.listing_events for pre-trigger history.
Climate risk First Street
- Flood 1/10 Low FEMA zone X (unshaded) · 0% chance over 30 yrs
- Wildfire 5/10 Major
- Heat 6/10 Major 7 d/yr ≥110°F today · 18 d/yr by 30 yrs out
- Wind 4/10 Moderate 9% chance of damaging wind over 30 yrs
- Air quality 2/10 Low 0 unhealthy d/yr today · 1 by 30 yrs out
Nearby sold comps map
Loading sold comps map…
Walkable amenities ~0.75 mi
Loading nearby amenities…
Taxation est. · year 1
- Rental income
- $19,647
- − Mortgage interest
- −$3,865
- − Property taxes
- −$1,035
- − Insurance
- −$345
- − Repairs & maintenance
- −$1,572
- − Management
- −$1,572
- − Depreciation
- −$2,007
- Taxable income
- $9,251
- Est. tax owed @ 24.0%
- −$2,220
- After-tax cash flow
- $7,579/yr
For passive investors: Depreciation is non-cash, so a rental often shows a tax loss while cash-flowing — sheltering income. Rental losses are passive: they offset passive income freely, and up to $25,000/yr can offset ordinary (W-2) income if you actively participate and your MAGI is under $100k (phasing out to $0 by $150k); unused losses carry forward. On sale, claimed depreciation is recaptured at up to 25%, and gains may owe capital-gains tax (a 1031 exchange can defer both). Figures are a year-1 estimate at your 24.0% rate — not tax advice; consult a CPA.
Condition & rehab AI · 6 photos
This manufactured home requires extensive repairs and updates to become move-in ready. Significant investment is needed to address the poor condition of the exterior, roof, flooring, and interior walls.
Repairs flagged
- Major siding — Severe weathering and damage
- Major roof — Missing shingles
- Major flooring — Exposed subfloor
- Major interior walls — Paint peeling
Value-add opportunities
- Both repair and replace siding — Improves curb appeal and structural integrity
- Both repair and replace roof — Essential for structural integrity and water resistance
- Both repair and replace flooring — Improves living space and safety
- Both paint interior walls — Enhances appearance and value
Renovation cost estimate screening
| Repair item | Severity | Est. cost |
|---|---|---|
| siding · Severe weathering and damage | Major | $15,000–50,000 |
| roof · Missing shingles | Major | $15,000–50,000 |
| flooring · Exposed subfloor | Major | $15,000–50,000 |
| interior walls · Paint peeling | Major | $15,000–50,000 |
| Total estimated repair cost · 4 items | $60,000–200,000 |
Value-add ROI direction
- Both repair and replace siding — Improves curb appeal and structural integrity ↑
- Both repair and replace roof — Essential for structural integrity and water resistance ↑
- Both repair and replace flooring — Improves living space and safety ↑
- Both paint interior walls — Enhances appearance and value ↑
ⓘ Cost ranges are severity-bucket heuristics (US national rule-of-thumb). Get contractor quotes + a written scope before underwriting a rehab budget.
Schools (NCES district)
- District
- Benton School District
- NCES district ID
- 0502960
- Math proficiency
- 51% ▼ -10.00%
- Reading proficiency
- 43% ▼ -10.00%
- Median HH income
- $51,870
- Composite
- 40.52/100
- National rank
- #3707
- State rank
- #25 of 238 in AR
Livability — Haskell
- Score
- 77/100
- State rank
- #12
- US rank
- #3200
Category grades
Schools grade is shown separately in the Schools card above.
Census & demographics
- County
- Saline County · 77,216 people
- Metro
- Little Rock-North Little Rock-Conway, AR
- Population (ZIP)
- 28,712
- Household income
- $66,107
- Rent vs Own
- Severe rent burden
- 439.0
Population outlook (Saline County) Hauer SSP2
- Today (2025)
- 140,141 people
- By 2030
- 151,233 · +7.9%
- By 2040
- 173,100 · +23.5%
- By 2050
- 194,368 · +38.7%
- By 2075
- 245,295 · +75.0%
- By 2100
- 279,117 · +99.2%
Race, ethnicity, and origin ACS 2023
- Neighborhood character
- Predominantly White (79%)
- Race & ethnicity
- White 79% Black 10% Two or more races 6% Hispanic / Latino 5%
- Common ancestry
- Slovak 3% Italian 2% Lithuanian 1%
- Foreign-born
- 2% · Canada, Vietnam
- Languages at home
- 97% English-only · Spanish 3% Vietnamese 0%
Political lean MEDSL · Saline
- 2024 margin
- Solid R (+40.1) · D 28.8% · R 69.0% · Other 2.2%
- 2008→2024 swing
- +0.8pp no change · 2008: -41.0pp · 2024: -40.1pp
- All cycles
- 2024: R+40.1 2020: R+41.2 2016: R+43.5 2012: R+42.7 2008: R+41.0
Not yet ingested
- Civics
- —
Market trends
- HPI YoY
- ▼ -29.11%
- Current HPI
- 234.4644
- Rent YoY
- ▲ 0.73%
- Metro
- Little Rock-North Little Rock-Conway, AR
- State GDP YoY
- ▲ 3.80%
- F500 in state
- 10
Industry mix (Fortune 500 HQ in AR)
| Industry | F500 HQs | Revenue |
|---|---|---|
| Retail | 1 | $681B |
|
||
| Food / Agriculture | 1 | $53B |
|
||
| Retail / Energy | 1 | $22B |
|
||
| Transportation / Logistics | 1 | $12B |
|
||
| Energy | 1 | $4B |
|
||
Price history
1 event — show timeline
- 2026-06-09 Listed $69,000 CARMLS
Cash-flow waterfall
monthlySold comps — $/sqft
last 12 mo · ≤1 miLoading sold comps…