 Multi-family
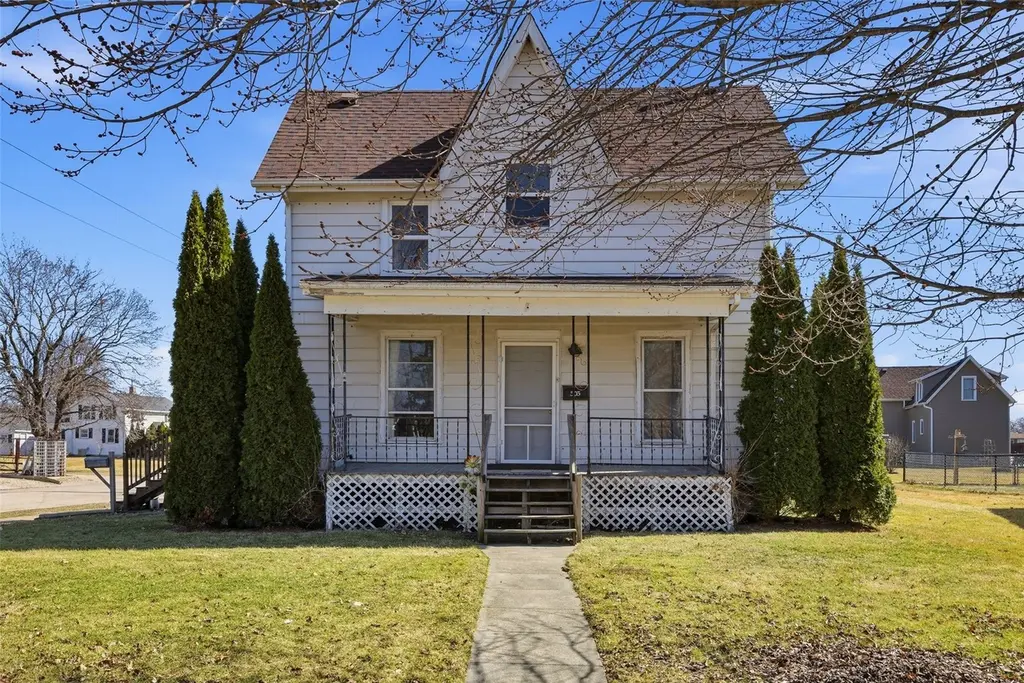
503 S Maple St · Monticello, IA
Flood risk 6/10 · Moderate
- FEMA flood zone
- X (unshaded)
- Chance of flooding over 30 yrs
- 0.74%
- Est. flood insurance / yr
- $473 – $860
Fire risk 4/10 · Minor
- Est. fire insurance / yr
- $902 – $1,676
Heat risk 3/10 · Minor
- Hot days now (above 103°F)
- 7 days/yr
- Hot days in 30 yrs
- 15 days/yr
Wind risk 2/10 · Minimal
- Chance of severe wind over 30 yrs
- —
Air-quality risk 2/10 · Minimal
- Unhealthy air days now
- 1 days/yr
- Unhealthy air days in 30 yrs
- 1 days/yr
Risk factors via First Street. Map © Google.
Why this score? — see what drove the C+ grade
The composite is a weighted blend of 9 inputs, each scored 0–100. Each bar is that input's sub-score; the figure is the points it added to the 100-point composite (weight × sub-score).
- Cash flow +20.1/30.0
- ARV discount +15.0/15.0
- DSCR +6.4/10.0
- Schools +6.0/10.0
- 1% rule +5.7/10.0
- Livability +3.9/5.0
- Rent growth +2.5/5.0
- Condition / age +2.5/5.0
- Appreciation +0.0/10.0
$115,000
🖨 Deal sheet 📄 Offer letter ✓ Due diligence
Multi-family units
County records classify this as Multi-Family (2-4 Unit). Listing-text estimate: 1 unit. estimate disagrees with records
Listing remarks MLS
Great investment opportunity in the heart of Monticello! This well-maintained duplex features two units, each offering 2 bedrooms and 1 bathroom with separate private entrances for added privacy and convenience. The upper and lower units provide comfortable living spaces and functional layouts that appeal to long-term tenants. This property currently generates steady rental income, making it a fantastic addition to any investment portfolio. Whether you're looking to expand your rental holdings or live in one unit while renting the other, this duplex offers flexibility and strong potential. Located in a convenient Monticello neighborhood with easy access to local amenities, shopping, and dining. Don't miss this opportunity to own an income-producing property in a growing community!
Key facts
- 8,712 sq ft lot
- Garage
- Built 1900
Neighborhood map
What this means for you Summary
Snapshot
- This is a 4-bed/2.5-bath multifamily listed at $115k.
Deal economics
- At list price, monthly cash flow is $143 ($2k/yr) — positive.
- The deal already cash-flows at list — no discount required.
- Meets the 1% rule at list price ($1k rent vs $115k).
- Recommended offer: $108k (6.0% below list) — sets the bar for market timing.
- Cap rate 7.8% vs local median 3.4% in Monticello — top-decile yield for the area; either an underpriced asset or a hidden risk that comps aren't pricing in. Stress-test before assuming the spread holds.
Location & tenants
- Location reads 78/100 on livability (#149 in IA, #2,739 nationally) — a middle-class / working-renter tenant base. Strengths: schools A+, crime A+, cost of living A+; Watch: amenities F, commute F.
- Monticello Community School District (town): math 68% / reading 73% proficiency, ranked #131 of 289 in IA (top 45%) — strong family-tenant draw, lease renewals of 3-5y typical.
- Market conditions: 47 active listings in the ZIP; 25 units permitted in Jones County in 2024 (0 in 5+ unit buildings).
Forward outlook
- Local home prices are declining (-3.0%/yr); year-one equity from $795 of loan paydown is wiped out by about $3k of value loss. Plan a longer hold.
- Jones County population projected to shrink 8% by 2050 — rents likely to lag national; underwrite the cash flow, not the appreciation.
Negotiation context
- It's been on market 64 days — a 6% lower offer ($108k) is reasonable based on typical stale-listing flexibility.
- 2 sale attempts; this cycle's ask has dropped $10k (8%) from the opening price — seller is motivated, your offer sets the floor, not the list.
Risks & watch-outs
- Watch-outs: built in 1900 — expect roof / HVAC / electrical / plumbing capex.
- Climate carrying-cost: major flood risk — expect insurance premiums to compound above CPI over the hold.
Questions for the listing agent
- It's been on market 64 days. Have you received any prior offers? Is the seller open to a 6% concession, seller financing, or rate buy-down credit?
- Built in 1900 — when were the roof, HVAC, electrical panel, plumbing, and water heater last replaced?
- Why hasn't it sold? Are there any deal-killer items the seller is aware of (foundation, flood, title, zoning, code violations)?
- Is there a deadline driving the sale (1031 exchange, divorce, estate, relocation)? That informs how much negotiation room exists.
- Schools are A-rated — typically a magnet for longer-tenancy family renters. What's the average tenant stay here, and is there a school-zone premium baked into asking?
- What's the average days-on-market for RENTAL listings here right now (not sales)? A rising rental-DOM trend means longer vacancies and softer asking-rent achievability than the comps imply.
- What's the recent tenant-quality profile in this submarket — average credit score on applications, eviction rate, late-payment / NSF rate, and stable-employment percentage? A property-management company in the area should have these aggregated.
- How much new apartment / multifamily construction is in the pipeline within 1–3 miles? Heavy new supply (>2% of stock underway) typically softens rents 12–24 months out; light construction supports rent growth.
Investment metrics
- 1% rule
- 1.07% ✓
- Cap rate
- 7.78%
- Cash-on-cash
- 5.31%
- DSCR
- 1.24
- GRM
- 7.8
CMA / ARV
- ARV (median comp)
- $172,790
- List price
- $115,000
- Delta
- -33.45%
- Verdict
- UNDERPRICED
- Comps
- 20 within 1.0 mi
Projected returns pro-forma
-3.0% appreciation · 3.0% rent growth · sell at horizon
- IRR
- -8.0%
- Equity multiple
- 0.70×
- Total profit
- $-9,515
- Equity at exit
- $17,147
- IRR
- 1.6%
- Equity multiple
- 1.11×
- Total profit
- $3,566
- Equity at exit
- $9,943
Cash invested: $32,200 (down + closing). Projections, not guarantees.
Landlord ↔ Tenant lean methodology
- Overall (STATE)
- 83 Strongly Landlord-Friendly
- State Iowa
- 83 Strongly Landlord-Friendly · R+6
- County
- — inherits STATE
- City
- — inherits STATE
ZIP-level market 52310
- Home prices YoY
- -25.9%
- Active inventory
- 47
- Price-to-rent
- 7.8×
Monthly cashflow live
- Estimated rent
- $1,229 medium interval (Pro) →
- Mortgage (P&I)
- −$603
- Tax from tax record
- −$178 /mo · $2,131/yr
- Insurance
- −$48
- HOA
- −$0
- Vacancy / Maint / Mgmt
- −$258
- Net cashflow
- $143
Break-even live
UW: 25.0% down · 7.5% · 30yr · 1.5% tax · 5.0% vac · 8.0% maint · 8.0% mgmt
Financing live
Cash to close
- Down payment
- $28,750
- Closing costs
- $3,450
- Reserves months
- —
- Total cash needed
- —
Loan-product check · same deal, 3 products live
Conventional
25% down · 7.5% · 30yr
- Down + closing
- —
- Monthly P&I
- —
- Monthly cashflow
- —
- DSCR
- —
- Eligible?
- —
Personal DTI + credit; lowest rate.
DSCR
20% down · 8.5% · 30yr
- Down + closing
- —
- Monthly P&I
- —
- Monthly cashflow
- —
- DSCR
- —
- Eligible?
- —
No personal income docs; deal must DSCR.
Hard money
10% down · 12.0% · 12mo
- Down + closing
- —
- Monthly P&I
- —
- Monthly cashflow
- —
- DSCR
- —
- Eligible?
- —
Short-term bridge; refi at stabilization.
Listing history 18 events
-
2026-06-18days on market $115,000 Active 64 DOM
-
2026-06-17days on market $115,000 Active 63 DOM
-
2026-06-16days on market $115,000 Active 62 DOM
-
2026-06-15days on market $115,000 Active 61 DOM
-
2026-06-13days on market $115,000 Active 59 DOM
-
2026-06-12days on market $115,000 Active 58 DOM
-
2026-06-09days on market $115,000 Active 55 DOM
-
2026-06-08days on market $115,000 Active 54 DOM
-
2026-06-07days on market $115,000 Active 53 DOM
-
2026-06-07pricedays on market $115,000 Active 52 DOM
-
2026-06-04days on market $125,000 Active 49 DOM
-
2026-06-02days on market $125,000 Active 48 DOM
-
2026-06-01days on market $125,000 Active 47 DOM
-
2026-05-31days on market $125,000 Active 46 DOM
-
2026-05-31days on market $125,000 Active 45 DOM
-
2026-04-15$125,000 Active
-
2026-03-17price $125,000 791-char remark
Show marketing remark (791 chars)
Great investment opportunity in the heart of Monticello! This well-maintained duplex features two units, each offering 2 bedrooms and 1 bathroom with separate private entrances for added privacy and convenience. The upper and lower units provide comfortable living spaces and functional layouts that appeal to long-term tenants. This property currently generates steady rental income, making it a fantastic addition to any investment portfolio. Whether you're looking to expand your rental holdings or live in one unit while renting the other, this duplex offers flexibility and strong potential. Located in a convenient Monticello neighborhood with easy access to local amenities, shopping, and dining. Don't miss this opportunity to own an income-producing property in a growing community!
-
2026-03-10$135,000 Active 791-char remark
Show marketing remark (791 chars)
Great investment opportunity in the heart of Monticello! This well-maintained duplex features two units, each offering 2 bedrooms and 1 bathroom with separate private entrances for added privacy and convenience. The upper and lower units provide comfortable living spaces and functional layouts that appeal to long-term tenants. This property currently generates steady rental income, making it a fantastic addition to any investment portfolio. Whether you're looking to expand your rental holdings or live in one unit while renting the other, this duplex offers flexibility and strong potential. Located in a convenient Monticello neighborhood with easy access to local amenities, shopping, and dining. Don't miss this opportunity to own an income-producing property in a growing community!
ⓘ Source: listings_history table (triggers on properties + properties_extension) + one-shot
backfill from property_details.listing_events for pre-trigger history.
Tax reassessment forecast IA · Partial reset (capped growth)
- Current annual tax
- $2,131 · $178/mo
- Projected year-2 tax
- $2,131 · $178/mo
- Expected delta
- $0/yr ($0/mo · 0.0%)
ⓘ Screening estimate from a state-policy table — verify with the county assessor before closing.
Climate risk First Street
- Flood 6/10 Major FEMA zone X (unshaded) · 74% chance over 30 yrs
- Wildfire 4/10 Moderate
- Heat 3/10 Moderate 7 d/yr ≥103°F today · 15 d/yr by 30 yrs out
- Wind 2/10 Low
- Air quality 2/10 Low 1 unhealthy d/yr today · 1 by 30 yrs out
Nearby sold comps map
Loading sold comps map…
Walkable amenities ~0.75 mi
Loading nearby amenities…
Taxation est. · year 1
- Rental income
- $14,752
- − Mortgage interest
- −$6,442
- − Property taxes
- −$2,131
- − Insurance
- −$575
- − Repairs & maintenance
- −$1,180
- − Management
- −$1,180
- − Depreciation
- −$3,345
- Taxable loss
- −$102
- Est. tax savings @ 24.0%
- +$24
- After-tax cash flow
- $1,735/yr
For passive investors: Depreciation is non-cash, so a rental often shows a tax loss while cash-flowing — sheltering income. Rental losses are passive: they offset passive income freely, and up to $25,000/yr can offset ordinary (W-2) income if you actively participate and your MAGI is under $100k (phasing out to $0 by $150k); unused losses carry forward. On sale, claimed depreciation is recaptured at up to 25%, and gains may owe capital-gains tax (a 1031 exchange can defer both). Figures are a year-1 estimate at your 24.0% rate — not tax advice; consult a CPA.
Schools (NCES district)
- District
- Monticello Community School District
- NCES district ID
- 1919650
- Math proficiency
- 68% ▼ -3.00%
- Reading proficiency
- 73% ▬ 0.00%
- Median HH income
- $52,768
- Composite
- 60.03/100
- National rank
- #872
- State rank
- #131 of 289 in IA
Livability — Monticello
- Score
- 78/100
- State rank
- #149
- US rank
- #2739
Category grades
Schools grade is shown separately in the Schools card above.
Census & demographics
- Census place
- Monticello, IA
- Population (ZIP)
- 6,384
Population outlook (Jones County) Hauer SSP2
- Today (2025)
- 20,023 people
- By 2030
- 19,702 · -1.6%
- By 2040
- 19,007 · -5.1%
- By 2050
- 18,396 · -8.1%
- By 2075
- 17,955 · -10.3%
- By 2100
- 17,448 · -12.9%
Race, ethnicity, and origin ACS 2023
- Neighborhood character
- Predominantly White (93%)
- Race & ethnicity
- White 93% Two or more races 5% Hispanic / Latino 3% Black 1%
- Common ancestry
- Iranian 1% Lithuanian 1% Portuguese 1%
- Foreign-born
- 0% · Canada
- Languages at home
- 96% English-only · Spanish 3% Other Asian/Pacific 1%
Political lean MEDSL · Jones
- 2024 margin
- Strong R (+26.3) · D 36.0% · R 62.3% · Other 1.7%
- 2008→2024 swing
- -36.7pp toward R · 2008: 10.4pp · 2024: -26.3pp
- All cycles
- 2024: R+26.3 2020: R+21.5 2016: R+19.4 2012: D+7.7 2008: D+10.4
Not yet ingested
- Civics
- —
Market trends
- HPI YoY
- ▼ -68.44%
- Current HPI
- 196.1405
- Rent YoY
- —
- Metro
- —
- State GDP YoY
- ▲ 2.48%
- F500 in state
- 4
Industry mix (Fortune 500 HQ in IA)
| Industry | F500 HQs | Revenue |
|---|---|---|
| Financial Services | 1 | $16B |
|
||
| Retail / Convenience | 1 | $15B |
|
||
Price history
-7.4% since first listed3 events — show timeline
- 2026-04-15 Listed $125,000 CRAAR, CDRMLS
- 2026-03-17 Price Changed $125,000 CRAAR, CDRMLS
- 2026-03-10 Listed $135,000 CRAAR, CDRMLS
Property tax history
+3.3%/yrLatest (2025): $2,131 · +20.5% YoY. Source: county tax records.
Cash-flow waterfall
monthlySold comps — $/sqft
last 12 mo · ≤1 miLoading sold comps…