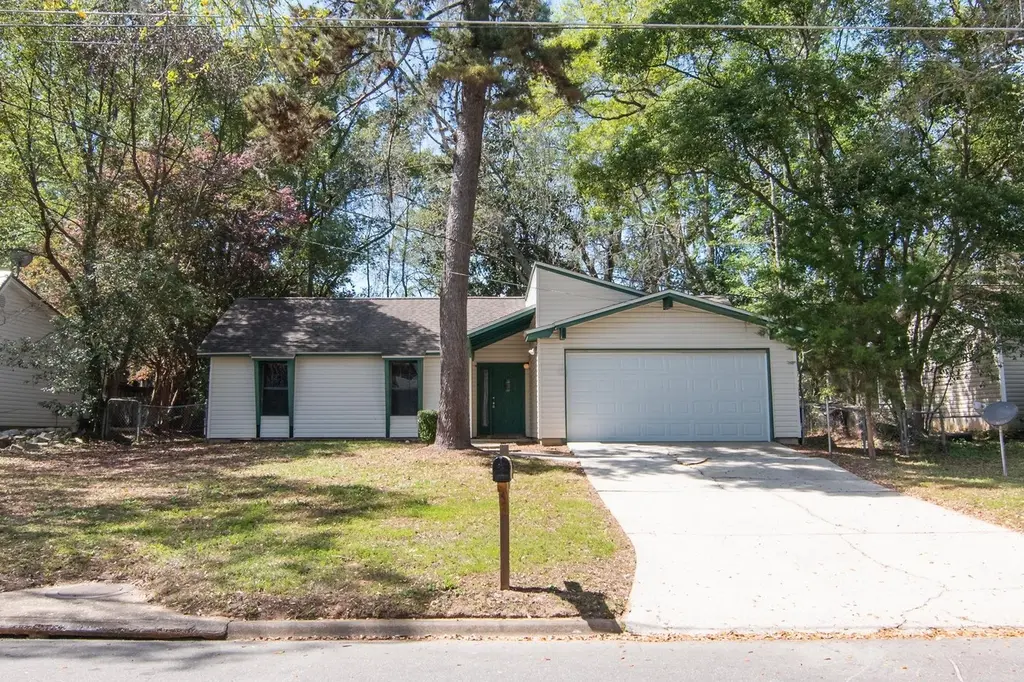
1056 Longstreet Dr · Tallahassee, FL
Flood risk 1/10 · Minimal
- FEMA flood zone
- X (unshaded)
- Chance of flooding over 30 yrs
- 0.0%
- Est. flood insurance / yr
- $507 – $1,088
Fire risk 2/10 · Minimal
- Est. fire insurance / yr
- $947 – $1,759
Heat risk 8/10 · Major
- Hot days now (above 108°F)
- 7 days/yr
- Hot days in 30 yrs
- 20 days/yr
Wind risk 9/10 · Severe
- Chance of severe wind over 30 yrs
- 99.0%
Air-quality risk 4/10 · Minor
- Unhealthy air days now
- 6 days/yr
- Unhealthy air days in 30 yrs
- 7 days/yr
Risk factors via First Street. Map © Google.
Why this score? — see what drove the C- grade
The composite is a weighted blend of 9 inputs, each scored 0–100. Each bar is that input's sub-score; the figure is the points it added to the 100-point composite (weight × sub-score).
- ARV discount +15.0/15.0
- Cash flow +12.8/30.0
- Schools +4.3/10.0
- Livability +4.3/5.0
- 1% rule +4.1/10.0
- Rent growth +3.9/5.0
- DSCR +3.8/10.0
- Condition / age +2.5/5.0
- Appreciation +0.0/10.0
$220,000
🖨 Deal sheet 📄 Offer letter ✓ Due diligence
Listing remarks
* * Reduced $10,000!! * * AND. .. This home is eligible for a Conventional Loan that requires 0% down (and No PMI). * * * That's right 0% Down AND No PMI!!! * * * . This 3 bedroom, 2 bathroom home offers an open-concept floor plan, 1,150 square feet, PLUS a bonus room of nearly 300 square feet that is not included in the home’s heated and cooled square footage—giving you even more usable space for a home office, playroom, second living area, or hobby room. Inside, you’ll find a very practical layout, NEW Oven, NEW Dishwasher, a walk-in closet in the primary bedroom, and a 2-car garage with and additional refrigerator and added cabinetry for added storage and conve
Key facts
- Bonus room
- Walk in closet
- 9,147 sq ft lot
Tags
Property features AI
Finance
- HOA & community: Street lights in the community
Exterior
- Parking: Attached garage with 2 spaces
- Utilities: Public sewer
- Home design: Single-story; Lot dimensions approximately 134 x 70 x 134 x 70
- Exterior features: Fully fenced yard; Public maintained paved road access
Interior
- Kitchen: Dishwasher; Icemaker; Oven; Range; Refrigerator
- Bedrooms: Bedroom 2 (10 x 9); Bedroom 3 (10 x 11)
- Flooring: Tile
- Bathrooms: 2 full bathrooms
- Heating & cooling: Central heating (Electric and Wood); Central air conditioning (Electric)
- Interior features: High ceilings; Tile flooring; Fireplace
Neighborhood map
What this means for you Summary
Snapshot
- This is a 3-bed/2.0-bath single-family listed at $220k.
Deal economics
- At list price, monthly cash flow is $-19 ($-227/yr) — negative.
- To cash-flow at today's rent, offer at most $217k (1.5% below list).
- To meet the 1% rule (rent ≥ 1% of price), the offer needs to be $199k (9.5% below list).
- Recommended offer: $199k (9.5% below list) — sets the bar for 1% rule.
- Cap rate 6.2% vs local median 4.2% in Tallahassee — top-decile yield for the area; either an underpriced asset or a hidden risk that comps aren't pricing in. Stress-test before assuming the spread holds.
Location & tenants
- Location reads 86/100 on livability (#19 in FL, #429 nationally) — a professional / high-income tenant draw. Strengths: amenities A+, commute A+, health & safety A+; Watch: employment D.
- Leon (urban): math 48% / reading 53% proficiency, ranked #33 of 73 in FL (top 45%) — acceptable for families but not a draw, mixed tenant base, ~2y average lease.
- Market conditions: Rents rising fast (+5.5%/yr); 117 active listings in the ZIP; 8 comparable units currently listed for rent nearby; rentals at typical pace (median 21d on market — plan ~3-4 weeks tenant-placement turnaround); solid renter incomes; 1,765 units permitted in Leon County in 2024 (975 in 5+ unit buildings).
Forward outlook
- Local home prices are declining (-3.0%/yr); year-one equity from $2k of loan paydown is wiped out by about $7k of value loss. Plan a longer hold.
- Leon County population projected at +23% by 2050 — long-run rental-demand tailwind backs the buy-and-hold thesis.
Negotiation context
- It's been on market 45 days — a 3% lower offer ($213k) is reasonable based on typical stale-listing flexibility.
- 3 sale attempts since 20y ago with the ask held roughly flat each time — persistent listings suggest the price (not the market) is what's stuck; bring a comps-based counter.
- Current owner paid $46k; list at $220k implies a 379% gain — meaningful room to come down on a strong offer.
Risks & watch-outs
- Climate carrying-cost: severe wind risk, 99% chance of damaging wind over 30y; extreme-heat days projected 7→20/yr by 2055 (HVAC capex compounding) — expect insurance premiums to compound above CPI over the hold.
Questions for the listing agent
- What do current leases actually rent for vs. the listed asking? Can we see a recent rent roll and the last 12 months of T-12 income?
- It's been on market 45 days. Have you received any prior offers? Is the seller open to a 9% concession, seller financing, or rate buy-down credit?
- Built in 1978 — when were the roof, HVAC, electrical panel, plumbing, and water heater last replaced?
- Is there a deadline driving the sale (1031 exchange, divorce, estate, relocation)? That informs how much negotiation room exists.
- Schools are B-rated — typically a magnet for longer-tenancy family renters. What's the average tenant stay here, and is there a school-zone premium baked into asking?
- What's the average days-on-market for RENTAL listings here right now (not sales)? A rising rental-DOM trend means longer vacancies and softer asking-rent achievability than the comps imply.
- What's the recent tenant-quality profile in this submarket — average credit score on applications, eviction rate, late-payment / NSF rate, and stable-employment percentage? A property-management company in the area should have these aggregated.
- How much new for-sale + rental construction is in the pipeline within 1–3 miles? Heavy new supply typically softens prices + rents 12–24 months out; constrained supply supports both.
Investment metrics
- 1% rule
- 0.91% ✗
- Cap rate
- 6.19%
- Cash-on-cash
- -0.37%
- DSCR
- 0.98
- GRM
- 9.2
CMA / ARV
- ARV (on-the-fly)
- $412,720
- Comps found
- 9
Show comp detail 9 sales within ~0.75 mi
| Address | Dist | Beds/Ba | Sqft | Sold | Price | $/sf | Match |
|---|---|---|---|---|---|---|---|
| 4075 Old Plantation Loop | 0.52mi | 3/2.0 | 1,706 (-9%) | 6mo | $399,000 | $234 | 56 |
| 4017 Old Plantation Loop | 0.58mi | 3/2.0 | 1,706 (-9%) | 4mo | $362,000 | $212 | 55 |
| 3611 Hood Ct | 0.09mi | 4/2.0 (+1) | 1,664 (-11%) | 23mo | $247,500 | $149 | 53 |
| 1029 Carrin Dr | 0.29mi | 3/2.0 | 2,064 (+10%) | 22mo | $215,000 | $104 | 52 |
| 4024 Old Plantation Loop | 0.59mi | 3/2.0 | 1,706 (-9%) | 11mo | $375,000 | $220 | 48 |
| 4021 Old Plantation Loop | 0.57mi | 3/2.0 | 1,706 (-9%) | 12mo | $360,000 | $211 | 48 |
| 4071 Old Plantation Loop | 0.52mi | 3/2.0 | 1,706 (-9%) | 17mo | $392,000 | $230 | 46 |
| 4092 Old Plantation Loop | 0.48mi | 3/2.0 | 1,638 (-13%) | 13mo | $375,000 | $229 | 46 |
| 1417 Southwood Plantation Rd | 0.62mi | 3/2.0 | 1,604 (-14%) | 4mo | $412,500 | $257 | 43 |
Match score weights: distance 35% · size 25% · config 20% · recency 20%. Top-matched comps best support the ARV.
Projected returns pro-forma
-3.0% appreciation · 5.55% rent growth · sell at horizon
- IRR
- -13.9%
- Equity multiple
- 0.49×
- Total profit
- $-31,541
- Equity at exit
- $32,803
- IRR
- -1.3%
- Equity multiple
- 0.90×
- Total profit
- $-6,060
- Equity at exit
- $19,022
Cash invested: $61,600 (down + closing). Projections, not guarantees.
Landlord ↔ Tenant lean methodology
- Overall (STATE)
- 87 Strongly Landlord-Friendly
- State Florida
- 87 Strongly Landlord-Friendly · R+3
- County
- — inherits STATE
- City
- — inherits STATE
ZIP-level market 32311
- Home prices YoY
- -27.5%
- Rents YoY
- 5.5%
- Active inventory
- 117
- Price-to-rent
- 9.2×
Monthly cashflow live
- Estimated rent
- $1,992 high interval (Pro) →
- Mortgage (P&I)
- −$1,154
- Tax from tax record
- −$347 /mo · $4,164/yr
- Insurance
- −$92
- HOA
- −$0
- Vacancy / Maint / Mgmt
- −$418
- Net cashflow
- $-19
Break-even live
UW: 25.0% down · 7.5% · 30yr · 1.5% tax · 5.0% vac · 8.0% maint · 8.0% mgmt
Financing live
Cash to close
- Down payment
- $55,000
- Closing costs
- $6,600
- Reserves months
- —
- Total cash needed
- —
Loan-product check · same deal, 3 products live
Conventional
25% down · 7.5% · 30yr
- Down + closing
- —
- Monthly P&I
- —
- Monthly cashflow
- —
- DSCR
- —
- Eligible?
- —
Personal DTI + credit; lowest rate.
DSCR
20% down · 8.5% · 30yr
- Down + closing
- —
- Monthly P&I
- —
- Monthly cashflow
- —
- DSCR
- —
- Eligible?
- —
No personal income docs; deal must DSCR.
Hard money
10% down · 12.0% · 12mo
- Down + closing
- —
- Monthly P&I
- —
- Monthly cashflow
- —
- DSCR
- —
- Eligible?
- —
Short-term bridge; refi at stabilization.
Rent comps 8 comps
| Address | Beds | Baths | Sqft | Rent | $/sqft | DOM | Units | Dist |
|---|---|---|---|---|---|---|---|---|
| 3909 Reserve Dr Tallahassee, FL | 1.0–3.0 | 1.0–2.0 | 1220 | $1,825 | $1.50 | 13d | 1 | 0.41mi |
| 3148 Dick Wilson Blvd Tallahassee, FL | 1.0–3.0 | 1.0–2.0 | 1536 | $1,940 | $1.26 | 13d | 14 | 0.52mi |
| 2912 Capital Park Dr Tallahassee, FL | 3.0 | 2.0 | 1236 | $1,650 | $1.33 | 13d | 1 | 1.17mi |
| 1736 Augustine Pl Tallahassee, FL | 3.0 | 2.0 | 1400 | $2,000 | $1.43 | 21d | 1 | 1.21mi |
| 430 Grail Ct Tallahassee, FL | 3.0 | 2.0 | 1252 | $2,300 | $1.84 | 21d | 1 | 1.26mi |
| 2750 Old Saint Augustine Rd Tallahassee, FL | 1.0–3.0 | 1.0–2.0 | 1230 | $1,739 | $1.41 | 21d | 2 | 1.27mi |
| 432 Merlin Way Tallahassee, FL | 3.0 | 2.0 | 1453 | $2,150 | $1.48 | 21d | 1 | 1.44mi |
| 1320 Hendrix Rd #301 Tallahassee, FL | 3.0 | 2.5 | 1554 | $1,695 | $1.09 | 21d | 1 | 1.48mi |
Listing history 25 events
-
2026-06-18days on market $220,000 Active 45 DOM
-
2026-06-17days on market $220,000 Active 44 DOM
-
2026-06-16days on market $220,000 Active 43 DOM
-
2026-06-15days on market $220,000 Active 42 DOM
-
2026-06-14days on market $220,000 Active 40 DOM
-
2026-06-10days on market $220,000 Active 37 DOM
-
2026-06-09days on market $220,000 Active 36 DOM
-
2026-06-08days on market $220,000 Active 35 DOM
-
2026-06-07days on market $220,000 Active 34 DOM
-
2026-06-05pricedays on market $220,000 Active 31 DOM
-
2026-06-03days on market $230,000 Active 30 DOM
-
2026-06-02days on market $230,000 Active 29 DOM
-
2026-06-01days on market $230,000 Active 28 DOM
-
2026-05-31days on market $230,000 Active 27 DOM
-
2026-05-30days on market $230,000 Active 26 DOM
-
2026-05-11status Active
-
2026-03-27historical Active Under Contract
-
2026-03-27historical
-
2026-03-27price $230,000
-
2026-03-20$225,000 Active
-
2014-05-29soldstatus $45,900
-
2007-04-05historical
-
2006-10-05$175,000
-
2004-12-15soldstatus $125,000
-
1981-04-01soldstatus $58,500
ⓘ Source: listings_history table (triggers on properties + properties_extension) + one-shot
backfill from property_details.listing_events for pre-trigger history.
Tax reassessment forecast FL · Resets to sale price
- Current annual tax
- $4,164 · $347/mo
- Projected year-2 tax
- $4,164 · $347/mo
- Expected delta
- $0/yr ($0/mo · 0.0%)
ⓘ Screening estimate from a state-policy table — verify with the county assessor before closing.
Climate risk First Street
- Flood 1/10 Low FEMA zone X (unshaded) · 0% chance over 30 yrs
- Wildfire 2/10 Low
- Heat 8/10 Severe 7 d/yr ≥108°F today · 20 d/yr by 30 yrs out
- Wind 9/10 Extreme 99% chance of damaging wind over 30 yrs
- Air quality 4/10 Moderate 6 unhealthy d/yr today · 7 by 30 yrs out
Nearby sold comps map
Loading sold comps map…
Walkable amenities ~0.75 mi
Loading nearby amenities…
Taxation est. · year 1
- Rental income
- $23,900
- − Mortgage interest
- −$12,323
- − Property taxes
- −$4,164
- − Insurance
- −$1,100
- − Repairs & maintenance
- −$1,912
- − Management
- −$1,912
- − Depreciation
- −$6,400
- Taxable loss
- −$3,911
- Est. tax savings @ 24.0%
- +$939
- After-tax cash flow
- $711/yr
For passive investors: Depreciation is non-cash, so a rental often shows a tax loss while cash-flowing — sheltering income. Rental losses are passive: they offset passive income freely, and up to $25,000/yr can offset ordinary (W-2) income if you actively participate and your MAGI is under $100k (phasing out to $0 by $150k); unused losses carry forward. On sale, claimed depreciation is recaptured at up to 25%, and gains may owe capital-gains tax (a 1031 exchange can defer both). Figures are a year-1 estimate at your 24.0% rate — not tax advice; consult a CPA.
Schools (NCES district)
- District
- Leon
- NCES district ID
- 1201110
- Math proficiency
- 48% ▼ -13.00%
- Reading proficiency
- 53% ▼ -5.00%
- Median HH income
- $46,339
- Composite
- 42.84/100
- National rank
- #3131
- State rank
- #33 of 73 in FL
Livability — Tallahassee
- Score
- 86/100
- State rank
- #19
- US rank
- #429
Category grades
Schools grade is shown separately in the Schools card above.
Census & demographics
- Census place
- Tallahassee, FL
- County
- Leon County · 294,472 people
- City population
- 294,472
- Metro
- Tallahassee, FL
- Population (ZIP)
- 21,905
- Household income
- $81,243
- Rent vs Own
- Severe rent burden
- 795.0
Population outlook (Leon County) Hauer SSP2
- Today (2025)
- 315,507 people
- By 2030
- 330,677 · +4.8%
- By 2040
- 358,465 · +13.6%
- By 2050
- 386,804 · +22.6%
- By 2075
- 465,480 · +47.5%
- By 2100
- 519,959 · +64.8%
Race, ethnicity, and origin ACS 2023
- Neighborhood character
- Diverse neighborhood (Simpson 0.64)
- Race & ethnicity
- White 52% Black 27% Two or more races 10% Hispanic / Latino 9% Asian 6%
- Hispanic origin (detail)
- Mexican 2% Puerto Rican 1% Cuban 1%
- Common ancestry
- Romanian 2% Serbian 2% Slovak 2%
- Foreign-born
- 11% · Canada, Jamaica
- Languages at home
- 86% English-only · Spanish 6% Other Indo-European 3% Other Asian/Pacific 2%
Political lean MEDSL · Leon
- 2024 margin
- Strong D (+21.8) · D 60.3% · R 38.5% · Other 1.2%
- 2008→2024 swing
- -2.5pp toward R · 2008: 24.3pp · 2024: 21.8pp
- All cycles
- 2024: D+21.8 2020: D+28.3 2016: D+25.1 2012: D+23.6 2008: D+24.3
Not yet ingested
- Civics
- —
Market trends
- HPI YoY
- ▼ -90.68%
- Current HPI
- 238.8804
- Rent YoY
- ▲ 5.55%
- Metro
- Tallahassee, FL
- State GDP YoY
- ▲ 3.28%
- F500 in state
- 36
Industry mix (Fortune 500 HQ in FL)
| Industry | F500 HQs | Revenue |
|---|---|---|
| Industrial Technology | 2 | $29B |
|
||
| Insurance | 2 | $17B |
|
||
| Retail | 1 | $60B |
|
||
| Technology Distribution | 1 | $58B |
|
||
| Homebuilding | 1 | $35B |
|
||
| Technology Manufacturing | 1 | $35B |
|
||
Price history
+293.2% since first listed10 events — show timeline
- 2026-05-11 Relisted — CATRS
- 2026-03-27 Contingent — CATRS
- 2026-03-27 Price Changed $230,000 CATRS
- 2026-03-27 Listing Removed — CATRS
- 2026-03-20 Listed $225,000 CATRS
- 2014-05-29 Sold (Public Records) $45,900 Public Records
- 2007-04-05 Listing Removed — CATRS
- 2006-10-05 Listed $175,000 CATRS
- 2004-12-15 Sold (Public Records) $125,000 Public Records
- 1981-04-01 Sold (Public Records) $58,500 Public Records
Property tax history
+7.9%/yrLatest (2025): $4,164 · +6.4% YoY. Source: county tax records.
Cash-flow waterfall
monthlySold comps — $/sqft
last 12 mo · ≤1 miLoading sold comps…