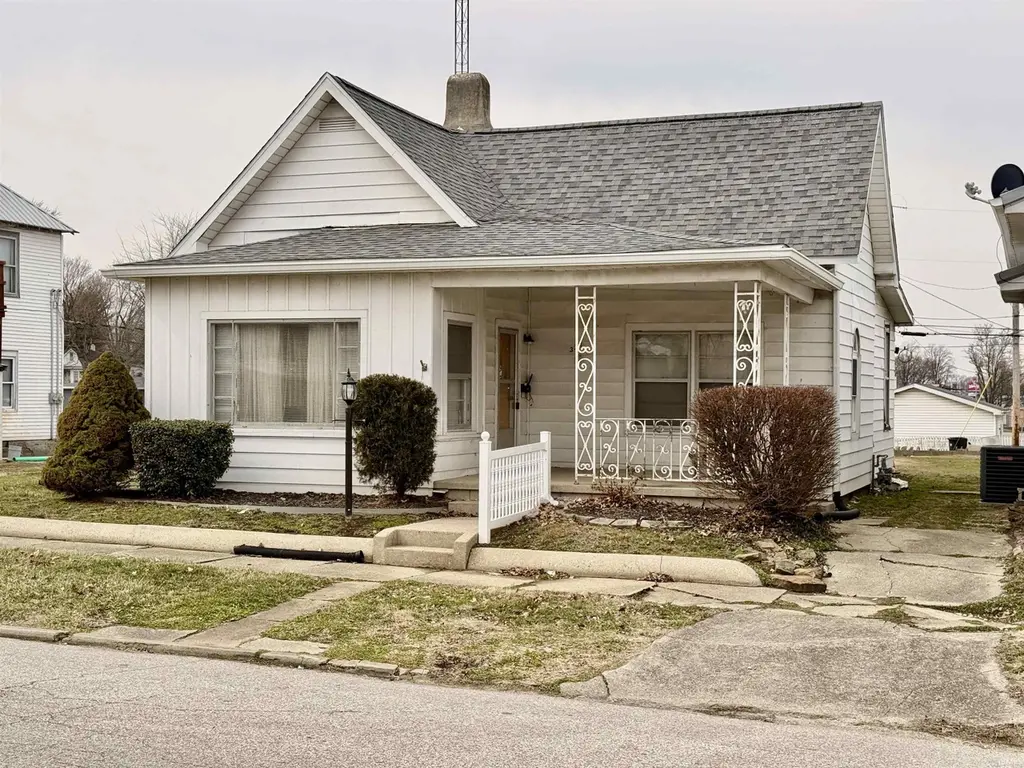
321 SE 7th St · Washington, IN
Flood risk 1/10 · Minimal
- FEMA flood zone
- —
- Chance of flooding over 30 yrs
- 0.0%
- Est. flood insurance / yr
- —
Fire risk 3/10 · Minor
- Est. fire insurance / yr
- $717 – $1,331
Heat risk 5/10 · Moderate
- Hot days now (above 106°F)
- 7 days/yr
- Hot days in 30 yrs
- 19 days/yr
Wind risk 2/10 · Minimal
- Chance of severe wind over 30 yrs
- 2.0%
Air-quality risk 4/10 · Minor
- Unhealthy air days now
- 3 days/yr
- Unhealthy air days in 30 yrs
- 5 days/yr
Risk factors via First Street. Map © Google.
Why this score? — see what drove the B+ grade
The composite is a weighted blend of 9 inputs, each scored 0–100. Each bar is that input's sub-score; the figure is the points it added to the 100-point composite (weight × sub-score).
- Cash flow +30.0/30.0
- ARV discount +15.0/15.0
- 1% rule +10.0/10.0
- DSCR +10.0/10.0
- Livability +3.6/5.0
- Schools +3.2/10.0
- Rent growth +2.5/5.0
- Condition / age +2.5/5.0
- Appreciation +0.0/10.0
$95,000
🖨 Deal sheet 📄 Offer letter ✓ Due diligence
Listing remarks MLS
This 2-bedroom, 1-bath home offers practical updates and flexible living space. A roof installed just two years ago and an efficient gas furnace provide added reliability. The inviting front porch adds character, while the rear mudroom offers versatile use as a home office, drop zone, or additional storage. The unfinished basement provides ample storage and potential for future finishing. Conveniently located near National Highway, the home offers easy access to shopping, dining, and everyday amenities.
Key facts
- Rear mudroom
- Inviting front porch
- Unfinished basement
Tags
Neighborhood map
What this means for you Summary
Snapshot
- This is a 2-bed/1.0-bath single-family listed at $95k.
Deal economics
- At list price, monthly cash flow is $573 ($7k/yr) — positive.
- The deal already cash-flows at list — no discount required.
- Meets the 1% rule at list price ($1k rent vs $95k).
- Recommended offer: $86k (9.0% below list) — sets the bar for market timing.
- Cap rate 13.5% vs local median 4.9% in Washington — top-decile yield for the area; either an underpriced asset or a hidden risk that comps aren't pricing in. Stress-test before assuming the spread holds.
Location & tenants
- Location reads 72/100 on livability (#110 in IN) — a middle-class / working-renter tenant base. Strengths: cost of living A+, housing A+, health & safety A+; Watch: amenities F, commute F, employment F.
- Washington Community Schools (town): math 36% / reading 38% proficiency, ranked #174 of 301 in IN (top 58%) — families likely to look elsewhere, expect single-tenant / working-renter base with shorter leases.
- Market conditions: 112 active listings in the ZIP; 3 comparable units currently listed for rent nearby; rentals lingering (median 44d on market — plan ~5-8 weeks vacancy on turnover, expect pricing pressure); 100% of comp listings sitting > 30 days — soft ceiling on asking rent; 71 units permitted in Daviess County in 2024 (0 in 5+ unit buildings).
Forward outlook
- Local home prices are declining (-3.0%/yr); year-one equity from $657 of loan paydown is wiped out by about $3k of value loss. Plan a longer hold.
- Daviess County population projected at +6% by 2050 — modest demand growth; plan on rents tracking national, not racing it.
- At projected returns (-3.0% appreciation + 3.0% rent growth), your $27k cash investment doubles in ~5 years — after that, you're playing with house money.
Negotiation context
- It's been on market 114 days — a 9% lower offer ($86k) is reasonable based on typical stale-listing flexibility.
- 3 sale attempts since 3y ago with the ask held roughly flat each time — persistent listings suggest the price (not the market) is what's stuck; bring a comps-based counter.
Risks & watch-outs
- Watch-outs: built in 1900 — expect roof / HVAC / electrical / plumbing capex.
- Climate carrying-cost: extreme-heat days projected 7→19/yr by 2055 (HVAC capex compounding) — expect insurance premiums to compound above CPI over the hold.
Questions for the listing agent
- It's been on market 114 days. Have you received any prior offers? Is the seller open to a 9% concession, seller financing, or rate buy-down credit?
- Built in 1900 — when were the roof, HVAC, electrical panel, plumbing, and water heater last replaced?
- Why hasn't it sold? Are there any deal-killer items the seller is aware of (foundation, flood, title, zoning, code violations)?
- Is there a deadline driving the sale (1031 exchange, divorce, estate, relocation)? That informs how much negotiation room exists.
- What's the average days-on-market for RENTAL listings here right now (not sales)? A rising rental-DOM trend means longer vacancies and softer asking-rent achievability than the comps imply.
- What's the recent tenant-quality profile in this submarket — average credit score on applications, eviction rate, late-payment / NSF rate, and stable-employment percentage? A property-management company in the area should have these aggregated.
- How much new for-sale + rental construction is in the pipeline within 1–3 miles? Heavy new supply typically softens prices + rents 12–24 months out; constrained supply supports both.
Investment metrics
- 1% rule
- 1.55% ✓
- Cap rate
- 13.53%
- Cash-on-cash
- 25.85%
- DSCR
- 2.15
- GRM
- 5.4
CMA / ARV
- ARV (median comp)
- $146,103
- List price
- $95,000
- Delta
- -34.98%
- Verdict
- UNDERPRICED
- Comps
- 20 within 1.0 mi
Show comp detail 12 sales within ~0.75 mi
| Address | Dist | Beds/Ba | Sqft | Sold | Price | $/sf | Match |
|---|---|---|---|---|---|---|---|
| 317 SE 7th St | 0.02mi | 2/1.0 | 1,051 (-13%) | 2mo | $162,500 | $155 | 76 |
| 107 NE 2nd St | 0.49mi | 2/1.0 | 1,228 (+2%) | 2mo | $95,000 | $77 | 72 |
| 415 E William St | 0.60mi | 2/1.0 | 1,211 (+1%) | 2mo | $138,000 | $114 | 70 |
| 102 Sycamore St | 0.49mi | 2/1.0 | 1,120 (-7%) | 2mo | $174,500 | $156 | 64 |
| 106 NE 10th St | 0.42mi | 2/1.0 | 1,088 (-10%) | 6mo | $55,000 | $51 | 60 |
| 500 E Maple St | 0.70mi | 3/1.5 (+1) | 1,208 (+0%) | 4mo | $110,000 | $91 | 57 |
| 1109 Washington Ave | 0.32mi | 3/2.0 (+1) | 1,328 (+10%) | 3mo | $196,000 | $148 | 56 |
| 705 SW 1st St | 0.51mi | 2/2.0 | 1,116 (-7%) | 5mo | $170,000 | $152 | 55 |
| 310 N Meridian St | 0.66mi | 3/1.5 (+1) | 1,229 (+2%) | 5mo | $82,000 | $67 | 55 |
| 201 SW 3rd St | 0.62mi | 2/2.0 | 1,260 (+5%) | 6mo | $175,000 | $139 | 54 |
| 502 W Sycamore St | 0.71mi | 3/1.5 (+1) | 1,152 (-4%) | 1mo | $225,000 | $195 | 52 |
| 16 Kelly Dr | 0.71mi | 3/1.0 (+1) | 1,120 (-7%) | 0mo | $145,000 | $129 | 50 |
Match score weights: distance 35% · size 25% · config 20% · recency 20%. Top-matched comps best support the ARV.
Projected returns pro-forma
-3.0% appreciation · 3.0% rent growth · sell at horizon
- IRR
- 19.5%
- Equity multiple
- 1.79×
- Total profit
- $21,085
- Equity at exit
- $14,165
- IRR
- 27.8%
- Equity multiple
- 3.45×
- Total profit
- $65,283
- Equity at exit
- $8,214
Cash invested: $26,600 (down + closing). Projections, not guarantees.
Landlord ↔ Tenant lean methodology
- Overall (STATE)
- 90 Strongly Landlord-Friendly
- State Indiana
- 90 Strongly Landlord-Friendly · R+11
- County
- — inherits STATE
- City
- — inherits STATE
ZIP-level market 47501
- Home prices YoY
- -23.2%
- Active inventory
- 112
- Price-to-rent
- 5.4×
Monthly cashflow live
- Estimated rent
- $1,474 medium interval (Pro) →
- Mortgage (P&I)
- −$498
- Tax from tax record
- −$54 /mo · $645/yr
- Insurance
- −$40
- HOA
- −$0
- Vacancy / Maint / Mgmt
- −$310
- Net cashflow
- $573
Break-even live
UW: 25.0% down · 7.5% · 30yr · 1.5% tax · 5.0% vac · 8.0% maint · 8.0% mgmt
Financing live
Cash to close
- Down payment
- $23,750
- Closing costs
- $2,850
- Reserves months
- —
- Total cash needed
- —
Loan-product check · same deal, 3 products live
Conventional
25% down · 7.5% · 30yr
- Down + closing
- —
- Monthly P&I
- —
- Monthly cashflow
- —
- DSCR
- —
- Eligible?
- —
Personal DTI + credit; lowest rate.
DSCR
20% down · 8.5% · 30yr
- Down + closing
- —
- Monthly P&I
- —
- Monthly cashflow
- —
- DSCR
- —
- Eligible?
- —
No personal income docs; deal must DSCR.
Hard money
10% down · 12.0% · 12mo
- Down + closing
- —
- Monthly P&I
- —
- Monthly cashflow
- —
- DSCR
- —
- Eligible?
- —
Short-term bridge; refi at stabilization.
Rent comps 3 comps
| Address | Beds | Baths | Sqft | Rent | $/sqft | DOM | Units | Dist |
|---|---|---|---|---|---|---|---|---|
| 2005 E National Hwy Washington, IN | 1.0–2.0 | 1.0–1.5 | 960 | $1,250 | $1.30 | 44d | 1 | 0.89mi |
| 499 S 100 E Apt 12 Washington, IN | 3.0 | 2.5 | 1500 | $1,500 | $1.00 | 44d | 1 | 1.09mi |
| 8 Longbranch Dr Unit NA Washington, IN | 3.0 | 2.0 | 1340 | $1,700 | $1.27 | 44d | 1 | 1.12mi |
Listing history 20 events
-
2026-06-18days on market $95,000 Active 114 DOM
-
2026-06-17days on market $95,000 Active 113 DOM
-
2026-06-16days on market $95,000 Active 112 DOM
-
2026-06-15days on market $95,000 Active 111 DOM
-
2026-06-13days on market $95,000 Active 109 DOM
-
2026-06-12days on market $95,000 Active 108 DOM
-
2026-06-09days on market $95,000 Active 105 DOM
-
2026-06-08days on market $95,000 Active 104 DOM
-
2026-06-07days on market $95,000 Active 103 DOM
-
2026-06-07days on market $95,000 Active 102 DOM
-
2026-06-04days on market $95,000 Active 99 DOM
-
2026-06-02days on market $95,000 Active 98 DOM
-
2026-06-01days on market $95,000 Active 97 DOM
-
2026-05-31days on market $95,000 Active 96 DOM
-
2026-05-31days on market $95,000 Active 95 DOM
-
2026-02-24$95,000 Active 508-char remark
Show marketing remark (508 chars)
This 2-bedroom, 1-bath home offers practical updates and flexible living space. A roof installed just two years ago and an efficient gas furnace provide added reliability. The inviting front porch adds character, while the rear mudroom offers versatile use as a home office, drop zone, or additional storage. The unfinished basement provides ample storage and potential for future finishing. Conveniently located near National Highway, the home offers easy access to shopping, dining, and everyday amenities.
-
2024-10-25$99,000 Active
-
2024-03-08price $99,900
-
2023-12-12price $104,900
-
2023-09-05$109,900 Active
ⓘ Source: listings_history table (triggers on properties + properties_extension) + one-shot
backfill from property_details.listing_events for pre-trigger history.
Tax reassessment forecast IN · Partial reset (capped growth)
- Current annual tax
- $645 · $54/mo
- Projected year-2 tax
- $726 · $61/mo
- Expected delta
- +$81/yr (+$7/mo · 12.6%)
ⓘ Screening estimate from a state-policy table — verify with the county assessor before closing.
Climate risk First Street
- Flood 1/10 Low 0% chance over 30 yrs
- Wildfire 3/10 Moderate
- Heat 5/10 Major 7 d/yr ≥106°F today · 19 d/yr by 30 yrs out
- Wind 2/10 Low 2% chance of damaging wind over 30 yrs
- Air quality 4/10 Moderate 3 unhealthy d/yr today · 5 by 30 yrs out
Nearby sold comps map
Loading sold comps map…
Walkable amenities ~0.75 mi
Loading nearby amenities…
Taxation est. · year 1
- Rental income
- $17,690
- − Mortgage interest
- −$5,321
- − Property taxes
- −$645
- − Insurance
- −$475
- − Repairs & maintenance
- −$1,415
- − Management
- −$1,415
- − Depreciation
- −$2,764
- Taxable income
- $5,654
- Est. tax owed @ 24.0%
- −$1,357
- After-tax cash flow
- $5,519/yr
For passive investors: Depreciation is non-cash, so a rental often shows a tax loss while cash-flowing — sheltering income. Rental losses are passive: they offset passive income freely, and up to $25,000/yr can offset ordinary (W-2) income if you actively participate and your MAGI is under $100k (phasing out to $0 by $150k); unused losses carry forward. On sale, claimed depreciation is recaptured at up to 25%, and gains may owe capital-gains tax (a 1031 exchange can defer both). Figures are a year-1 estimate at your 24.0% rate — not tax advice; consult a CPA.
Schools (NCES district)
- District
- Washington Community Schools
- NCES district ID
- 1812450
- Math proficiency
- 36% ▼ -1.00%
- Reading proficiency
- 38% ▼ -3.00%
- Median HH income
- $45,422
- Composite
- 31.57/100
- National rank
- #5952
- State rank
- #174 of 301 in IN
Livability — Washington
- Score
- 72/100
- State rank
- #110
- US rank
- #5706
Category grades
Schools grade is shown separately in the Schools card above.
Census & demographics
- Census place
- Washington, IN
- City population
- 18,335
- Population (ZIP)
- 18,335
Population outlook (Daviess County) Hauer SSP2
- Today (2025)
- 33,940 people
- By 2030
- 34,457 · +1.5%
- By 2040
- 35,412 · +4.3%
- By 2050
- 35,803 · +5.5%
- By 2075
- 35,173 · +3.6%
- By 2100
- 29,799 · -12.2%
Race, ethnicity, and origin ACS 2023
- Neighborhood character
- Predominantly White (81%)
- Race & ethnicity
- White 81% Hispanic / Latino 11% Two or more races 8% Black 3%
- Hispanic origin (detail)
- Mexican 9%
- Common ancestry
- Hispanic 4% Lithuanian 2% Slovak 1%
- Foreign-born
- 7% · Canada
- Languages at home
- 89% English-only · Spanish 5% French/Haitian/Cajun 3% German/W. Germanic 1%
Political lean MEDSL · Daviess
- 2024 margin
- Solid R (+64.3) · D 17.1% · R 81.5% · Other 1.4%
- 2008→2024 swing
- -29.1pp toward R · 2008: -35.2pp · 2024: -64.3pp
- All cycles
- 2024: R+64.3 2020: R+62.0 2016: R+62.8 2012: R+50.8 2008: R+35.2
Not yet ingested
- Civics
- —
Market trends
- HPI YoY
- ▼ -64.30%
- Current HPI
- 213.3049
- Rent YoY
- —
- Metro
- —
- State GDP YoY
- ▲ 2.90%
- F500 in state
- 18
Industry mix (Fortune 500 HQ in IN)
| Industry | F500 HQs | Revenue |
|---|---|---|
| Industrial Machinery | 2 | $37B |
|
||
| Healthcare | 1 | $177B |
|
||
| Pharmaceuticals | 1 | $45B |
|
||
| Metals / Steel | 1 | $18B |
|
||
| Agriculture | 1 | $17B |
|
||
| Packaging | 1 | $12B |
|
||
Price history
-13.6% since first listed5 events — show timeline
- 2026-02-24 Listed $95,000 IRMLS
- 2024-10-25 Listed $99,000 IRMLS
- 2024-03-08 Price Changed $99,900 IRMLS
- 2023-12-12 Price Changed $104,900 IRMLS
- 2023-09-05 Listed $109,900 IRMLS
Property tax history
+2.2%/yrLatest (2024): $645 · +12.5% YoY. Source: county tax records.
Cash-flow waterfall
monthlySold comps — $/sqft
last 12 mo · ≤1 miLoading sold comps…