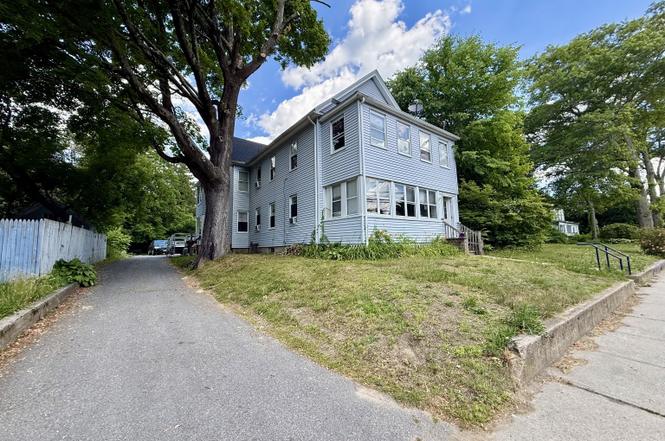
 Duplex
185-187 Main St · Plainfield, CT
Flood risk 1/10 · Minimal
- FEMA flood zone
- X (unshaded)
- Chance of flooding over 30 yrs
- 0.0%
- Est. flood insurance / yr
- $473 – $860
Fire risk 3/10 · Minor
- Est. fire insurance / yr
- $829 – $1,539
Heat risk 4/10 · Minor
- Hot days now (above 95°F)
- 7 days/yr
- Hot days in 30 yrs
- 15 days/yr
Wind risk 6/10 · Moderate
- Chance of severe wind over 30 yrs
- 61.0%
Air-quality risk 3/10 · Minor
- Unhealthy air days now
- 2 days/yr
- Unhealthy air days in 30 yrs
- 3 days/yr
Risk factors via First Street. Map © Google.
Why this score? — see what drove the B- grade
The composite is a weighted blend of 9 inputs, each scored 0–100. Each bar is that input's sub-score; the figure is the points it added to the 100-point composite (weight × sub-score).
- Cash flow +21.5/30.0
- ARV discount +14.3/15.0
- Appreciation +9.6/10.0
- DSCR +6.9/10.0
- 1% rule +5.7/10.0
- Schools +2.9/10.0
- Condition / age +2.8/5.0
- Rent growth +2.5/5.0
- Livability +2.5/5.0
$329,900
🖨 Deal sheet 📄 Offer letter ✓ Due diligence
Multi-family units
County records classify this as Multi-Family (2-4 Unit). Listing-text estimate: 2 units. confirmed
Listing remarks
Investment Opportunity in the Heart of Moosup! Welcome to 185-187 Main Street, a spacious duplex offering over 3,200 square feet of living space. Each unit has a spacious kitchen, dining and living room. Three bed and one bath per unit. Fully finished attic space adds so much value and features its very own kitchen and full bathroom. Onsite is a three car detached garage. Easy access to I-395 for work and recreational purposes. BRAND NEW roof was just installed.
Key facts
- Brand new roof
- Spacious duplex
- Easy access to i-395
Tags
Property features AI
Exterior
- Parking: Detached garage; 3-car garage
- Utilities: Public water connected; Public sewer connected; Hot water: oil and tankless
- Home design: Multi-family property (2-family)
- Construction: Frame construction; Stone foundation; Asphalt shingle roof
- Exterior features: Level lot; Vinyl siding; Blue exterior
Interior
- Bedrooms: 6 bedrooms (total across units)
- Bathrooms: 2 full bathrooms (total)
- Heating & cooling: Hot water and steam heating; Heating fuel: oil and electricity; Oil fuel tank located in the basement
- Interior features: 12 total rooms; Full basement; Finished walk-up attic; Property configured as a two-family (2 units)
- Laundry & utility: Laundry hook-ups in both units; Tankless hot water
Neighborhood map
What this means for you Summary
Snapshot
- This is a 2 × 3-bed/1.0-bath units multifamily listed at $330k. Condition is rated average.
Deal economics
- At list price, monthly cash flow is $498 ($6k/yr) — positive. Per door: $249/mo.
- The deal already cash-flows at list — no discount required.
- Meets the 1% rule at list price ($4k rent vs $330k).
Location & tenants
- Location reads: area grade B — affects rentability + tenant quality, not the cash-flow math above.
- Plainfield School District (town): math 24% / reading 41% proficiency, ranked #117 of 153 in CT (top 76%) — families likely to look elsewhere, expect single-tenant / working-renter base with shorter leases.
- Market conditions: 27 active listings in the ZIP; 149 units permitted in Northeastern Connecticut Planning Region in 2024 (0 in 5+ unit buildings).
Forward outlook
- In year one you build about $33k of equity ($2k loan paydown + $30k appreciation (9.2% local appreciation)).
- At projected returns (9.2% appreciation + 3.0% rent growth), your $92k cash investment doubles in ~3 years — after that, you're playing with house money.
- By year 2, paydown + projected appreciation supports a ~$52k cash-out refi (75% LTV) — recoverable capital for the next deal without selling this one.
Negotiation context
- Only 1 days on market — expect competitive offers; lowballing is unlikely to land.
Risks & watch-outs
- Watch-outs: built in 1900 — expect roof / HVAC / electrical / plumbing capex.
- Climate carrying-cost: major wind risk, 61% chance of damaging wind over 30y — expect insurance premiums to compound above CPI over the hold.
Questions for the listing agent
- Can we see the unit-by-unit rent roll, current vacancy, and any below-market leases? What's the average tenancy length?
- What capital expenditures (roof, boiler, parking lot, exteriors) have been made in the last 5 years, and what's planned in the next 2?
- Built in 1900 — when were the roof, HVAC, electrical panel, plumbing, and water heater last replaced?
- Is there a deadline driving the sale (1031 exchange, divorce, estate, relocation)? That informs how much negotiation room exists.
- What's the average days-on-market for RENTAL listings here right now (not sales)? A rising rental-DOM trend means longer vacancies and softer asking-rent achievability than the comps imply.
- What's the recent tenant-quality profile in this submarket — average credit score on applications, eviction rate, late-payment / NSF rate, and stable-employment percentage? A property-management company in the area should have these aggregated.
- How much new apartment / multifamily construction is in the pipeline within 1–3 miles? Heavy new supply (>2% of stock underway) typically softens rents 12–24 months out; light construction supports rent growth.
Investment metrics
- 1% rule
- 1.07% ✓
- Cap rate
- 8.10%
- Cash-on-cash
- 6.47%
- DSCR
- 1.29
- GRM
- 7.8
CMA / ARV
- ARV (on-the-fly)
- $388,531
- Comps found
- 3
Show comp detail 3 sales within ~0.75 mi
| Address | Dist | Beds/Ba | Sqft | Sold | Price | $/sf | Match |
|---|---|---|---|---|---|---|---|
| 39-43 Main St | 0.28mi | 5/3.0 (-1) | 2,864 (-11%) | 16mo | $387,500 | $135 | 47 |
| 34-38 Plainfield Rd | 0.66mi | 7/4.0 (+1) | 3,332 (+4%) | 10mo | $275,000 | $83 | 41 |
| 11-13 Union St | 0.47mi | 6/2.0 | 2,799 (-13%) | 19mo | $339,000 | $121 | 40 |
Match score weights: distance 35% · size 25% · config 20% · recency 20%. Top-matched comps best support the ARV.
Projected returns pro-forma
9.19% appreciation · 3.0% rent growth · sell at horizon
- IRR
- 27.4%
- Equity multiple
- 3.09×
- Total profit
- $193,252
- Equity at exit
- $277,863
- IRR
- 24.1%
- Equity multiple
- 6.85×
- Total profit
- $540,316
- Equity at exit
- $579,772
Cash invested: $92,372 (down + closing). Projections, not guarantees.
Landlord ↔ Tenant lean methodology
- Overall (STATE)
- 27 Tenant-Leaning
- State Connecticut
- 27 Tenant-Leaning · D+7
- County
- — inherits STATE
- City
- — inherits STATE
ZIP-level market 06354
- Home prices YoY
- 3.0%
- Active inventory
- 27
- Price-to-rent
- 15.6×
Monthly cashflow live
- Estimated rent
- $3,516 medium interval (Pro) →
- Mortgage (P&I)
- −$1,730
- Tax est. 1.5%
- −$412 /mo · $4,948/yr
- Insurance
- −$137
- HOA
- −$0
- Vacancy / Maint / Mgmt
- −$738
- Net cashflow
- $498
Break-even live
2-unit breakdown (identical units grouped — click to expand)
| Units | Beds | Baths | Est. rent |
|---|---|---|---|
| 2× units | 3 | 1 | $3,516 |
| #1 | 3 | 1 | $1,758 |
| #2 | 3 | 1 | $1,758 |
| Total (2 units) | $3,516 | ||
UW: 25.0% down · 7.5% · 30yr · 1.5% tax · 5.0% vac · 8.0% maint · 8.0% mgmt
Financing live
Cash to close
- Down payment
- $82,475
- Closing costs
- $9,897
- Reserves months
- —
- Total cash needed
- —
Loan-product check · same deal, 3 products live
Conventional
25% down · 7.5% · 30yr
- Down + closing
- —
- Monthly P&I
- —
- Monthly cashflow
- —
- DSCR
- —
- Eligible?
- —
Personal DTI + credit; lowest rate.
DSCR
20% down · 8.5% · 30yr
- Down + closing
- —
- Monthly P&I
- —
- Monthly cashflow
- —
- DSCR
- —
- Eligible?
- —
No personal income docs; deal must DSCR.
Hard money
10% down · 12.0% · 12mo
- Down + closing
- —
- Monthly P&I
- —
- Monthly cashflow
- —
- DSCR
- —
- Eligible?
- —
Short-term bridge; refi at stabilization.
Listing history 2 events
-
2026-06-18remarks 466-char remark
-
2026-06-18$329,900 Coming Soon 1 DOM
ⓘ Source: listings_history table (triggers on properties + properties_extension) + one-shot
backfill from property_details.listing_events for pre-trigger history.
Climate risk First Street
- Flood 1/10 Low FEMA zone X (unshaded) · 0% chance over 30 yrs
- Wildfire 3/10 Moderate
- Heat 4/10 Moderate 7 d/yr ≥95°F today · 15 d/yr by 30 yrs out
- Wind 6/10 Major 61% chance of damaging wind over 30 yrs
- Air quality 3/10 Moderate 2 unhealthy d/yr today · 3 by 30 yrs out
Nearby sold comps map
Loading sold comps map…
Walkable amenities ~0.75 mi
Loading nearby amenities…
Taxation est. · year 1
- Rental income
- $42,192
- − Mortgage interest
- −$18,480
- − Property taxes
- −$4,948
- − Insurance
- −$1,650
- − Repairs & maintenance
- −$3,375
- − Management
- −$3,375
- − Depreciation
- −$9,597
- Taxable income
- $767
- Est. tax owed @ 24.0%
- −$184
- After-tax cash flow
- $5,789/yr
For passive investors: Depreciation is non-cash, so a rental often shows a tax loss while cash-flowing — sheltering income. Rental losses are passive: they offset passive income freely, and up to $25,000/yr can offset ordinary (W-2) income if you actively participate and your MAGI is under $100k (phasing out to $0 by $150k); unused losses carry forward. On sale, claimed depreciation is recaptured at up to 25%, and gains may owe capital-gains tax (a 1031 exchange can defer both). Figures are a year-1 estimate at your 24.0% rate — not tax advice; consult a CPA.
Condition & rehab AI · 13 photos
This two-unit property requires moderate repairs and maintenance to improve its curb appeal and overall condition, making it a solid investment opportunity.
Repairs flagged
- Moderate Exterior siding — Weathered and faded appearance.
- Moderate Paint — Chipped and faded in some areas.
- Moderate Landscaping — Overgrown and needs trimming.
Value-add opportunities
- Resale Painting and updating exterior siding — Fresh paint and siding will enhance curb appeal and property value.
- Both Landscaping and curb appeal improvements — Aesthetic improvements will attract potential buyers and renters.
- Rental HVAC maintenance — A functional HVAC system is crucial for rental properties.
Renovation cost estimate screening
| Repair item | Severity | Est. cost |
|---|---|---|
| Exterior siding · Weathered and faded appearance. | Moderate | $3,000–15,000 |
| Paint · Chipped and faded in some areas. | Moderate | $3,000–15,000 |
| Landscaping · Overgrown and needs trimming. | Moderate | $3,000–15,000 |
| Total estimated repair cost · 3 items | $9,000–45,000 |
Value-add ROI direction
- Resale Painting and updating exterior siding — Fresh paint and siding will enhance curb appeal and property value. ↑
- Both Landscaping and curb appeal improvements — Aesthetic improvements will attract potential buyers and renters. ↑
- Rental HVAC maintenance — A functional HVAC system is crucial for rental properties. ↑
ⓘ Cost ranges are severity-bucket heuristics (US national rule-of-thumb). Get contractor quotes + a written scope before underwriting a rehab budget.
Schools (NCES district)
- District
- Plainfield School District
- NCES district ID
- 0903270
- Math proficiency
- 24% ▼ -16.00%
- Reading proficiency
- 41% ▼ -17.00%
- Median HH income
- $62,056
- Composite
- 29.36/100
- National rank
- #6531
- State rank
- #117 of 153 in CT
Livability — Plainfield
No livability data for this city. (Only ~50 U.S. cities are tracked.)
Census & demographics
- Census place
- Moosup, CT
- Population (ZIP)
- 5,840
Population outlook (Northeastern Connecticut County) Hauer SSP2
- By 2040
- 104,160
Race, ethnicity, and origin ACS 2023
- Neighborhood character
- Predominantly White (85%)
- Race & ethnicity
- White 85% Asian 6% Hispanic / Latino 5% Two or more races 4% Black 1%
- Common ancestry
- Lithuanian 18% Romanian 10% Italian 2%
- Foreign-born
- 7% · Canada, China
- Languages at home
- 93% English-only · Other Indo-European 3% Spanish 2% Chinese 1%
Political lean MEDSL · Northeastern Connecticut
- 2024 margin
- R (+15.4) · D 41.5% · R 57.0% · Other 1.5%
- All cycles
- 2024: R+15.4
Not yet ingested
- Civics
- —
Market trends
- HPI YoY
- ▲ 9.19%
- Current HPI
- 318.3935
- Rent YoY
- —
- Metro
- —
- State GDP YoY
- ▲ 1.06%
- F500 in state
- 38
Industry mix (Fortune 500 HQ in CT)
| Industry | F500 HQs | Revenue |
|---|---|---|
| Industrial Machinery | 4 | $38B |
|
||
| Insurance | 3 | $71B |
|
||
| Financial Services | 2 | $25B |
|
||
| Transportation / Logistics | 2 | $18B |
|
||
| Healthcare | 1 | $247B |
|
||
| Telecommunications | 1 | $55B |
|
||
Price history
1 event — show timeline
- 2026-06-18 Coming Soon $329,900 Smart MLS
Cash-flow waterfall
monthlySold comps — $/sqft
last 12 mo · ≤1 miLoading sold comps…