114 Ozone Rd · Livingston, TN
Flood risk 1/10 · Minimal
- FEMA flood zone
- X (unshaded)
- Chance of flooding over 30 yrs
- 0.0%
- Est. flood insurance / yr
- $507 – $1,088
Fire risk 5/10 · Moderate
- Est. fire insurance / yr
- $949 – $1,763
Heat risk 4/10 · Minor
- Hot days now (above 103°F)
- 7 days/yr
- Hot days in 30 yrs
- 20 days/yr
Wind risk 3/10 · Minor
- Chance of severe wind over 30 yrs
- 7.0%
Air-quality risk 2/10 · Minimal
- Unhealthy air days now
- 0 days/yr
- Unhealthy air days in 30 yrs
- 2 days/yr
Risk factors via First Street. Map © Google.
Why this score? — see what drove the D- grade
The composite is a weighted blend of 9 inputs, each scored 0–100. Each bar is that input's sub-score; the figure is the points it added to the 100-point composite (weight × sub-score).
- ARV discount +15.0/15.0
- Appreciation +9.2/10.0
- Cash flow +4.5/30.0
- Livability +3.4/5.0
- Rent growth +2.5/5.0
- Condition / age +2.5/5.0
- Schools +2.3/10.0
- 1% rule +0.5/10.0
- DSCR +0.0/10.0
$198,500
🖨 Deal sheet 📄 Offer letter ✓ Due diligence
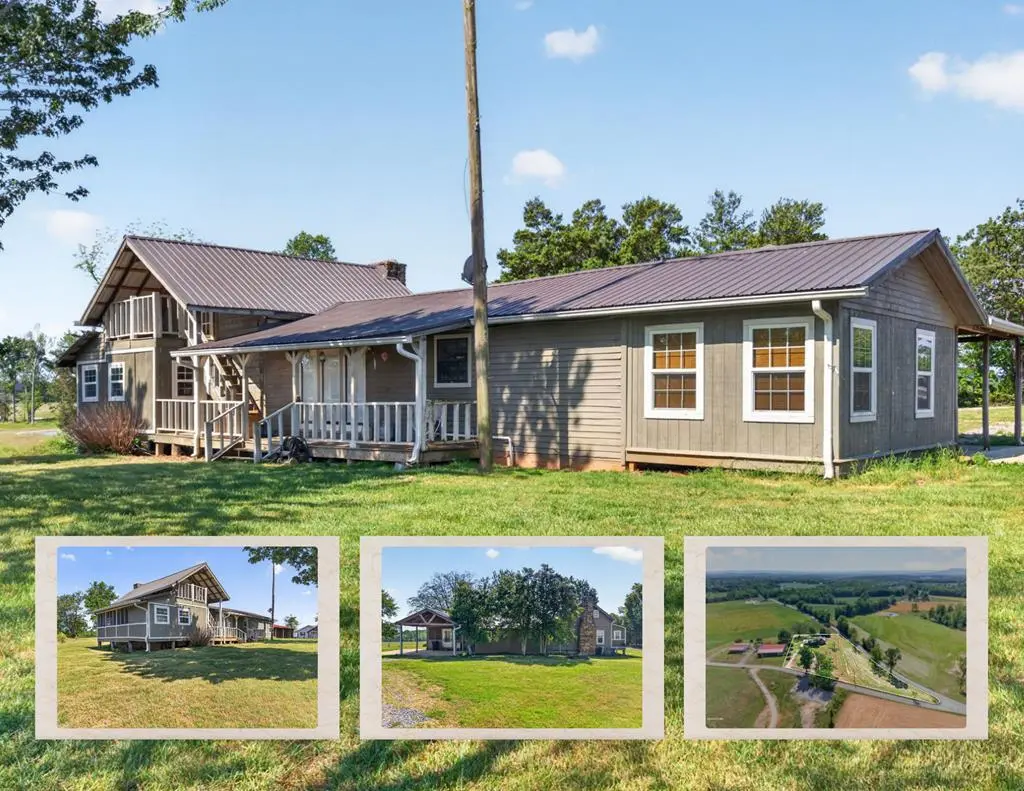
Listing remarks
Nestled in the rolling hills of Tennessee, this historic cabin blends rustic charm with modern updates and scenic views. Originally built in the 1800s with authentic yellow poplar logs, it was expanded in 1988 and thoughtfully updated in 2023. Roof is only 3 years old. Subfloor and joists have been replaced with pressure treated lumber/advantec. HVAC is electric and propane. Features include brand-new LVP flooring, original log construction, and a spacious frame addition for added comfort and function. Land is unrestricted and suitable for your favorite critters and farm animals. Nice spot for a garden, with blackberry and blueberry bushes and bonus. Small 12x20 outbuilding. Ideal for lake
Key facts
- Historic cabin
- Unrestricted land
- 12x20 outbuilding
Tags
Neighborhood map
What this means for you Summary
Snapshot
- This is a 2-bed/1.0-bath single-family listed at $198k.
Deal economics
- At list price, monthly cash flow is $-513 ($-6k/yr) — negative.
- To cash-flow at today's rent, offer at most $124k (37.4% below list).
- To meet the 1% rule (rent ≥ 1% of price), the offer needs to be $109k (45.2% below list).
- Recommended offer: $109k (45.2% below list) — sets the bar for 1% rule.
Location & tenants
- Location reads 68/100 on livability (#89 in TN) — a middle-class / working-renter tenant base. Strengths: cost of living A+, health & safety A+, housing A-; Watch: schools F, amenities F, commute F.
- Overton County (rural): math 27% / reading 30% proficiency, ranked #70 of 139 in TN (top 50%) — low school quality limits family demand, transient renter base, plan for 1-2y turnover.
- Market conditions: 32 active listings in the ZIP; 17 units permitted in Overton County in 2024 (0 in 5+ unit buildings).
Forward outlook
- In year one you build about $18k of equity ($1k loan paydown + $17k appreciation (8.4% local appreciation)).
- Overton County population projected to shrink 10% by 2050 — rents likely to lag national; underwrite the cash flow, not the appreciation.
- By year 3, paydown + projected appreciation supports a ~$45k cash-out refi (75% LTV) — recoverable capital for the next deal without selling this one.
Negotiation context
- It's been on market 56 days — a 3% lower offer ($193k) is reasonable based on typical stale-listing flexibility.
- 2 sale attempts with the ask held roughly flat each time — persistent listings suggest the price (not the market) is what's stuck; bring a comps-based counter.
Risks & watch-outs
- Climate carrying-cost: moderate wildfire risk — expect insurance premiums to compound above CPI over the hold.
Questions for the listing agent
- What do current leases actually rent for vs. the listed asking? Can we see a recent rent roll and the last 12 months of T-12 income?
- It's been on market 56 days. Have you received any prior offers? Is the seller open to a 45% concession, seller financing, or rate buy-down credit?
- Is there a deadline driving the sale (1031 exchange, divorce, estate, relocation)? That informs how much negotiation room exists.
- Schools are F-rated, which usually means shorter tenancies and higher turnover. Who's the typical renter profile here, and what's been the actual vacancy rate?
- The area grade is low — what's the realistic commute time and amenity access for the typical tenant pool here? Any planned neighborhood developments (good or bad) we should know about?
- What's the average days-on-market for RENTAL listings here right now (not sales)? A rising rental-DOM trend means longer vacancies and softer asking-rent achievability than the comps imply.
- What's the recent tenant-quality profile in this submarket — average credit score on applications, eviction rate, late-payment / NSF rate, and stable-employment percentage? A property-management company in the area should have these aggregated.
- How much new for-sale + rental construction is in the pipeline within 1–3 miles? Heavy new supply typically softens prices + rents 12–24 months out; constrained supply supports both.
Investment metrics
- 1% rule
- 0.55% ✗
- Cap rate
- 3.19%
- Cash-on-cash
- -11.08%
- DSCR
- 0.51
- GRM
- 15.2
CMA / ARV
- ARV (median comp)
- $288,401
- List price
- $198,500
- Delta
- -31.17%
- Verdict
- UNDERPRICED
- Comps
- 6 within 1.0 mi
Show comp detail 1 sale within ~0.75 mi
| Address | Dist | Beds/Ba | Sqft | Sold | Price | $/sf | Match |
|---|---|---|---|---|---|---|---|
| 1918 Willow Grove Hwy | 0.41mi | 3/2.0 (+1) | 1,500 (+1%) | 8mo | $325,500 | $217 | 63 |
Match score weights: distance 35% · size 25% · config 20% · recency 20%. Top-matched comps best support the ARV.
Projected returns pro-forma
8.36% appreciation · 3.0% rent growth · sell at horizon
- IRR
- 12.6%
- Equity multiple
- 1.97×
- Total profit
- $53,658
- Equity at exit
- $155,654
- IRR
- 13.0%
- Equity multiple
- 4.24×
- Total profit
- $180,277
- Equity at exit
- $313,713
Cash invested: $55,580 (down + closing). Projections, not guarantees.
Landlord ↔ Tenant lean methodology
- Overall (STATE)
- 87 Strongly Landlord-Friendly
- State Tennessee
- 87 Strongly Landlord-Friendly · R+13
- County
- — inherits STATE
- City
- — inherits STATE
ZIP-level market 38573
- Home prices YoY
- 2.8%
- Active inventory
- 32
- Price-to-rent
- 15.2×
Monthly cashflow live
- Estimated rent
- $1,087 medium interval (Pro) →
- Mortgage (P&I)
- −$1,041
- Tax est. 1.5%
- −$248 /mo · $2,978/yr
- Insurance
- −$83
- HOA
- −$0
- Vacancy / Maint / Mgmt
- −$228
- Net cashflow
- $-513
Break-even live
UW: 25.0% down · 7.5% · 30yr · 1.5% tax · 5.0% vac · 8.0% maint · 8.0% mgmt
Financing live
Cash to close
- Down payment
- $49,625
- Closing costs
- $5,955
- Reserves months
- —
- Total cash needed
- —
Loan-product check · same deal, 3 products live
Conventional
25% down · 7.5% · 30yr
- Down + closing
- —
- Monthly P&I
- —
- Monthly cashflow
- —
- DSCR
- —
- Eligible?
- —
Personal DTI + credit; lowest rate.
DSCR
20% down · 8.5% · 30yr
- Down + closing
- —
- Monthly P&I
- —
- Monthly cashflow
- —
- DSCR
- —
- Eligible?
- —
No personal income docs; deal must DSCR.
Hard money
10% down · 12.0% · 12mo
- Down + closing
- —
- Monthly P&I
- —
- Monthly cashflow
- —
- DSCR
- —
- Eligible?
- —
Short-term bridge; refi at stabilization.
Listing history 18 events
-
2026-06-19days on market $198,500 Active 56 DOM
-
2026-06-18days on market $198,500 Active 55 DOM
-
2026-06-17days on market $198,500 Active 54 DOM
-
2026-06-16days on market $198,500 Active 53 DOM
-
2026-06-15days on market $198,500 Active 52 DOM
-
2026-06-14days on market $198,500 Active 50 DOM
-
2026-06-13days on market $198,500 Active 49 DOM
-
2026-06-10days on market $198,500 Active 47 DOM
-
2026-06-09days on market $198,500 Active 46 DOM
-
2026-06-08days on market $198,500 Active 45 DOM
-
2026-06-07days on market $198,500 Active 44 DOM
-
2026-06-02days on market $198,500 Active 39 DOM
-
2026-06-01days on market $198,500 Active 38 DOM
-
2026-05-31days on market $198,500 Active 37 DOM
-
2026-05-30days on market $198,500 Active 36 DOM
-
2026-04-30historical
-
2026-04-24$198,500 Active 859-char remark
-
2025-11-21$224,900 Active
ⓘ Source: listings_history table (triggers on properties + properties_extension) + one-shot
backfill from property_details.listing_events for pre-trigger history.
Climate risk First Street
- Flood 1/10 Low FEMA zone X (unshaded) · 0% chance over 30 yrs
- Wildfire 5/10 Major
- Heat 4/10 Moderate 7 d/yr ≥103°F today · 20 d/yr by 30 yrs out
- Wind 3/10 Moderate 7% chance of damaging wind over 30 yrs
- Air quality 2/10 Low 0 unhealthy d/yr today · 2 by 30 yrs out
Nearby sold comps map
Loading sold comps map…
Walkable amenities ~0.75 mi
Loading nearby amenities…
Taxation est. · year 1
- Rental income
- $13,042
- − Mortgage interest
- −$11,119
- − Property taxes
- −$2,978
- − Insurance
- −$992
- − Repairs & maintenance
- −$1,043
- − Management
- −$1,043
- − Depreciation
- −$5,775
- Taxable loss
- −$9,909
- Est. tax savings @ 24.0%
- +$2,378
- After-tax cash flow
- $-3,780/yr
For passive investors: Depreciation is non-cash, so a rental often shows a tax loss while cash-flowing — sheltering income. Rental losses are passive: they offset passive income freely, and up to $25,000/yr can offset ordinary (W-2) income if you actively participate and your MAGI is under $100k (phasing out to $0 by $150k); unused losses carry forward. On sale, claimed depreciation is recaptured at up to 25%, and gains may owe capital-gains tax (a 1031 exchange can defer both). Figures are a year-1 estimate at your 24.0% rate — not tax advice; consult a CPA.
Schools (NCES district)
- District
- Overton County
- NCES district ID
- 4703330
- Math proficiency
- 27% ▼ -12.00%
- Reading proficiency
- 30% ▼ -2.00%
- Median HH income
- $34,479
- Composite
- 23.47/100
- National rank
- #7879
- State rank
- #70 of 139 in TN
Livability — Livingston
- Score
- 68/100
- State rank
- #89
- US rank
- #9562
Category grades
Schools grade is shown separately in the Schools card above.
Census & demographics
- City population
- 10,020
- Population (ZIP)
- 2,006
Population outlook (Overton County) Hauer SSP2
- Today (2025)
- 21,942 people
- By 2030
- 21,633 · -1.4%
- By 2040
- 20,812 · -5.1%
- By 2050
- 19,770 · -9.9%
- By 2075
- 17,125 · -22.0%
- By 2100
- 13,695 · -37.6%
Race, ethnicity, and origin ACS 2023
- Neighborhood character
- Predominantly White (96%)
- Race & ethnicity
- White 96% Hispanic / Latino 4% Two or more races 1%
- Common ancestry
- Slovak 2% Portuguese 2%
- Languages at home
- 97% English-only · German/W. Germanic 3% Spanish 1%
Political lean MEDSL · Overton
- 2024 margin
- Solid R (+64.2) · D 17.4% · R 81.7%
- 2008→2024 swing
- -50.9pp toward R · 2008: -13.3pp · 2024: -64.2pp
- All cycles
- 2024: R+64.2 2020: R+58.6 2016: R+50.2 2012: R+25.7 2008: R+13.3
Not yet ingested
- Civics
- —
Market trends
- HPI YoY
- ▲ 8.36%
- Current HPI
- 306.243
- Rent YoY
- —
- Metro
- —
- State GDP YoY
- ▲ 2.78%
- F500 in state
- 22
Industry mix (Fortune 500 HQ in TN)
| Industry | F500 HQs | Revenue |
|---|---|---|
| Healthcare | 3 | $91B |
|
||
| Retail | 3 | $72B |
|
||
| Transportation / Logistics | 1 | $88B |
|
||
| Paper / Packaging | 1 | $19B |
|
||
| Insurance | 1 | $13B |
|
||
| Energy | 1 | $12B |
|
||
Price history
-11.7% since first listed3 events — show timeline
- 2026-04-30 Listing Removed — REALTRACS as Distributed by MLS Grid
- 2026-04-24 Listed $198,500 UCMLS
- 2025-11-21 Listed $224,900 REALTRACS as Distributed by MLS Grid
Cash-flow waterfall
monthlySold comps — $/sqft
last 12 mo · ≤1 miLoading sold comps…