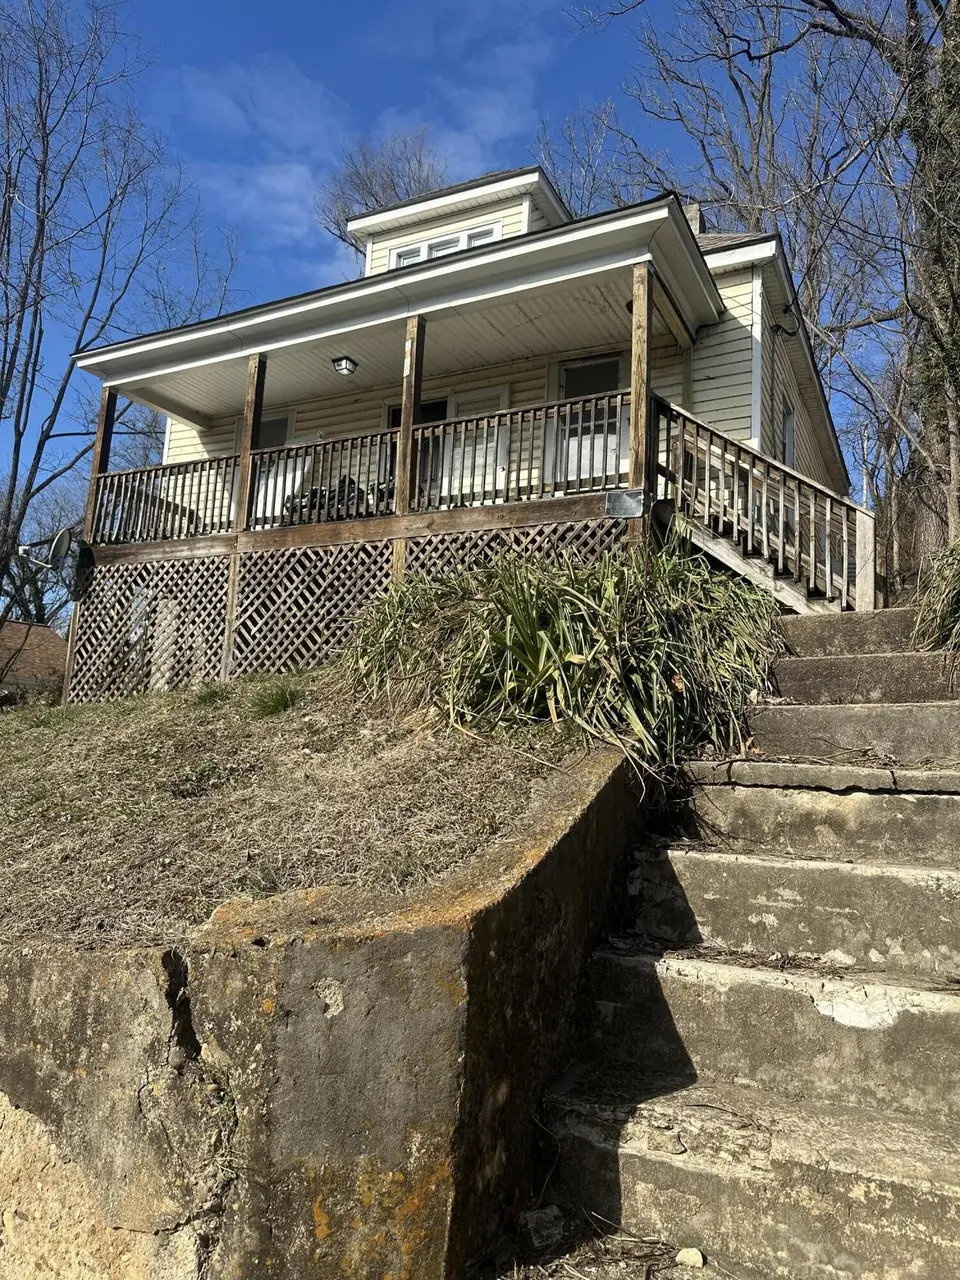
1320 Tazewell Ave SE · Roanoke, VA
Flood risk 1/10 · Minimal
- FEMA flood zone
- X (unshaded)
- Chance of flooding over 30 yrs
- 0.0%
- Est. flood insurance / yr
- $473 – $860
Fire risk 1/10 · Minimal
- Est. fire insurance / yr
- $666 – $1,236
Heat risk 5/10 · Moderate
- Hot days now (above 102°F)
- 7 days/yr
- Hot days in 30 yrs
- 18 days/yr
Wind risk 2/10 · Minimal
- Chance of severe wind over 30 yrs
- 1.0%
Air-quality risk 2/10 · Minimal
- Unhealthy air days now
- 1 days/yr
- Unhealthy air days in 30 yrs
- 1 days/yr
Risk factors via First Street. Map © Google.
Why this score? — see what drove the C grade
The composite is a weighted blend of 9 inputs, each scored 0–100. Each bar is that input's sub-score; the figure is the points it added to the 100-point composite (weight × sub-score).
- Cash flow +21.9/30.0
- ARV discount +7.1/15.0
- DSCR +7.0/10.0
- 1% rule +5.2/10.0
- Appreciation +5.0/10.0
- Schools +4.1/10.0
- Livability +3.7/5.0
- Rent growth +2.5/5.0
- Condition / age +2.5/5.0
$115,968
🖨 Deal sheet 📄 Offer letter ✓ Due diligence
Listing remarks MLS
Vacant
Key facts
- 5,227 sq ft lot
- Built 1906
- Listed 253 days
Neighborhood map
What this means for you Summary
Snapshot
- This is a 3-bed/1.0-bath single-family listed at $116k.
Deal economics
- At list price, monthly cash flow is $184 ($2k/yr) — positive.
- The deal already cash-flows at list — no discount required.
- Meets the 1% rule at list price ($1k rent vs $116k).
- Recommended offer: $102k (12.0% below list) — sets the bar for market timing.
- Cap rate 8.2% vs local median 4.2% in Roanoke — top-decile yield for the area; either an underpriced asset or a hidden risk that comps aren't pricing in. Stress-test before assuming the spread holds.
Location & tenants
- Location reads 73/100 on livability (#163 in VA) — a middle-class / working-renter tenant base. Strengths: cost of living A+, health & safety A+, housing A; Watch: amenities C-, employment D, crime F.
- Roanoke City Public School District (urban): math 40% / reading 58% proficiency, ranked #102 of 131 in VA (top 78%) — families likely to look elsewhere, expect single-tenant / working-renter base with shorter leases; 67% free/reduced lunch — lower-income household profile, screen leases tightly.
- Market conditions: 12 active listings in the ZIP; 27 comparable units currently listed for rent nearby; rentals at typical pace (median 21d on market — plan ~3-4 weeks tenant-placement turnaround); 41% of comp listings sitting > 30 days — soft ceiling on asking rent; 113 units permitted in Roanoke city in 2024 (0 in 5+ unit buildings).
Forward outlook
- In year one you build about $4k of equity ($802 loan paydown + $3k appreciation (3.0% local appreciation)).
- Roanoke County population projected at +11% by 2050 — modest demand growth; plan on rents tracking national, not racing it.
- At projected returns (3.0% appreciation + 3.0% rent growth), your $32k cash investment doubles in ~5 years — after that, you're playing with house money.
- By year 8, paydown + projected appreciation supports a ~$32k cash-out refi (75% LTV) — recoverable capital for the next deal without selling this one.
Negotiation context
- It's been on market 253 days — a 12% lower offer ($102k) is reasonable based on typical stale-listing flexibility.
- 2 sale attempts since 3y ago with the ask held roughly flat each time — persistent listings suggest the price (not the market) is what's stuck; bring a comps-based counter.
Risks & watch-outs
- Watch-outs: built in 1906 — expect roof / HVAC / electrical / plumbing capex.
- Climate carrying-cost: extreme-heat days projected 7→18/yr by 2055 (HVAC capex compounding) — expect insurance premiums to compound above CPI over the hold.
Questions for the listing agent
- It's been on market 253 days. Have you received any prior offers? Is the seller open to a 12% concession, seller financing, or rate buy-down credit?
- Built in 1906 — when were the roof, HVAC, electrical panel, plumbing, and water heater last replaced?
- Why hasn't it sold? Are there any deal-killer items the seller is aware of (foundation, flood, title, zoning, code violations)?
- Is there a deadline driving the sale (1031 exchange, divorce, estate, relocation)? That informs how much negotiation room exists.
- Schools are A-rated — typically a magnet for longer-tenancy family renters. What's the average tenant stay here, and is there a school-zone premium baked into asking?
- Crime grade is F in this area — have there been break-ins, vandalism, or insurance claims at this property in the last 3 years? What carrier currently insures it and at what premium?
- What's the average days-on-market for RENTAL listings here right now (not sales)? A rising rental-DOM trend means longer vacancies and softer asking-rent achievability than the comps imply.
- What's the recent tenant-quality profile in this submarket — average credit score on applications, eviction rate, late-payment / NSF rate, and stable-employment percentage? A property-management company in the area should have these aggregated.
- How much new for-sale + rental construction is in the pipeline within 1–3 miles? Heavy new supply typically softens prices + rents 12–24 months out; constrained supply supports both.
Investment metrics
- 1% rule
- 1.02% ✓
- Cap rate
- 8.19%
- Cash-on-cash
- 6.78%
- DSCR
- 1.30
- GRM
- 8.2
CMA / ARV
- ARV (median comp)
- $114,971
- List price
- $115,968
- Delta
- 0.87%
- Verdict
- FAIR
- Comps
- 20 within 1.0 mi
Show comp detail 12 sales within ~0.75 mi
| Address | Dist | Beds/Ba | Sqft | Sold | Price | $/sf | Match |
|---|---|---|---|---|---|---|---|
| 119 16th St SE | 0.18mi | 3/1.0 | 956 (-3%) | 1mo | $105,000 | $110 | 86 |
| 120 10 1/2 St SE | 0.28mi | 3/1.0 | 939 (-5%) | 5mo | $123,500 | $132 | 75 |
| 1144 Tompkins Ave SE | 0.54mi | 3/1.0 | 1,043 (+6%) | 2mo | $95,000 | $91 | 63 |
| 1330 13 1/2 St SE | 0.54mi | 3/1.5 | 1,024 (+4%) | 5mo | $162,500 | $159 | 62 |
| 1213 Tazewell Ave SE | 0.11mi | 4/1.0 (+1) | 1,100 (+12%) | 10mo | $93,500 | $85 | 62 |
| 1014 Jamison Ave SE | 0.36mi | 2/1.0 (-1) | 1,070 (+9%) | 3mo | $45,000 | $42 | 61 |
| 1318 Dale Ave SE | 0.12mi | 2/1.0 (-1) | 856 (-13%) | 8mo | $70,000 | $82 | 60 |
| 1207 Tompkins Ave SE | 0.56mi | 3/1.0 | 1,008 (+2%) | 12mo | $185,395 | $184 | 60 |
| 1241 Dale Ave SE | 0.16mi | 2/1.0 (-1) | 844 (-14%) | 8mo | $102,000 | $121 | 57 |
| 1507 Gladstone Ave SE | 0.56mi | 2/1.0 (-1) | 918 (-7%) | 3mo | $149,000 | $162 | 55 |
| 1919 Clinton Ave SE | 0.66mi | 2/1.0 (-1) | 1,020 (+4%) | 11mo | $80,000 | $78 | 49 |
| 1465 Greenbrier Ave SE | 0.36mi | 2/1.0 (-1) | 857 (-13%) | 10mo | $153,333 | $179 | 48 |
Match score weights: distance 35% · size 25% · config 20% · recency 20%. Top-matched comps best support the ARV.
Projected returns pro-forma
3.0% appreciation · 3.0% rent growth · sell at horizon
- IRR
- 13.8%
- Equity multiple
- 1.79×
- Total profit
- $25,644
- Equity at exit
- $52,144
- IRR
- 15.7%
- Equity multiple
- 3.31×
- Total profit
- $74,906
- Equity at exit
- $80,360
Cash invested: $32,471 (down + closing). Projections, not guarantees.
Landlord ↔ Tenant lean methodology
- Overall (STATE)
- 55 Moderately Landlord-Leaning
- State Virginia
- 55 Moderately Landlord-Leaning · D+2
- County
- — inherits STATE
- City
- — inherits STATE
ZIP-level market 24011
- Active inventory
- 12
- Price-to-rent
- 8.2×
Monthly cashflow live
- Estimated rent
- $1,179 high interval (Pro) →
- Mortgage (P&I)
- −$608
- Tax from tax record
- −$92 /mo · $1,100/yr
- Insurance
- −$48
- HOA
- −$0
- Vacancy / Maint / Mgmt
- −$248
- Net cashflow
- $184
Break-even live
UW: 25.0% down · 7.5% · 30yr · 1.5% tax · 5.0% vac · 8.0% maint · 8.0% mgmt
Financing live
Cash to close
- Down payment
- $28,992
- Closing costs
- $3,479
- Reserves months
- —
- Total cash needed
- —
Loan-product check · same deal, 3 products live
Conventional
25% down · 7.5% · 30yr
- Down + closing
- —
- Monthly P&I
- —
- Monthly cashflow
- —
- DSCR
- —
- Eligible?
- —
Personal DTI + credit; lowest rate.
DSCR
20% down · 8.5% · 30yr
- Down + closing
- —
- Monthly P&I
- —
- Monthly cashflow
- —
- DSCR
- —
- Eligible?
- —
No personal income docs; deal must DSCR.
Hard money
10% down · 12.0% · 12mo
- Down + closing
- —
- Monthly P&I
- —
- Monthly cashflow
- —
- DSCR
- —
- Eligible?
- —
Short-term bridge; refi at stabilization.
Rent comps 27 comps
| Address | Beds | Baths | Sqft | Rent | $/sqft | DOM | Units | Dist |
|---|---|---|---|---|---|---|---|---|
| 1605 Church Ave SE Roanoke, VA | 2.0 | 1.0 | 776 | $1,200 | $1.55 | 13d | 1 | 0.10mi |
| 922 12th St SE Unit A Roanoke, VA | 2.0 | 1.0 | 800 | $899 | $1.12 | 43d | 1 | 0.31mi |
| 1905 Wise Ave SE Roanoke, VA | 2.0 | 1.0 | 1044 | $1,123 | $1.08 | 13d | 1 | 0.36mi |
| 1016 15th St SE #2 Roanoke, VA | 3.0 | 1.5 | 1084 | $995 | $0.92 | 13d | 1 | 0.36mi |
| 1015 12th St SE Roanoke, VA | 3.0 | 1.0 | 1072 | $923 | $0.86 | 43d | 1 | 0.36mi |
| 1513 Morningside St SE Roanoke, VA | 2.0 | 1.0 | 900 | $1,200 | $1.33 | 13d | 1 | 0.79mi |
| 1708 Baldwin Ave NE Unit A Roanoke, VA | 2.0 | 1.5 | 952 | $1,550 | $1.63 | 43d | 1 | 0.86mi |
| 220 8th St Vinton, VA | 2.0 | 1.0 | 850 | $1,199 | $1.41 | 13d | 1 | 0.87mi |
| 601 Highland Ave SE Apt B Roanoke, VA | 2.0 | 1.0 | 617 | $975 | $1.58 | 21d | 1 | 0.92mi |
| 1423 Varnell Ave NE Roanoke, VA | 2.0 | 1.0 | 720 | $1,650 | $2.29 | 13d | 1 | 0.94mi |
| 339 Cedar Ave Vinton, VA | 2.0 | 1.0 | 830 | $1,200 | $1.45 | 43d | 1 | 0.97mi |
| 950 Morgan Ave SE Roanoke, VA | 2.0 | 2.0 | 869 | $1,550 | $1.78 | 43d | 1 | 1.02mi |
| 439 Cedar Bluff Ave SE Roanoke, VA | 2.0 | 1.0 | 716 | $2,350 | $3.28 | 13d | 1 | 1.06mi |
| 1824 Eastern Ave NE Roanoke, VA | 2.0 | 1.0 | 863 | $1,200 | $1.39 | 43d | 1 | 1.09mi |
| 1712 Wayne St NE Roanoke, VA | 2.0 | 1.0 | 826 | $1,250 | $1.51 | 21d | 1 | 1.13mi |
| 916 Kyle Ave NE Roanoke, VA | 2.0 | 1.0 | 642 | $2,250 | $3.50 | 13d | 1 | 1.16mi |
| 1515 Dunbar St NW Roanoke, VA | 3.0 | 2.0 | 1058 | $1,623 | $1.53 | 13d | 1 | 1.22mi |
| 1816 Bennington St SE Roanoke, VA | 2.0 | 1.5 | 938 | $1,023 | $1.09 | 21d | 1 | 1.25mi |
| 420 Riverland Rd SE Roanoke, VA | 2.0 | 1.0 | 834 | $975 | $1.17 | 21d | 1 | 1.29mi |
| 100 Highland Rd Vinton, VA | 1.0–2.0 | 1.0–2.0 | 665 | $1,195 | $1.80 | 13d | 1 | 1.31mi |
| 520 Riverland Rd SE Roanoke, VA | 2.0 | 1.0 | 948 | $1,500 | $1.58 | 43d | 1 | 1.31mi |
| 635 Riverland Rd SE Roanoke, VA | 2.0 | 1.0 | 905 | $1,250 | $1.38 | 13d | 1 | 1.36mi |
| 217 Mountain Ave SW Unit 217-2 Roanoke, VA | 2.0 | 1.0 | 700 | $945 | $1.35 | 43d | 1 | 1.36mi |
| 703 Riverland Rd SE Roanoke, VA | 2.0 | 1.0 | 1000 | $1,250 | $1.25 | 43d | 1 | 1.36mi |
| 401 Rutherford Ave NW Roanoke, VA | 3.0 | 1.0 | 1064 | $1,450 | $1.36 | 43d | 1 | 1.37mi |
| 317 Jefferson Ave Vinton, VA | 2.0 | 1.0 | 980 | $1,525 | $1.56 | 43d | 1 | 1.46mi |
| 416 Hanover Ave NW Roanoke, VA | 2.0 | 1.0 | 682 | $1,195 | $1.75 | 13d | 1 | 1.49mi |
Listing history 26 events
-
2026-06-18days on market $115,968 Active 253 DOM
-
2026-06-17days on market $115,968 Active 252 DOM
-
2026-06-16days on market $115,968 Active 251 DOM
-
2026-06-15days on market $115,968 Active 250 DOM
-
2026-06-14days on market $115,968 Active 248 DOM
-
2026-06-13days on market $115,968 Active 247 DOM
-
2026-06-10days on market $115,968 Active 245 DOM
-
2026-06-09days on market $115,968 Active 244 DOM
-
2026-06-08days on market $115,968 Active 243 DOM
-
2026-06-05days on market $115,968 Active 239 DOM
-
2026-06-03days on market $115,968 Active 238 DOM
-
2026-06-02days on market $115,968 Active 237 DOM
-
2026-06-01days on market $115,968 Active 236 DOM
-
2026-05-31days on market $115,968 Active 235 DOM
-
2026-05-30days on market $115,968 Active 234 DOM
-
2026-02-06price $115,968 6-char remark
Show marketing remark (6 chars)
Vacant
-
2026-01-05price $118,335 6-char remark
Show marketing remark (6 chars)
Vacant
-
2025-10-07$120,750 Active 6-char remark
Show marketing remark (6 chars)
Vacant
-
2023-12-13historical
-
2023-11-21price $128,562
-
2023-11-03price $135,329
-
2023-10-09price $142,452
-
2023-09-22$149,950 Active
-
2021-04-30soldstatus $240,000
-
2005-03-24soldstatus $24,500
-
1979-01-10soldstatus $4,000
ⓘ Source: listings_history table (triggers on properties + properties_extension) + one-shot
backfill from property_details.listing_events for pre-trigger history.
Tax reassessment forecast VA · Resets to sale price
- Current annual tax
- $1,100 · $92/mo
- Projected year-2 tax
- $1,100 · $92/mo
- Expected delta
- $0/yr ($0/mo · 0.0%)
ⓘ Screening estimate from a state-policy table — verify with the county assessor before closing.
Climate risk First Street
- Flood 1/10 Low FEMA zone X (unshaded) · 0% chance over 30 yrs
- Wildfire 1/10 Low
- Heat 5/10 Major 7 d/yr ≥102°F today · 18 d/yr by 30 yrs out
- Wind 2/10 Low 100% chance of damaging wind over 30 yrs
- Air quality 2/10 Low 1 unhealthy d/yr today · 1 by 30 yrs out
Nearby sold comps map
Loading sold comps map…
Walkable amenities ~0.75 mi
Loading nearby amenities…
Taxation est. · year 1
- Rental income
- $14,151
- − Mortgage interest
- −$6,496
- − Property taxes
- −$1,100
- − Insurance
- −$580
- − Repairs & maintenance
- −$1,132
- − Management
- −$1,132
- − Depreciation
- −$3,374
- Taxable income
- $338
- Est. tax owed @ 24.0%
- −$81
- After-tax cash flow
- $2,121/yr
For passive investors: Depreciation is non-cash, so a rental often shows a tax loss while cash-flowing — sheltering income. Rental losses are passive: they offset passive income freely, and up to $25,000/yr can offset ordinary (W-2) income if you actively participate and your MAGI is under $100k (phasing out to $0 by $150k); unused losses carry forward. On sale, claimed depreciation is recaptured at up to 25%, and gains may owe capital-gains tax (a 1031 exchange can defer both). Figures are a year-1 estimate at your 24.0% rate — not tax advice; consult a CPA.
Schools (NCES district)
- District
- Roanoke City Public School District
- NCES district ID
- 5103300
- Math proficiency
- 40% ▼ -38.00%
- Reading proficiency
- 58% ▼ -12.00%
- Median HH income
- $38,592
- Composite
- 40.8/100
- National rank
- #3639
- State rank
- #102 of 131 in VA
Livability — Roanoke
- Score
- 73/100
- State rank
- #163
- US rank
- #5055
Category grades
Schools grade is shown separately in the Schools card above.
Census & demographics
- Census place
- Roanoke, VA
- City population
- 168,930
- Population (ZIP)
- 789
Population outlook (Roanoke County) Hauer SSP2
- Today (2025)
- 106,094 people
- By 2030
- 108,927 · +2.7%
- By 2040
- 114,104 · +7.5%
- By 2050
- 118,032 · +11.3%
- By 2075
- 123,363 · +16.3%
- By 2100
- 116,827 · +10.1%
Race, ethnicity, and origin ACS 2023
- Neighborhood character
- Predominantly White (73%)
- Race & ethnicity
- White 73% Black 14% Two or more races 10% Hispanic / Latino 6% Asian 2%
- Hispanic origin (detail)
- Mexican 2% Puerto Rican 3%
- Common ancestry
- Romanian 5% Serbian 5% Iranian 2%
- Foreign-born
- 7% · China, South Korea
- Languages at home
- 91% English-only · Spanish 4% Russian/Polish/Slavic 2% Other Indo-European 2%
Political lean MEDSL · Roanoke
- 2024 margin
- Strong D (+23.6) · D 61.1% · R 37.5% · Other 1.4%
- 2008→2024 swing
- +0.2pp no change · 2008: 23.4pp · 2024: 23.6pp
- All cycles
- 2024: D+23.6 2020: D+25.8 2016: D+17.6 2012: D+21.5 2008: D+23.4
Not yet ingested
- Civics
- —
Market trends
- HPI YoY
- —
- Current HPI
- —
- Rent YoY
- —
- Metro
- —
- State GDP YoY
- ▲ 2.40%
- F500 in state
- 50
Industry mix (Fortune 500 HQ in VA)
| Industry | F500 HQs | Revenue |
|---|---|---|
| Aerospace / Defense | 4 | $236B |
|
||
| Technology / Defense | 3 | $32B |
|
||
| Financial Services | 2 | $176B |
|
||
| Utilities | 2 | $27B |
|
||
| Insurance | 2 | $25B |
|
||
| Technology | 2 | $15B |
|
||
Price history
+2799.2% since first listed11 events — show timeline
- 2026-02-06 Price Changed $115,968 MLSRV
- 2026-01-05 Price Changed $118,335 MLSRV
- 2025-10-07 Listed $120,750 MLSRV
- 2023-12-13 Listing Removed — MLSRV
- 2023-11-21 Price Changed $128,562 MLSRV
- 2023-11-03 Price Changed $135,329 MLSRV
- 2023-10-09 Price Changed $142,452 MLSRV
- 2023-09-22 Listed $149,950 MLSRV
- 2021-04-30 Sold (Public Records) $240,000 Public Records
- 2005-03-24 Sold (Public Records) $24,500 Public Records
- 1979-01-10 Sold (Public Records) $4,000 Public Records
Property tax history
+12.5%/yrLatest (2025): $1,100 · +15.5% YoY. Source: county tax records.
Cash-flow waterfall
monthlySold comps — $/sqft
last 12 mo · ≤1 miLoading sold comps…