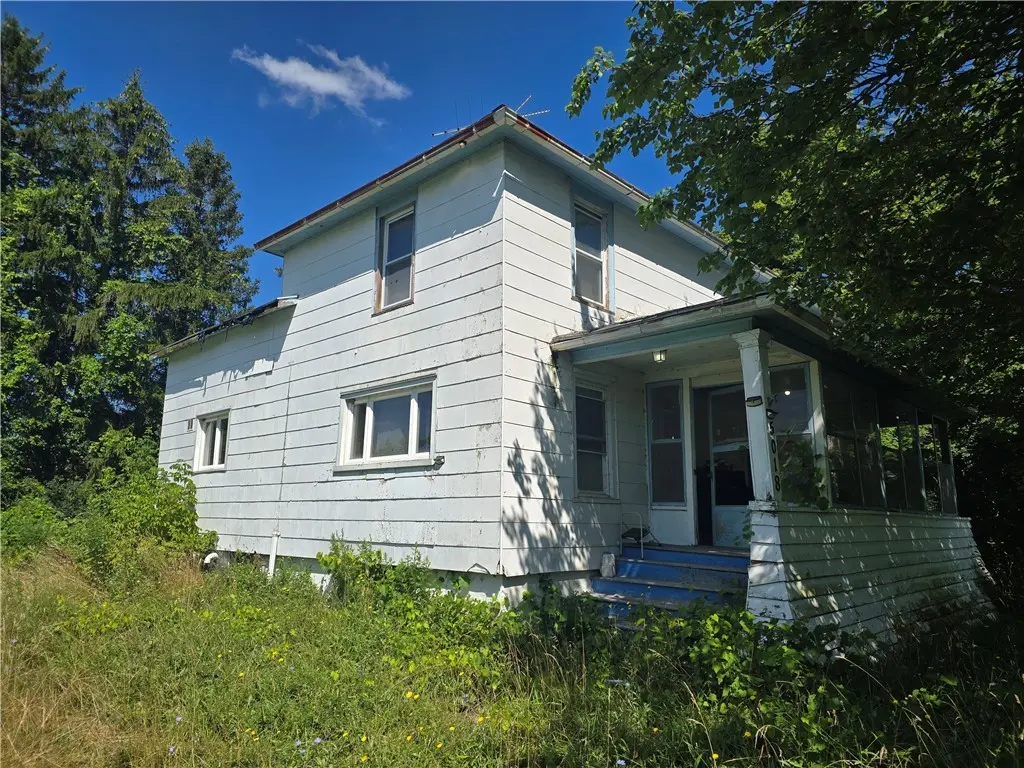
5018 State Route 96a · Romulus, NY
Flood risk 1/10 · Minimal
- FEMA flood zone
- X
- Chance of flooding over 30 yrs
- 0.0%
- Est. flood insurance / yr
- $473 – $860
Fire risk 2/10 · Minimal
- Est. fire insurance / yr
- $691 – $1,283
Heat risk 2/10 · Minimal
- Hot days now (above 95°F)
- 7 days/yr
- Hot days in 30 yrs
- 15 days/yr
Wind risk 1/10 · Minimal
- Chance of severe wind over 30 yrs
- 0.0%
Air-quality risk 2/10 · Minimal
- Unhealthy air days now
- 0 days/yr
- Unhealthy air days in 30 yrs
- 1 days/yr
Risk factors via First Street. Map © Google.
Why this score? — see what drove the B+ grade
The composite is a weighted blend of 9 inputs, each scored 0–100. Each bar is that input's sub-score; the figure is the points it added to the 100-point composite (weight × sub-score).
- Cash flow +30.0/30.0
- 1% rule +10.0/10.0
- DSCR +10.0/10.0
- Appreciation +10.0/10.0
- ARV discount +7.5/15.0
- Schools +4.2/10.0
- Livability +3.0/5.0
- Rent growth +2.5/5.0
- Condition / age +2.5/5.0
$69,900
🖨 Deal sheet (PDF) 📄 Offer letter ✓ Due diligence
Listing remarks MLS
This property offers an excellent opportunity for buyers looking to create value through renovation in the Finger Lakes region. The home is in need of updates and improvements, providing a blank canvas for those with vision and creativity. Set along a scenic and well-traveled route, the location offers convenient access to nearby lakes, wineries, and surrounding communities, adding to its long-term appeal. With the right improvements, this property has the potential to become a rewarding primary residence, second home, or investment property. Ideal for buyers seeking a remodeling project, this home is being sold as-is, allowing the next owner to customize it to their needs and goals.
Key facts
- 0.88 acre lot
- 2 garage spots
- Built 1850
Neighborhood map
What this means for you Summary
Snapshot
- This is a 4-bed/1.0-bath single-family listed at $70k.
Deal economics
- At list price, monthly cash flow is $1k ($12k/yr) — positive.
- The deal already cash-flows at list — no discount required.
- Meets the 1% rule at list price ($2k rent vs $70k).
- Recommended offer: $62k (12.0% below list) — sets the bar for market timing.
Location & tenants
- Location reads 60/100 on livability (#983 in NY) — a middle-class / working-renter tenant base. Strengths: cost of living A+, housing A+; Watch: schools D, health & safety D, crime F.
- Romulus Central School District (rural): math 46% / reading 45% proficiency, ranked #535 of 755 in NY (top 71%) — families likely to look elsewhere, expect single-tenant / working-renter base with shorter leases.
- Market conditions: 15 active listings in the ZIP; 48 units permitted in Seneca County in 2024 (0 in 5+ unit buildings).
Forward outlook
- In year one you build about $7k of equity ($483 loan paydown + $7k appreciation (10.0% local appreciation)).
- Seneca County population projected at -14% by 2050 — secular population decline; favor cash flow + early exit over multi-decade hold.
- At projected returns (10.0% appreciation + 3.0% rent growth), your $20k cash investment doubles in ~1 year — after that, you're playing with house money.
- By year 5, paydown + projected appreciation supports a ~$35k cash-out refi (75% LTV) — recoverable capital for the next deal without selling this one.
Negotiation context
- It's been on market 131 days — a 12% lower offer ($62k) is reasonable based on typical stale-listing flexibility.
- 2 sale attempts with the ask held roughly flat each time — persistent listings suggest the price (not the market) is what's stuck; bring a comps-based counter.
- Current owner paid $48k; 46% above their basis — modest negotiation headroom, anchor on the comps not their cost.
Risks & watch-outs
- Watch-outs: property tax is 3.6% of price; built in 1850 — expect roof / HVAC / electrical / plumbing capex.
Questions for the listing agent
- It's been on market 131 days. Have you received any prior offers? Is the seller open to a 12% concession, seller financing, or rate buy-down credit?
- Built in 1850 — when were the roof, HVAC, electrical panel, plumbing, and water heater last replaced?
- Property tax is high relative to price — has the assessment been appealed recently, and will the sale trigger a re-assessment?
- Why hasn't it sold? Are there any deal-killer items the seller is aware of (foundation, flood, title, zoning, code violations)?
- Is there a deadline driving the sale (1031 exchange, divorce, estate, relocation)? That informs how much negotiation room exists.
- Schools are D-rated, which usually means shorter tenancies and higher turnover. Who's the typical renter profile here, and what's been the actual vacancy rate?
- Crime grade is F in this area — have there been break-ins, vandalism, or insurance claims at this property in the last 3 years? What carrier currently insures it and at what premium?
- What's the average days-on-market for RENTAL listings here right now (not sales)? A rising rental-DOM trend means longer vacancies and softer asking-rent achievability than the comps imply.
- What's the recent tenant-quality profile in this submarket — average credit score on applications, eviction rate, late-payment / NSF rate, and stable-employment percentage? A property-management company in the area should have these aggregated.
- How much new for-sale + rental construction is in the pipeline within 1–3 miles? Heavy new supply typically softens prices + rents 12–24 months out; constrained supply supports both.
Investment metrics
- 1% rule
- 2.92% ✓
- Cap rate
- 23.63%
- Cash-on-cash
- 61.91%
- DSCR
- 3.75
- GRM
- 2.9
CMA / ARV
- ARV (median comp)
- $292,354
- List price
- $69,900
- Delta
- -76.09%
- Verdict
- UNDERPRICED
- Comps
- 3 within 1.0 mi
Projected returns pro-forma
10.0% appreciation · 3.0% rent growth · sell at horizon
- IRR
- 73.9%
- Equity multiple
- 6.24×
- Total profit
- $102,491
- Equity at exit
- $62,971
- IRR
- 67.8%
- Equity multiple
- 13.85×
- Total profit
- $251,452
- Equity at exit
- $135,800
Cash invested: $19,572 (down + closing). Projections, not guarantees.
Landlord ↔ Tenant lean methodology
- Overall (STATE)
- 15 Strongly Tenant-Friendly
- State New York
- 15 Strongly Tenant-Friendly · D+10
- County
- — inherits STATE
- City
- — inherits STATE
ZIP-level market 14541
- Home prices YoY
- 3.3%
- Active inventory
- 15
- Price-to-rent
- 2.9×
Monthly cashflow live
- Estimated rent
- $2,044 medium interval (Pro) →
- Mortgage (P&I)
- −$367
- Tax from tax record
- −$209 /mo · $2,509/yr
- Insurance
- −$29
- HOA
- −$0
- Vacancy / Maint / Mgmt
- −$429
- Net cashflow
- $1,010
Break-even live
Sensitivity live
| Price | -10% $1,049 | -5% $1,030 | +0% $1,010 | +5% $990 | +10% $970 |
|---|---|---|---|---|---|
| Rent | -10% $848 | -5% $929 | +0% $1,010 | +5% $1,091 | +10% $1,171 |
| Rate | -1.0pp $1,045 | -0.5pp $1,028 | base $1,010 | +0.5pp $992 | +1.0pp $973 |
UW: 25.0% down · 7.5% · 30yr · 1.5% tax · 5.0% vac · 8.0% maint · 8.0% mgmt
Financing live
Cash to close
- Down payment
- $17,475
- Closing costs
- $2,097
- Reserves months
- —
- Total cash needed
- —
Loan-product check · same deal, 3 products live
Conventional
25% down · 7.5% · 30yr
- Down + closing
- —
- Monthly P&I
- —
- Monthly cashflow
- —
- DSCR
- —
- Eligible?
- —
Personal DTI + credit; lowest rate.
DSCR
20% down · 8.5% · 30yr
- Down + closing
- —
- Monthly P&I
- —
- Monthly cashflow
- —
- DSCR
- —
- Eligible?
- —
No personal income docs; deal must DSCR.
Hard money
10% down · 12.0% · 12mo
- Down + closing
- —
- Monthly P&I
- —
- Monthly cashflow
- —
- DSCR
- —
- Eligible?
- —
Short-term bridge; refi at stabilization.
Listing history 19 events
-
2026-06-21days on market $69,900 Active 131 DOM
-
2026-06-18days on market $69,900 Active 129 DOM
-
2026-06-17days on market $69,900 Active 128 DOM
-
2026-06-16days on market $69,900 Active 127 DOM
-
2026-06-15days on market $69,900 Active 126 DOM
-
2026-06-13days on market $69,900 Active 124 DOM
-
2026-06-12days on market $69,900 Active 123 DOM
-
2026-06-09days on market $69,900 Active 120 DOM
-
2026-06-08days on market $69,900 Active 119 DOM
-
2026-06-07days on market $69,900 Active 118 DOM
-
2026-06-05days on market $69,900 Active 116 DOM
-
2026-06-04days on market $69,900 Active 114 DOM
-
2026-06-02days on market $69,900 Active 113 DOM
-
2026-06-01days on market $69,900 Active 112 DOM
-
2026-05-31days on market $69,900 Active 111 DOM
-
2026-02-09$69,900 Active 692-char remark
Show marketing remark (692 chars)
This property offers an excellent opportunity for buyers looking to create value through renovation in the Finger Lakes region. The home is in need of updates and improvements, providing a blank canvas for those with vision and creativity. Set along a scenic and well-traveled route, the location offers convenient access to nearby lakes, wineries, and surrounding communities, adding to its long-term appeal. With the right improvements, this property has the potential to become a rewarding primary residence, second home, or investment property. Ideal for buyers seeking a remodeling project, this home is being sold as-is, allowing the next owner to customize it to their needs and goals.
-
2026-02-06historical
-
2025-08-13$69,900 Active
-
1994-01-18soldstatus $48,000
ⓘ Source: listings_history table (triggers on properties + properties_extension) + one-shot
backfill from property_details.listing_events for pre-trigger history.
Tax reassessment forecast NY · Partial reset (capped growth)
- Current annual tax
- $2,509 · $209/mo
- Projected year-2 tax
- $2,509 · $209/mo
- Expected delta
- $0/yr ($0/mo · 0.0%)
ⓘ Screening estimate from a state-policy table — verify with the county assessor before closing.
Climate risk First Street
- Flood 1/10 Low FEMA zone X · 0% chance over 30 yrs
- Wildfire 2/10 Low
- Heat 2/10 Low 7 d/yr ≥95°F today · 15 d/yr by 30 yrs out
- Wind 1/10 Low 0% chance of damaging wind over 30 yrs
- Air quality 2/10 Low 0 unhealthy d/yr today · 1 by 30 yrs out
Nearby sold comps map
Loading sold comps map…
Walkable amenities ~0.75 mi
Loading nearby amenities…
Taxation est. · year 1
- Rental income
- $24,526
- − Mortgage interest
- −$3,915
- − Property taxes
- −$2,509
- − Insurance
- −$350
- − Repairs & maintenance
- −$1,962
- − Management
- −$1,962
- − Depreciation
- −$2,033
- Taxable income
- $11,794
- Est. tax owed @ 24.0%
- −$2,831
- After-tax cash flow
- $9,287/yr
For passive investors: Depreciation is non-cash, so a rental often shows a tax loss while cash-flowing — sheltering income. Rental losses are passive: they offset passive income freely, and up to $25,000/yr can offset ordinary (W-2) income if you actively participate and your MAGI is under $100k (phasing out to $0 by $150k); unused losses carry forward. On sale, claimed depreciation is recaptured at up to 25%, and gains may owe capital-gains tax (a 1031 exchange can defer both). Figures are a year-1 estimate at your 24.0% rate — not tax advice; consult a CPA.
Schools (NCES district)
- District
- Romulus Central School District
- NCES district ID
- 3624930
- Math proficiency
- 46% ▼ -3.00%
- Reading proficiency
- 45% ▲ 3.00%
- Median HH income
- $56,592
- Composite
- 41.89/100
- National rank
- #7126
- State rank
- #535 of 755 in NY
Livability — Romulus
- Score
- 60/100
- State rank
- #983
- US rank
- #19200
Category grades
Schools grade is shown separately in the Schools card above.
Census & demographics
- Population (ZIP)
- 3,523
Population outlook (Seneca County) Hauer SSP2
- Today (2025)
- 33,457 people
- By 2030
- 32,540 · -2.7%
- By 2040
- 30,680 · -8.3%
- By 2050
- 28,875 · -13.7%
- By 2075
- 24,757 · -26.0%
- By 2100
- 19,591 · -41.4%
Race, ethnicity, and origin ACS 2023
- Neighborhood character
- Predominantly White (72%)
- Race & ethnicity
- White 72% Black 16% Hispanic / Latino 8% Two or more races 5%
- Hispanic origin (detail)
- Mexican 3% Puerto Rican 2%
- Common ancestry
- Romanian 3% Slovak 1% Iranian 1%
- Foreign-born
- 3% · Canada
- Languages at home
- 90% English-only · Spanish 5% German/W. Germanic 4% Other Indo-European 1%
Political lean MEDSL · Seneca
- 2024 margin
- R (+11.8) · D 44.1% · R 55.9%
- 2008→2024 swing
- -14.4pp toward R · 2008: 2.6pp · 2024: -11.8pp
- All cycles
- 2024: R+11.8 2020: R+9.1 2016: R+12.1 2012: D+9.2 2008: D+2.6
Not yet ingested
- Civics
- —
Market trends
- HPI YoY
- ▲ 11.44%
- Current HPI
- 354.6427
- Rent YoY
- —
- Metro
- —
- State GDP YoY
- ▲ 2.60%
- F500 in state
- 92
Industry mix (Fortune 500 HQ in NY)
| Industry | F500 HQs | Revenue |
|---|---|---|
| Financial Services | 10 | $950B |
|
||
| Consumer Goods | 9 | $162B |
|
||
| Insurance | 4 | $225B |
|
||
| Telecommunications | 2 | $144B |
|
||
| Pharmaceuticals | 2 | $112B |
|
||
| Media / Entertainment | 2 | $69B |
|
||
Price history
+45.6% since first listed4 events — show timeline
- 2026-02-09 Listed $69,900 UNYREIS
- 2026-02-06 Listing Removed — UNYREIS
- 2025-08-13 Listed $69,900 UNYREIS
- 1994-01-18 Sold (Public Records) $48,000 Public Records
Property tax history
+4.8%/yrLatest (2025): $2,509 · +8.1% YoY. Source: county tax records.
Cash-flow waterfall
monthlySold comps — $/sqft
last 12 mo · ≤1 miLoading sold comps…