 🏗️ New Construction
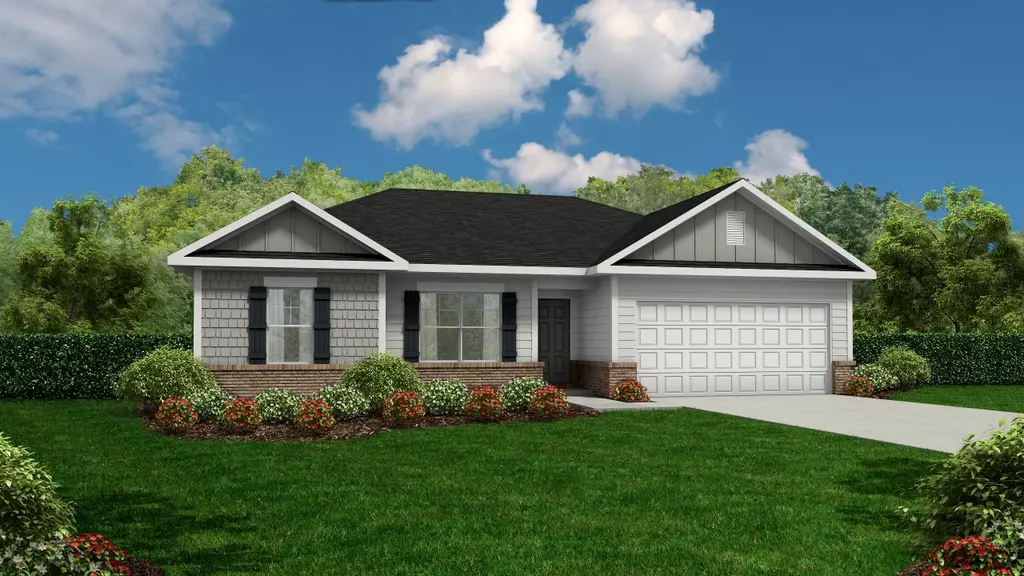
Stafford Plan · Walthourville, GA
Flood risk No data
- FEMA flood zone
- —
- Chance of flooding over 30 yrs
- —
- Est. flood insurance / yr
- —
Fire risk No data
- Est. fire insurance / yr
- —
Heat risk No data
- Hot days now (above threshold)
- —
- Hot days in 30 yrs
- —
Wind risk No data
- Chance of severe wind over 30 yrs
- —
Air-quality risk No data
- Unhealthy air days now
- —
- Unhealthy air days in 30 yrs
- —
Risk factors via First Street. Map © Google.
Why this score? — see what drove the D grade
The composite is a weighted blend of 9 inputs, each scored 0–100. Each bar is that input's sub-score; the figure is the points it added to the 100-point composite (weight × sub-score).
- Cash flow +10.2/30.0
- ARV discount +7.5/15.0
- Appreciation +5.1/10.0
- Condition / age +5.0/5.0
- 1% rule +3.2/10.0
- Livability +3.2/5.0
- DSCR +2.9/10.0
- Rent growth +2.5/5.0
- Schools +2.3/10.0
$263,900
🖨 Deal sheet (PDF) 📄 Offer letter ✓ Due diligence
Listing remarks MLS
The Stafford floor plan is loaded with curb appeal and always catches the eye. Ideal for any sized family, this flexible plan can have either 3 or 4 bedrooms. The open concept living area features clear sight lines from both the kitchen and breakfast area, plus an additional dining room that could be converted into the fourth bedroom. The master suite has a huge walk-in closet, plus a private bath with dual vanity, garden tub and separate shower. Artistic renderings are for informational purposes only. Actual floor plans, features and inclusions may vary.
Key facts
- 2 parking spots
- Listed 393 days
Neighborhood map
What this means for you Summary
Snapshot
- This is a 4-bed/2.0-bath single-family listed at $264k. Condition is rated excellent.
Deal economics
- At list price, monthly cash flow is $-156 ($-2k/yr) — negative.
- To cash-flow at today's rent, offer at most $249k (5.5% below list).
- To meet the 1% rule (rent ≥ 1% of price), the offer needs to be $222k (15.7% below list).
- Recommended offer: $222k (15.7% below list) — sets the bar for 1% rule.
Location & tenants
- Location reads 64/100 on livability (#255 in GA) — a middle-class / working-renter tenant base. Strengths: cost of living A+, housing A+, crime B; Watch: employment D, amenities F, commute F.
- Long County (rural): math 26% / reading 26% proficiency, ranked #115 of 174 in GA (top 66%) — low school quality limits family demand, transient renter base, plan for 1-2y turnover; 61% free/reduced lunch — lower-income household profile, screen leases tightly.
- Zoned schools: Smiley Elementary School (1,258 students, 67% FRL); Long County Middle School (math 21% / reading 27%, grade F, #311 of 470 statewide, top 68%, 945 students, 69% FRL); Long County High School (math 37% / reading 22%, grade F, #140 of 424 statewide, top 35%, 1,209 students, 70% FRL).
- Market conditions: 141 active listings in the ZIP; 298 units permitted in Long County in 2024 (0 in 5+ unit buildings).
- This rent runs 41% of the median local income ($65k/yr) — at the standard rent-burdened threshold; future hikes will face affordability resistance.
Forward outlook
- In year one you build about $2k of equity ($2k loan paydown + $423 appreciation (0.2% local appreciation)).
- Long County population projected at +72% by 2050 — long-run rental-demand tailwind backs the buy-and-hold thesis.
- By year 10, paydown + projected appreciation supports a ~$30k cash-out refi (75% LTV) — recoverable capital for the next deal without selling this one.
Negotiation context
- It's been on market 393 days — a 12% lower offer ($232k) is reasonable based on typical stale-listing flexibility.
Questions for the listing agent
- What do current leases actually rent for vs. the listed asking? Can we see a recent rent roll and the last 12 months of T-12 income?
- It's been on market 393 days. Have you received any prior offers? Is the seller open to a 16% concession, seller financing, or rate buy-down credit?
- What does the HOA fee cover, when was the last increase, and are there any pending special assessments or reserve-fund shortfalls?
- Why hasn't it sold? Are there any deal-killer items the seller is aware of (foundation, flood, title, zoning, code violations)?
- Is there a deadline driving the sale (1031 exchange, divorce, estate, relocation)? That informs how much negotiation room exists.
- Schools are F-rated, which usually means shorter tenancies and higher turnover. Who's the typical renter profile here, and what's been the actual vacancy rate?
- The area grade is low — what's the realistic commute time and amenity access for the typical tenant pool here? Any planned neighborhood developments (good or bad) we should know about?
- What's the average days-on-market for RENTAL listings here right now (not sales)? A rising rental-DOM trend means longer vacancies and softer asking-rent achievability than the comps imply.
- What's the recent tenant-quality profile in this submarket — average credit score on applications, eviction rate, late-payment / NSF rate, and stable-employment percentage? A property-management company in the area should have these aggregated.
- How much new for-sale + rental construction is in the pipeline within 1–3 miles? Heavy new supply typically softens prices + rents 12–24 months out; constrained supply supports both.
Investment metrics
- 1% rule
- 0.82% ✗
- Cap rate
- 5.61%
- Cash-on-cash
- -2.46%
- DSCR
- 0.89
- GRM
- 10.2
CMA / ARV
- ARV (median comp)
- $271,986
- List price
- $263,900
- Delta
- -2.97%
- Verdict
- FAIR
- Comps
- 20 within 1.0 mi
Show comp detail 12 sales within ~0.75 mi
| Address | Dist | Beds/Ba | Sqft | Sold | Price | $/sf | Match |
|---|---|---|---|---|---|---|---|
| 663 Buckhead Loop SE | 0.52mi | 4/2.0 | 1,565 (0%) | 1mo | $276,975 | $177 | 75 |
| 1118 Buckhead Loop SE | 0.52mi | 4/2.0 | 1,565 (0%) | 6mo | $275,650 | $176 | 71 |
| 722 Buckhead Loop SE | 0.52mi | 4/2.5 | 1,609 (+3%) | 0mo | $279,800 | $174 | 69 |
| 1007 Buckhead Loop SE | 0.61mi | 4/2.0 | 1,565 (0%) | 6mo | $289,210 | $185 | 66 |
| 964 Buckhead Loop SE | 0.66mi | 4/2.0 | 1,565 (0%) | 7mo | $268,875 | $172 | 63 |
| 1094 Buckhead Loop SE | 0.54mi | 4/2.0 | 1,620 (+4%) | 7mo | $279,660 | $173 | 63 |
| 3573 SE Arnall Dr | 0.60mi | 3/2.0 (-1) | 1,596 (+2%) | 2mo | $246,900 | $155 | 62 |
| 977 Buckhead Loop SE | 0.63mi | 4/2.0 | 1,620 (+4%) | 7mo | $277,750 | $171 | 59 |
| 1072 Buckhead Loop SE | 0.56mi | 3/2.0 (-1) | 1,527 (-2%) | 8mo | $271,000 | $177 | 58 |
| 1000 Buckhead Loop SE | 0.63mi | 3/2.0 (-1) | 1,380 (-12%) | 7mo | $261,325 | $189 | 40 |
| 265 Antler Ave SE | 0.66mi | 3/2.0 (-1) | 1,380 (-12%) | 6mo | $259,945 | $188 | 39 |
| 284 Antler Ave SE | 0.69mi | 3/2.0 (-1) | 1,380 (-12%) | 7mo | $274,765 | $199 | 38 |
Match score weights: distance 35% · size 25% · config 20% · recency 20%. Top-matched comps best support the ARV.
Projected returns pro-forma
0.16% appreciation · 3.0% rent growth · sell at horizon
- IRR
- -4.4%
- Equity multiple
- 0.79×
- Total profit
- $-15,840
- Equity at exit
- $81,096
- IRR
- 1.4%
- Equity multiple
- 1.15×
- Total profit
- $11,589
- Equity at exit
- $99,190
Cash invested: $76,156 (down + closing). Projections, not guarantees.
Landlord ↔ Tenant lean methodology
- Overall (STATE)
- 90 Strongly Landlord-Friendly
- State Georgia
- 90 Strongly Landlord-Friendly · R+3
- County
- — inherits STATE
- City
- — inherits STATE
ZIP-level market 31301
- Home prices YoY
- 0.1%
- Active inventory
- 141
- Price-to-rent
- 9.9×
Monthly cashflow live
- Estimated rent
- $2,225 medium interval (Pro) →
- Mortgage (P&I)
- −$1,426
- Tax est. 1.5%
- −$340 /mo · $4,080/yr
- Insurance
- −$113
- HOA
- −$34
- Vacancy / Maint / Mgmt
- −$467
- Net cashflow
- $-156
Break-even live
Sensitivity live
| Price | -10% $32 | -5% $-62 | +0% $-156 | +5% $-250 | +10% $-344 |
|---|---|---|---|---|---|
| Rent | -10% $-332 | -5% $-244 | +0% $-156 | +5% $-68 | +10% $20 |
| Rate | -1.0pp $-19 | -0.5pp $-87 | base $-156 | +0.5pp $-226 | +1.0pp $-298 |
UW: 25.0% down · 7.5% · 30yr · 1.5% tax · 5.0% vac · 8.0% maint · 8.0% mgmt
Financing live
Cash to close
- Down payment
- $67,997
- Closing costs
- $8,160
- Reserves months
- —
- Total cash needed
- —
Loan-product check · same deal, 3 products live
Conventional
25% down · 7.5% · 30yr
- Down + closing
- —
- Monthly P&I
- —
- Monthly cashflow
- —
- DSCR
- —
- Eligible?
- —
Personal DTI + credit; lowest rate.
DSCR
20% down · 8.5% · 30yr
- Down + closing
- —
- Monthly P&I
- —
- Monthly cashflow
- —
- DSCR
- —
- Eligible?
- —
No personal income docs; deal must DSCR.
Hard money
10% down · 12.0% · 12mo
- Down + closing
- —
- Monthly P&I
- —
- Monthly cashflow
- —
- DSCR
- —
- Eligible?
- —
Short-term bridge; refi at stabilization.
HOA detail
- Monthly dues
- $34 · $408/yr
Listing history 19 events
-
2026-06-21days on market $263,900 Active 393 DOM
-
2026-06-19days on market $263,900 Active 391 DOM
-
2026-06-18days on market $263,900 Active 390 DOM
-
2026-06-17days on market $263,900 Active 389 DOM
-
2026-06-16days on market $263,900 Active 388 DOM
-
2026-06-15days on market $263,900 Active 387 DOM
-
2026-06-14days on market $263,900 Active 385 DOM
-
2026-06-13days on market $263,900 Active 384 DOM
-
2026-06-10days on market $263,900 Active 382 DOM
-
2026-06-09days on market $263,900 Active 381 DOM
-
2026-06-08days on market $263,900 Active 380 DOM
-
2026-06-07days on market $263,900 Active 379 DOM
-
2026-06-05days on market $263,900 Active 376 DOM
-
2026-06-03days on market $263,900 Active 375 DOM
-
2026-06-02days on market $263,900 Active 374 DOM
-
2026-06-01days on market $263,900 Active 373 DOM
-
2026-05-31days on market $263,900 Active 372 DOM
-
2026-05-30days on market $263,900 Active 371 DOM
-
2025-05-24$263,900 Active 561-char remark
Show marketing remark (561 chars)
The Stafford floor plan is loaded with curb appeal and always catches the eye. Ideal for any sized family, this flexible plan can have either 3 or 4 bedrooms. The open concept living area features clear sight lines from both the kitchen and breakfast area, plus an additional dining room that could be converted into the fourth bedroom. The master suite has a huge walk-in closet, plus a private bath with dual vanity, garden tub and separate shower. Artistic renderings are for informational purposes only. Actual floor plans, features and inclusions may vary.
ⓘ Source: listings_history table (triggers on properties + properties_extension) + one-shot
backfill from property_details.listing_events for pre-trigger history.
Nearby sold comps map
Loading sold comps map…
Walkable amenities ~0.75 mi
Loading nearby amenities…
Taxation est. · year 1
- Rental income
- $26,700
- − Mortgage interest
- −$15,235
- − Property taxes
- −$4,080
- − Insurance
- −$1,360
- − Repairs & maintenance
- −$2,136
- − Management
- −$2,136
- − HOA
- −$408
- − Depreciation
- −$7,912
- Taxable loss
- −$6,568
- Est. tax savings @ 24.0%
- +$1,576
- After-tax cash flow
- $-295/yr
For passive investors: Depreciation is non-cash, so a rental often shows a tax loss while cash-flowing — sheltering income. Rental losses are passive: they offset passive income freely, and up to $25,000/yr can offset ordinary (W-2) income if you actively participate and your MAGI is under $100k (phasing out to $0 by $150k); unused losses carry forward. On sale, claimed depreciation is recaptured at up to 25%, and gains may owe capital-gains tax (a 1031 exchange can defer both). Figures are a year-1 estimate at your 24.0% rate — not tax advice; consult a CPA.
Condition & rehab AI · 12 photos
This Stafford floor plan is move-in ready with excellent curb appeal and a well-maintained interior. Minor updates to paint and landscaping would further enhance its value.
Value-add opportunities
- Both Painting exterior and interior walls — Fresh paint enhances curb appeal and interior aesthetics
- Both Landscaping improvements — Enhances curb appeal and adds value
- Resale Kitchen backsplash — Modern backsplash adds visual interest and value
- Resale Bathroom fixtures — Updated fixtures improve functionality and aesthetics
Renovation cost estimate screening
Value-add ROI direction
- Both Painting exterior and interior walls — Fresh paint enhances curb appeal and interior aesthetics ↑
- Both Landscaping improvements — Enhances curb appeal and adds value ↑
- Resale Kitchen backsplash — Modern backsplash adds visual interest and value ↑
- Resale Bathroom fixtures — Updated fixtures improve functionality and aesthetics ↑
ⓘ Cost ranges are severity-bucket heuristics (US national rule-of-thumb). Get contractor quotes + a written scope before underwriting a rehab budget.
Schools (NCES district)
- District
- Long County
- NCES district ID
- 1303360
- Math proficiency
- 26% ▼ -14.00%
- Reading proficiency
- 26% ▼ -13.00%
- Median HH income
- $45,958
- Composite
- 22.51/100
- National rank
- #8090
- State rank
- #115 of 174 in GA
Livability — Walthourville
- Score
- 64/100
- State rank
- #255
- US rank
- #14108
Category grades
Schools grade is shown separately in the Schools card above.
Census & demographics
- County
- Liberty County · 58,565 people
- City population
- 4,933
- Metro
- Hinesville, GA
- Population (ZIP)
- 4,933
- Household income
- $65,417
- Rent vs Own
- Severe rent burden
- 121.0
Population outlook (Long County) Hauer SSP2
- Today (2025)
- 24,669 people
- By 2030
- 28,223 · +14.4%
- By 2040
- 35,430 · +43.6%
- By 2050
- 42,403 · +71.9%
- By 2075
- 56,996 · +131.0%
- By 2100
- 64,185 · +160.2%
Race, ethnicity, and origin ACS 2023
- Neighborhood character
- Diverse neighborhood (Simpson 0.64)
- Race & ethnicity
- Black 51% White 31% Two or more races 15% Hispanic / Latino 9%
- Hispanic origin (detail)
- Mexican 2% Puerto Rican 7%
- Common ancestry
- Slovak 1% Lithuanian 1%
- Foreign-born
- 3% · Canada
- Languages at home
- 96% English-only · Spanish 2%
Political lean MEDSL · Long
- 2024 margin
- Strong R (+29.5) · D 35.1% · R 64.6%
- 2008→2024 swing
- -5.4pp toward R · 2008: -24.1pp · 2024: -29.5pp
- All cycles
- 2024: R+29.5 2020: R+26.4 2016: R+30.8 2012: R+22.9 2008: R+24.1
Not yet ingested
- Civics
- —
Market trends
- HPI YoY
- ▲ 0.16%
- Current HPI
- 187.7716
- Rent YoY
- —
- Metro
- Hinesville, GA
- State GDP YoY
- ▲ 2.66%
- F500 in state
- 28
Industry mix (Fortune 500 HQ in GA)
| Industry | F500 HQs | Revenue |
|---|---|---|
| Paper / Packaging | 2 | $29B |
|
||
| Retail | 1 | $160B |
|
||
| Transportation / Logistics | 1 | $91B |
|
||
| Airlines | 1 | $62B |
|
||
| Consumer Goods | 1 | $47B |
|
||
| Utilities | 1 | $25B |
|
||
Price history
1 event — show timeline
- 2025-05-24 Listed $263,900 Zillow
Cash-flow waterfall
monthlySold comps — $/sqft
last 12 mo · ≤1 miLoading sold comps…