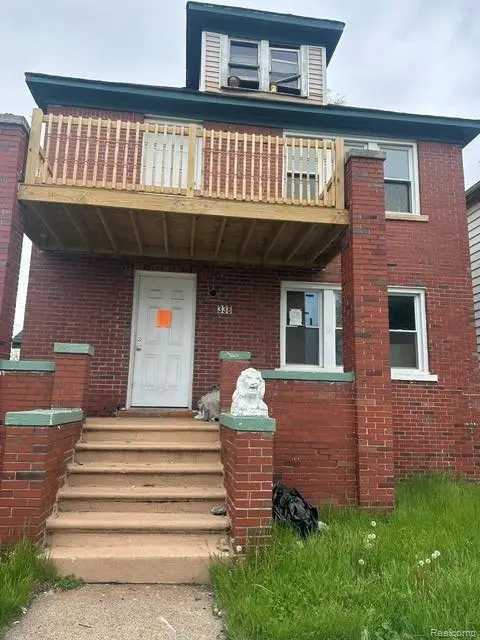
338 Richter St · River Rouge, MI
Flood risk 9/10 · Severe
- FEMA flood zone
- X (unshaded)
- Chance of flooding over 30 yrs
- 0.99%
- Est. flood insurance / yr
- $473 – $860
Fire risk 1/10 · Minimal
- Est. fire insurance / yr
- $784 – $1,456
Heat risk 3/10 · Minor
- Hot days now (above 95°F)
- 7 days/yr
- Hot days in 30 yrs
- 16 days/yr
Wind risk 2/10 · Minimal
- Chance of severe wind over 30 yrs
- —
Air-quality risk 4/10 · Minor
- Unhealthy air days now
- 6 days/yr
- Unhealthy air days in 30 yrs
- 8 days/yr
Risk factors via First Street. Map © Google.
Why this score? — see what drove the D- grade
The composite is a weighted blend of 9 inputs, each scored 0–100. Each bar is that input's sub-score; the figure is the points it added to the 100-point composite (weight × sub-score).
- Cash flow +11.9/30.0
- Appreciation +10.0/10.0
- 1% rule +4.3/10.0
- DSCR +3.5/10.0
- Livability +3.2/5.0
- Rent growth +2.5/5.0
- Condition / age +2.5/5.0
- Schools +0.5/10.0
- ARV discount +0.0/15.0
$150,000
🖨 Deal sheet (PDF) 📄 Offer letter ✓ Due diligence
Listing remarks MLS
INVESTOR SPECIAL – TWO-FAMILY BRICK FLAT FOR SALE! Don't miss this incredible opportunity to finish and profit from this spacious two-unit brick multifamily property! This solid investment property features:2 Units, 2 Bedrooms / 1 Bathroom Per Unit, Brick Construction, Hardwood Floors, Major Renovations Already Started. Recent improvements include: New Electrical Work, New Plumbing Updates, HVAC Installation Started, Drywall Replacement in Several Areas, Flooring Improvements Completed. A significant amount of work and money has already been invested, allowing the next owner to complete the renovation and maximize returns. Perfect for a buy-and-hold investor, house hacker, or fix-and-flip opportunity. Motivated Seller – Distressed Situation Creates Opportunity! Whether you're looking to generate rental income or build equity through renovation, this property offers tremendous upside potential. A must see, Opportunities like this don't last long!
Key facts
- New plumbing updates
- New electrical work
- Brick construction
Tags
Property features AI
Exterior
- Utilities: Public water; Public sewer; Water and sewer available
- Home design: Multi-family residential property; Above-grade finished area approximately 1,728 square feet
- Construction: Brick construction
- Exterior features: Paved road frontage; Alley access; Pets allowed; Lot dimensions approximately 49 x 100 (0.11 acre); Zoned for multifamily/residential
Interior
- Bathrooms: 2 full bathrooms
- Heating & cooling: Forced air heating (natural gas); Separate meters for heating; No central cooling
- Interior features: Full unfinished basement
Neighborhood map
What this means for you Summary
Snapshot
- This is a 4-bed/2.0-bath single-family listed at $150k.
Deal economics
- At list price, monthly cash flow is $-95 ($-1k/yr) — negative.
- To cash-flow at today's rent, offer at most $133k (11.2% below list).
- To meet the 1% rule (rent ≥ 1% of price), the offer needs to be $139k (7.3% below list).
- Recommended offer: $133k (11.2% below list) — sets the bar for cash-flow.
- Cap rate 6.0% vs local median 8.8% in River Rouge — below-typical yield; the buyer is paying a premium for something (appreciation thesis, condition, location) that the cap rate doesn't capture.
Location & tenants
- Location reads 65/100 on livability (#454 in MI) — a middle-class / working-renter tenant base. Strengths: commute A+, cost of living A+, housing B+; Watch: health & safety D, crime F, amenities F.
- River Rouge School District (suburban): math 3% / reading 12% proficiency, ranked #535 of 540 in MI (top 99%) — low school quality limits family demand, transient renter base, plan for 1-2y turnover; 89% free/reduced lunch — lower-income household profile, screen leases tightly.
- Zoned schools: Ann Visger K5 Preparatory Academy (math 2% / reading 8%, grade F, #1,325 of 1,397 statewide, top 99%, 621 students, 93% FRL); Cb Sabbath 68 Preparatory Academy (math 2% / reading 12%, grade F, #481 of 493 statewide, top 98%, 301 students, 93% FRL); River Rouge High School (math 2% / reading 8%, grade F, #704 of 713 statewide, top 100%, 966 students, 85% FRL) — zoned schools at 90% FRL track the district average.
- Market conditions: 60 active listings in the ZIP; 3 comparable units currently listed for rent nearby; rentals at typical pace (median 20d on market — plan ~3-4 weeks tenant-placement turnaround); 2,639 units permitted in Wayne County in 2024 (1,216 in 5+ unit buildings).
Forward outlook
- In year one you build about $16k of equity ($1k loan paydown + $15k appreciation (10.0% local appreciation)).
- Wayne County population projected at -17% by 2050 — secular population decline; favor cash flow + early exit over multi-decade hold.
- By year 3, paydown + projected appreciation supports a ~$41k cash-out refi (75% LTV) — recoverable capital for the next deal without selling this one.
Negotiation context
- Only 13 days on market — expect competitive offers; lowballing is unlikely to land.
- 7 sale attempts since 23y ago with the ask held roughly flat each time — persistent listings suggest the price (not the market) is what's stuck; bring a comps-based counter.
- Current owner paid $64k; list at $150k implies a 134% gain — meaningful room to come down on a strong offer.
Risks & watch-outs
- Watch-outs: flood insurance adds $56/mo; built in 1929 — expect roof / HVAC / electrical / plumbing capex.
- Climate carrying-cost: severe flood risk — expect insurance premiums to compound above CPI over the hold.
Questions for the listing agent
- What do current leases actually rent for vs. the listed asking? Can we see a recent rent roll and the last 12 months of T-12 income?
- Built in 1929 — when were the roof, HVAC, electrical panel, plumbing, and water heater last replaced?
- What's the actual annual flood-insurance premium (NFIP or private), and is the property in a SFHA with mandatory coverage?
- Is there a deadline driving the sale (1031 exchange, divorce, estate, relocation)? That informs how much negotiation room exists.
- Schools are F-rated, which usually means shorter tenancies and higher turnover. Who's the typical renter profile here, and what's been the actual vacancy rate?
- Crime grade is F in this area — have there been break-ins, vandalism, or insurance claims at this property in the last 3 years? What carrier currently insures it and at what premium?
- The area grade is low — what's the realistic commute time and amenity access for the typical tenant pool here? Any planned neighborhood developments (good or bad) we should know about?
- What's the average days-on-market for RENTAL listings here right now (not sales)? A rising rental-DOM trend means longer vacancies and softer asking-rent achievability than the comps imply.
- What's the recent tenant-quality profile in this submarket — average credit score on applications, eviction rate, late-payment / NSF rate, and stable-employment percentage? A property-management company in the area should have these aggregated.
- How much new for-sale + rental construction is in the pipeline within 1–3 miles? Heavy new supply typically softens prices + rents 12–24 months out; constrained supply supports both.
Investment metrics
- 1% rule
- 0.93% ✗
- Cap rate
- 5.98%
- Cash-on-cash
- -1.13%
- DSCR
- 0.95
- GRM
- 9.0
CMA / ARV
- ARV (on-the-fly)
- $126,144
- Comps found
- 12
Show comp detail 12 sales within ~0.75 mi
| Address | Dist | Beds/Ba | Sqft | Sold | Price | $/sf | Match |
|---|---|---|---|---|---|---|---|
| 389 Genessee St | 0.18mi | 3/2.0 (-1) | 1,760 (+2%) | 1mo | $72,000 | $41 | 83 |
| 20 Hill St | 0.29mi | 3/2.0 (-1) | 1,722 (-0%) | 1mo | $125,000 | $73 | 80 |
| 311 Richter St | 0.08mi | 3/1.0 (-1) | 1,644 (-5%) | 1mo | $143,250 | $87 | 78 |
| 112 Walnut St | 0.14mi | 4/1.5 | 1,650 (-4%) | 12mo | $130,000 | $79 | 74 |
| 292 Genessee St | 0.20mi | 3/1.0 (-1) | 1,848 (+7%) | 2mo | $125,000 | $68 | 68 |
| 75 Abbott St | 0.13mi | 4/1.0 | 1,848 (+7%) | 13mo | $50,000 | $27 | 68 |
| 116 Pine St | 0.26mi | 4/2.0 | 1,559 (-10%) | 10mo | $173,000 | $111 | 64 |
| 110 Pine St | 0.26mi | 5/2.0 (+1) | 1,590 (-8%) | 9mo | $184,800 | $116 | 62 |
| 60 Batavia St | 0.47mi | 3/1.0 (-1) | 1,720 (-0%) | 12mo | $150,000 | $87 | 58 |
| 25 Marie St | 0.69mi | 4/2.5 | 1,736 (+0%) | 10mo | $60,000 | $35 | 57 |
| 24 Linden St | 0.70mi | 4/2.0 | 1,889 (+9%) | 3mo | $80,000 | $42 | 49 |
| 92 E Pleasant St | 0.58mi | 3/1.0 (-1) | 1,831 (+6%) | 12mo | $133,000 | $73 | 44 |
Match score weights: distance 35% · size 25% · config 20% · recency 20%. Top-matched comps best support the ARV.
Projected returns pro-forma
10.0% appreciation · 3.0% rent growth · sell at horizon
- IRR
- 22.4%
- Equity multiple
- 2.80×
- Total profit
- $75,760
- Equity at exit
- $135,132
- IRR
- 20.1%
- Equity multiple
- 6.43×
- Total profit
- $228,092
- Equity at exit
- $291,417
Cash invested: $42,000 (down + closing). Projections, not guarantees.
Landlord ↔ Tenant lean methodology
- Overall (STATE)
- 62 Landlord-Friendly
- State Michigan
- 62 Landlord-Friendly · EVEN
- County
- — inherits STATE
- City
- — inherits STATE
ZIP-level market 48218
- Home prices YoY
- 28.4%
- Active inventory
- 60
- Price-to-rent
- 9.0×
Monthly cashflow live
- Estimated rent
- $1,390 medium interval (Pro) →
- Mortgage (P&I)
- −$787
- Tax from tax record
- −$288 /mo · $3,461/yr
- Insurance
- −$62
- Flood insurance flood zone
- −$56 /mo · $666/yr
- HOA
- −$0
- Vacancy / Maint / Mgmt
- −$292
- Net cashflow
- $-95
Break-even live
Sensitivity live
| Price | -10% $-10 | -5% $-53 | +0% $-95 | +5% $-137 | +10% $-180 |
|---|---|---|---|---|---|
| Rent | -10% $-205 | -5% $-150 | +0% $-95 | +5% $-40 | +10% $15 |
| Rate | -1.0pp $-19 | -0.5pp $-57 | base $-95 | +0.5pp $-134 | +1.0pp $-173 |
UW: 25.0% down · 7.5% · 30yr · 1.5% tax · 5.0% vac · 8.0% maint · 8.0% mgmt
Financing live
Cash to close
- Down payment
- $37,500
- Closing costs
- $4,500
- Reserves months
- —
- Total cash needed
- —
Loan-product check · same deal, 3 products live
Conventional
25% down · 7.5% · 30yr
- Down + closing
- —
- Monthly P&I
- —
- Monthly cashflow
- —
- DSCR
- —
- Eligible?
- —
Personal DTI + credit; lowest rate.
DSCR
20% down · 8.5% · 30yr
- Down + closing
- —
- Monthly P&I
- —
- Monthly cashflow
- —
- DSCR
- —
- Eligible?
- —
No personal income docs; deal must DSCR.
Hard money
10% down · 12.0% · 12mo
- Down + closing
- —
- Monthly P&I
- —
- Monthly cashflow
- —
- DSCR
- —
- Eligible?
- —
Short-term bridge; refi at stabilization.
Rent comps 3 comps
| Address | Beds | Baths | Sqft | Rent | $/sqft | DOM | Units | Dist |
|---|---|---|---|---|---|---|---|---|
| 3801 18th St Ecorse, MI | 3.0 | 1.0 | 1196 | $1,150 | $0.96 | 19d | 1 | 1.15mi |
| 3804 18th St Unit F2 Ecorse, MI | 5.0 | 1.0 | 2160 | $1,665 | $0.77 | 5d | 1 | 1.18mi |
| 4015 16th St Ecorse, MI | 3.0 | 1.5 | 1170 | $1,300 | $1.11 | 26d | 1 | 1.43mi |
Listing history 8 events
-
2026-06-21days on market $150,000 Active 13 DOM
-
2026-06-18days on market $150,000 Active 10 DOM
-
2026-06-17days on market $150,000 Active 9 DOM
-
2026-06-16days on market $150,000 Active 8 DOM
-
2026-06-15days on market $150,000 Active 7 DOM
-
2026-06-13days on market $150,000 Active 5 DOM
-
2026-06-09remarks 687-char remark
-
2026-06-09$150,000 Active 1 DOM
ⓘ Source: listings_history table (triggers on properties + properties_extension) + one-shot
backfill from property_details.listing_events for pre-trigger history.
Tax reassessment forecast MI · Partial reset (capped growth)
- Current annual tax
- $3,461 · $288/mo
- Projected year-2 tax
- $3,461 · $288/mo
- Expected delta
- $0/yr ($0/mo · 0.0%)
ⓘ Screening estimate from a state-policy table — verify with the county assessor before closing.
Climate risk First Street
- Flood 9/10 Extreme FEMA zone X (unshaded) · 99% chance over 30 yrs
- Wildfire 1/10 Low
- Heat 3/10 Moderate 7 d/yr ≥95°F today · 16 d/yr by 30 yrs out
- Wind 2/10 Low
- Air quality 4/10 Moderate 6 unhealthy d/yr today · 8 by 30 yrs out
Nearby sold comps map
Loading sold comps map…
Walkable amenities ~0.75 mi
Loading nearby amenities…
Taxation est. · year 1
- Rental income
- $16,680
- − Mortgage interest
- −$8,402
- − Property taxes
- −$3,461
- − Insurance
- −$1,416
- − Repairs & maintenance
- −$1,334
- − Management
- −$1,334
- − Depreciation
- −$4,364
- Taxable loss
- −$3,633
- Est. tax savings @ 24.0%
- +$872
- After-tax cash flow
- $-268/yr
For passive investors: Depreciation is non-cash, so a rental often shows a tax loss while cash-flowing — sheltering income. Rental losses are passive: they offset passive income freely, and up to $25,000/yr can offset ordinary (W-2) income if you actively participate and your MAGI is under $100k (phasing out to $0 by $150k); unused losses carry forward. On sale, claimed depreciation is recaptured at up to 25%, and gains may owe capital-gains tax (a 1031 exchange can defer both). Figures are a year-1 estimate at your 24.0% rate — not tax advice; consult a CPA.
Schools (NCES district)
- District
- River Rouge School District
- NCES district ID
- 2629760
- Math proficiency
- 3% ▼ -7.00%
- Reading proficiency
- 12% ▼ -4.00%
- Median HH income
- $26,664
- Composite
- 5.29/100
- National rank
- #10033
- State rank
- #535 of 540 in MI
Livability — River Rouge
- Score
- 65/100
- State rank
- #454
- US rank
- #12700
Category grades
Schools grade is shown separately in the Schools card above.
Census & demographics
- Census place
- River Rouge, MI
- City population
- 7,096
- Population (ZIP)
- 7,096
Population outlook (Wayne County) Hauer SSP2
- Today (2025)
- 1,675,273 people
- By 2030
- 1,620,300 · -3.3%
- By 2040
- 1,502,341 · -10.3%
- By 2050
- 1,384,039 · -17.4%
- By 2075
- 1,124,592 · -32.9%
- By 2100
- 881,193 · -47.4%
Race, ethnicity, and origin ACS 2023
- Neighborhood character
- Diverse neighborhood (Simpson 0.66)
- Race & ethnicity
- Black 45% White 34% Two or more races 16% Hispanic / Latino 16%
- Hispanic origin (detail)
- Mexican 9% Puerto Rican 5%
- Common ancestry
- Romanian 4% Lithuanian 2% Italian 1%
- Foreign-born
- 6% · Canada
- Languages at home
- 86% English-only · Spanish 11% Arabic 2% Other Indo-European 1%
Political lean MEDSL · Wayne
- 2024 margin
- Strong D (+29.0) · D 62.7% · R 33.7% · Other 3.6%
- 2008→2024 swing
- -20.5pp toward R · 2008: 49.5pp · 2024: 29.0pp
- All cycles
- 2024: D+29.0 2020: D+38.1 2016: D+37.3 2012: D+46.9 2008: D+49.5
Not yet ingested
- Civics
- —
Market trends
- HPI YoY
- ▲ 77.93%
- Current HPI
- 352.3551
- Rent YoY
- —
- Metro
- —
- State GDP YoY
- ▲ 1.37%
- F500 in state
- 28
Industry mix (Fortune 500 HQ in MI)
| Industry | F500 HQs | Revenue |
|---|---|---|
| Automotive Parts | 3 | $48B |
|
||
| Automotive | 2 | $372B |
|
||
| Chemicals | 1 | $45B |
|
||
| Automotive Retail | 1 | $29B |
|
||
| Healthcare / Medical Devices | 1 | $23B |
|
||
| Automotive Technology | 1 | $20B |
|
||
Price history
+87.7% since first listed20 events — show timeline
- 2026-06-08 Listed $150,000 REALCOMP
- 2026-06-08 Listed $150,000 MiRealSource-MiMLS
- 2025-05-20 Sold (Public Records) $64,000 Public Records
- 2025-05-13 Sold (MLS) $64,000 REALCOMP
- 2025-05-13 Sold (MLS) $64,000 MiRealSource-MiMLS
- 2025-05-03 Pending — MiRealSource-MiMLS
- 2025-05-03 Pending — REALCOMP
- 2025-04-24 Price Changed $64,000 MiRealSource-MiMLS
- 2025-04-24 Price Changed $64,000 REALCOMP
- 2025-04-03 Listed $65,000 REALCOMP
- 2025-04-02 Listed $65,000 MiRealSource-MiMLS
- 2009-07-31 Sold (MLS) $9,500 MiRealSource-MiMLS
- 2009-06-26 Listing Removed — MiRealSource-MiMLS
- 2009-04-16 Listed $19,000 MiRealSource-MiMLS
- 2004-05-18 Sold (Public Records) $50,000 Public Records
- 2003-11-21 Sold (MLS) $50,000 MiRealSource-MiMLS
- 2003-11-17 Listing Removed — MiRealSource-MiMLS
- 2003-07-17 Listed $60,000 MiRealSource-MiMLS
- 2003-07-10 Listing Removed — MiRealSource-MiMLS
- 2003-01-10 Listed $79,900 MiRealSource-MiMLS
Property tax history
+10.1%/yrLatest (2025): $3,461 · +171.9% YoY. Source: county tax records.
Cash-flow waterfall
monthlySold comps — $/sqft
last 12 mo · ≤1 miLoading sold comps…