 Duplex
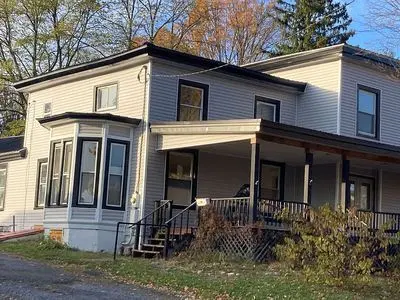
4921 N Jefferson St · Pulaski, NY
Flood risk 1/10 · Minimal
- FEMA flood zone
- X (unshaded)
- Chance of flooding over 30 yrs
- 0.0%
- Est. flood insurance / yr
- $473 – $860
Fire risk 1/10 · Minimal
- Est. fire insurance / yr
- $691 – $1,283
Heat risk 2/10 · Minimal
- Hot days now (above 91°F)
- 7 days/yr
- Hot days in 30 yrs
- 18 days/yr
Wind risk 1/10 · Minimal
- Chance of severe wind over 30 yrs
- 0.0%
Air-quality risk 3/10 · Minor
- Unhealthy air days now
- 3 days/yr
- Unhealthy air days in 30 yrs
- 4 days/yr
Risk factors via First Street. Map © Google.
Why this score? — see what drove the C- grade
The composite is a weighted blend of 9 inputs, each scored 0–100. Each bar is that input's sub-score; the figure is the points it added to the 100-point composite (weight × sub-score).
- Cash flow +14.2/30.0
- Appreciation +9.1/10.0
- ARV discount +7.5/15.0
- DSCR +4.3/10.0
- Schools +4.3/10.0
- 1% rule +3.8/10.0
- Livability +3.7/5.0
- Rent growth +2.5/5.0
- Condition / age +2.5/5.0
$289,000
🖨 Deal sheet 📄 Offer letter ✓ Due diligence
Multi-family units
County records classify this as Multi-Family (2-4 Unit). Listing-text estimate: 2 units. confirmed
Listing remarks MLS
Prime location, beautiful old style home located directly in the heart of Pulaski! This charming 2 story home is ready to be your next income producing investment. Previously used as a dual family rental, the upstairs includes 2 bedrooms, a full bath and an efficiency kitchen. The lower level boasts a large kitchen, sitting room, and 3 bedrooms. Potential for a bed and breakfast, air BnB or apartments!
Key facts
- Separate entrance
- Large lot
- Huge laundry room
Tags
Neighborhood map
What this means for you Summary
Snapshot
- This is a 2 × 2-bed/?-bath units multifamily listed at $289k.
Deal economics
- At list price, monthly cash flow is $47 ($562/yr) — positive. Per door: $23/mo.
- The deal already cash-flows at list — no discount required.
- To meet the 1% rule (rent ≥ 1% of price), the offer needs to be $254k (12.2% below list).
- Recommended offer: $254k (12.2% below list) — sets the bar for 1% rule.
- Cap rate 6.5% vs local median 4.4% in Pulaski — top-decile yield for the area; either an underpriced asset or a hidden risk that comps aren't pricing in. Stress-test before assuming the spread holds.
Location & tenants
- Location reads 74/100 on livability (#302 in NY, #4,860 nationally) — a middle-class / working-renter tenant base. Strengths: housing A+, health & safety A+, crime A; Watch: amenities D-, commute F.
- Pulaski Central School District (rural): math 44% / reading 58% proficiency, ranked #377 of 590 in NY (top 64%) — acceptable for families but not a draw, mixed tenant base, ~2y average lease.
- Market conditions: 63 active listings in the ZIP; 172 units permitted in Oswego County in 2024 (27 in 5+ unit buildings).
Forward outlook
- In year one you build about $26k of equity ($2k loan paydown + $24k appreciation (8.1% local appreciation)).
- Oswego County population projected at -23% by 2050 — secular population decline; favor cash flow + early exit over multi-decade hold.
- At projected returns (8.1% appreciation + 3.0% rent growth), your $81k cash investment doubles in ~3 years — after that, you're playing with house money.
- By year 2, paydown + projected appreciation supports a ~$41k cash-out refi (75% LTV) — recoverable capital for the next deal without selling this one.
Negotiation context
- Only 10 days on market — expect competitive offers; lowballing is unlikely to land.
- 4 sale attempts since 7y ago with the ask held roughly flat each time — persistent listings suggest the price (not the market) is what's stuck; bring a comps-based counter.
- Current owner paid $50k; list at $289k implies a 478% gain — meaningful room to come down on a strong offer.
Risks & watch-outs
- Watch-outs: built in 1900 — expect roof / HVAC / electrical / plumbing capex.
Questions for the listing agent
- Can we see the unit-by-unit rent roll, current vacancy, and any below-market leases? What's the average tenancy length?
- What capital expenditures (roof, boiler, parking lot, exteriors) have been made in the last 5 years, and what's planned in the next 2?
- Built in 1900 — when were the roof, HVAC, electrical panel, plumbing, and water heater last replaced?
- Is there a deadline driving the sale (1031 exchange, divorce, estate, relocation)? That informs how much negotiation room exists.
- What's the average days-on-market for RENTAL listings here right now (not sales)? A rising rental-DOM trend means longer vacancies and softer asking-rent achievability than the comps imply.
- What's the recent tenant-quality profile in this submarket — average credit score on applications, eviction rate, late-payment / NSF rate, and stable-employment percentage? A property-management company in the area should have these aggregated.
- How much new apartment / multifamily construction is in the pipeline within 1–3 miles? Heavy new supply (>2% of stock underway) typically softens rents 12–24 months out; light construction supports rent growth.
Investment metrics
- 1% rule
- 0.88% ✗
- Cap rate
- 6.49%
- Cash-on-cash
- 0.69%
- DSCR
- 1.03
- GRM
- 9.5
CMA / ARV
No comps found within radius.
Projected returns pro-forma
8.13% appreciation · 3.0% rent growth · sell at horizon
- IRR
- 20.8%
- Equity multiple
- 2.54×
- Total profit
- $124,524
- Equity at exit
- $222,195
- IRR
- 19.2%
- Equity multiple
- 5.44×
- Total profit
- $359,212
- Equity at exit
- $443,592
Cash invested: $80,920 (down + closing). Projections, not guarantees.
Landlord ↔ Tenant lean methodology
- Overall (STATE)
- 15 Strongly Tenant-Friendly
- State New York
- 15 Strongly Tenant-Friendly · D+10
- County
- — inherits STATE
- City
- — inherits STATE
ZIP-level market 13142
- Home prices YoY
- 2.8%
- Active inventory
- 63
- Price-to-rent
- 19.0×
Monthly cashflow live
- Estimated rent
- $2,536 medium interval (Pro) →
- Mortgage (P&I)
- −$1,516
- Tax from tax record
- −$321 /mo · $3,848/yr
- Insurance
- −$120
- HOA
- −$0
- Vacancy / Maint / Mgmt
- −$533
- Net cashflow
- $47
Break-even live
2-unit breakdown (identical units grouped — click to expand)
| Units | Beds | Baths | Est. rent |
|---|---|---|---|
| 2× units | 2 | — | $2,536 |
| #1 | 2 | — | $1,268 |
| #2 | 2 | — | $1,268 |
| Total (2 units) | $2,536 | ||
UW: 25.0% down · 7.5% · 30yr · 1.5% tax · 5.0% vac · 8.0% maint · 8.0% mgmt
Financing live
Cash to close
- Down payment
- $72,250
- Closing costs
- $8,670
- Reserves months
- —
- Total cash needed
- —
Loan-product check · same deal, 3 products live
Conventional
25% down · 7.5% · 30yr
- Down + closing
- —
- Monthly P&I
- —
- Monthly cashflow
- —
- DSCR
- —
- Eligible?
- —
Personal DTI + credit; lowest rate.
DSCR
20% down · 8.5% · 30yr
- Down + closing
- —
- Monthly P&I
- —
- Monthly cashflow
- —
- DSCR
- —
- Eligible?
- —
No personal income docs; deal must DSCR.
Hard money
10% down · 12.0% · 12mo
- Down + closing
- —
- Monthly P&I
- —
- Monthly cashflow
- —
- DSCR
- —
- Eligible?
- —
Short-term bridge; refi at stabilization.
Listing history 8 events
-
2026-06-18days on market $289,000 Active 10 DOM
-
2026-06-17days on market $289,000 Active 9 DOM
-
2026-06-16days on market $289,000 Active 8 DOM
-
2026-06-15days on market $289,000 Active 7 DOM
-
2026-06-13days on market $289,000 Active 5 DOM
-
2026-06-12days on market $289,000 Active 4 DOM
-
2026-06-09remarks 331-char remark
-
2026-06-09$289,000 Active 1 DOM
ⓘ Source: listings_history table (triggers on properties + properties_extension) + one-shot
backfill from property_details.listing_events for pre-trigger history.
Tax reassessment forecast NY · Partial reset (capped growth)
- Current annual tax
- $3,848 · $321/mo
- Projected year-2 tax
- $4,366 · $364/mo
- Expected delta
- +$518/yr (+$43/mo · 13.5%)
ⓘ Screening estimate from a state-policy table — verify with the county assessor before closing.
Climate risk First Street
- Flood 1/10 Low FEMA zone X (unshaded) · 0% chance over 30 yrs
- Wildfire 1/10 Low
- Heat 2/10 Low 7 d/yr ≥91°F today · 18 d/yr by 30 yrs out
- Wind 1/10 Low 0% chance of damaging wind over 30 yrs
- Air quality 3/10 Moderate 3 unhealthy d/yr today · 4 by 30 yrs out
Nearby sold comps map
Loading sold comps map…
Walkable amenities ~0.75 mi
Loading nearby amenities…
Taxation est. · year 1
- Rental income
- $30,432
- − Mortgage interest
- −$16,188
- − Property taxes
- −$3,848
- − Insurance
- −$1,445
- − Repairs & maintenance
- −$2,435
- − Management
- −$2,435
- − Depreciation
- −$8,407
- Taxable loss
- −$4,326
- Est. tax savings @ 24.0%
- +$1,038
- After-tax cash flow
- $1,600/yr
For passive investors: Depreciation is non-cash, so a rental often shows a tax loss while cash-flowing — sheltering income. Rental losses are passive: they offset passive income freely, and up to $25,000/yr can offset ordinary (W-2) income if you actively participate and your MAGI is under $100k (phasing out to $0 by $150k); unused losses carry forward. On sale, claimed depreciation is recaptured at up to 25%, and gains may owe capital-gains tax (a 1031 exchange can defer both). Figures are a year-1 estimate at your 24.0% rate — not tax advice; consult a CPA.
Schools (NCES district)
- District
- Pulaski Central School District
- NCES district ID
- 3623880
- Math proficiency
- 44% ▼ -1.00%
- Reading proficiency
- 58% ▲ 13.00%
- Median HH income
- $44,689
- Composite
- 43.06/100
- National rank
- #3095
- State rank
- #377 of 590 in NY
Livability — Pulaski
- Score
- 74/100
- State rank
- #302
- US rank
- #4860
Category grades
Schools grade is shown separately in the Schools card above.
Census & demographics
- Census place
- Pulaski, NY
- City population
- 6,568
- Population (ZIP)
- 6,568
Population outlook (Oswego County) Hauer SSP2
- Today (2025)
- 114,465 people
- By 2030
- 109,968 · -3.9%
- By 2040
- 99,205 · -13.3%
- By 2050
- 87,979 · -23.1%
- By 2075
- 65,100 · -43.1%
- By 2100
- 47,117 · -58.8%
Race, ethnicity, and origin ACS 2023
- Neighborhood character
- Predominantly White (93%)
- Race & ethnicity
- White 93% Two or more races 4%
- Common ancestry
- Lithuanian 5% Romanian 3% Italian 3%
- Foreign-born
- 1%
- Languages at home
- 98% English-only · German/W. Germanic 1% Arabic 1%
Political lean MEDSL · Oswego
- 2024 margin
- Strong R (+24.2) · D 37.9% · R 62.1%
- 2008→2024 swing
- -26.6pp toward R · 2008: 2.5pp · 2024: -24.2pp
- All cycles
- 2024: R+24.2 2020: R+20.2 2016: R+23.2 2012: D+7.9 2008: D+2.5
Not yet ingested
- Civics
- —
Market trends
- HPI YoY
- ▲ 8.13%
- Current HPI
- 294.1918
- Rent YoY
- —
- Metro
- —
- State GDP YoY
- ▲ 2.60%
- F500 in state
- 92
Industry mix (Fortune 500 HQ in NY)
| Industry | F500 HQs | Revenue |
|---|---|---|
| Financial Services | 10 | $950B |
|
||
| Consumer Goods | 9 | $162B |
|
||
| Insurance | 4 | $225B |
|
||
| Telecommunications | 2 | $144B |
|
||
| Pharmaceuticals | 2 | $112B |
|
||
| Media / Entertainment | 2 | $69B |
|
||
Price history
+580.0% since first listed11 events — show timeline
- 2026-06-09 Listed $289,000 FSBO.com
- 2024-03-22 Sold (MLS) $50,000 CNYIS
- 2024-01-07 Pending — CNYIS
- 2023-12-06 Price Changed $80,000 CNYIS
- 2023-09-09 Price Changed $99,900 CNYIS
- 2023-07-05 Relisted — CNYIS
- 2023-07-02 Listing Removed — CNYIS
- 2023-07-02 Listed $150,000 CNYIS
- 2019-03-04 Listing Removed — CNYIS
- 2019-02-11 Listed $115,000 CNYIS
- 1993-11-29 Sold (Public Records) $42,500 Public Records
Property tax history
+4.1%/yrLatest (2025): $3,848 · +35.1% YoY. Source: county tax records.
Cash-flow waterfall
monthlySold comps — $/sqft
last 12 mo · ≤1 miLoading sold comps…